Harbour Main
Harbour Main, formerly Harbour Main-Whitbourne and Harbour Main-Bell Island, is a provincial electoral district for the House of Assembly of Newfoundland and Labrador, Canada. Prior to 1975, the district elected two MHAs.
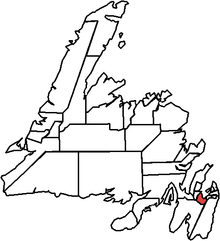 Harbour Main in relation to other districts in Newfoundland | |||
| Provincial electoral district | |||
| Legislature | Newfoundland and Labrador House of Assembly | ||
| MHA |
Progressive Conservative | ||
| District created | 1949 | ||
| First contested | 1949 | ||
| Last contested | 2019 | ||
| Demographics | |||
| Population (2011) | 14,885 | ||
| Electors (2015) | 10,208 | ||
| Area (km²) | 435 | ||
| Census divisions | Division No. 1 | ||
| Census subdivisions | Avondale, Brigus, Clarke's Beach, Colliers, Conception Bay South (part), Conception Harbour, Cupids, Division No. 1, Subd. M, Division No. 1, Subd. N, Division No. 1, Subd. O (part), Harbour Main-Chapel's Cove-Lakeview, Holyrood, North River, South River | ||
Historically a Tory stronghold, apart from a two-term Liberal breakthrough in the 1990s. It includes the southern portion of the town of Conception Bay South and the town of Holyrood, the farthest extern of the St. John's Metropolitan Area. As of 2011 the district has 9,005 eligible voters.[1]
Members of the House of Assembly
The district has elected the following Members of the House of Assembly:
Dual-Member District
| Legislature | Years | Member | Party | Member | Party | ||
|---|---|---|---|---|---|---|---|
| Harbour Main—Bell Island | |||||||
| 29th | 1949–1952 | David Ignatius Jackman | Progressive Conservative | Ronald J. Fahey | Progressive Conservative | ||
| 30th | 1952–1956 | Philip J. Lewis | Liberal | ||||
| Harbour Main | |||||||
| 31st | 1956–1959 | Matthew P. Whelan | Liberal | Philip J. Lewis | Liberal | ||
| 32nd | 1959–1962 | Albert E. Furey | Progressive Conservative | ||||
| 33rd | 1962–1966 | Clifton Joseph Joy | Liberal | ||||
| 34th | 1966–1971 | John William Mahoney | Liberal | ||||
| 35th | 1972 | Gordon William Dawe | Progressive Conservative | C. William Doody | Progressive Conservative | ||
| 36th | 1972–1975 | ||||||
Single-Member District
| Assembly | Years | Member | Party | |
|---|---|---|---|---|
| Harbour Main—Bell Island | ||||
| 37th | 1975-1979 | C. William Doody | Progressive Conservative | |
| 38th | 1979-1982 | Norman Doyle | Progressive Conservative | |
| 39th | 1982-1985 | |||
| Harbour Main | ||||
| 40th | 1985-1989 | Norman Doyle | Progressive Conservative | |
| 41st | 1989-1993 | |||
| 42nd | 1993-1996 | Don Whelan | Liberal | |
| Harbour Main—Whitbourne | ||||
| 43rd | 1996-1999 | Don Whelan | Liberal | |
| 44th | 1999-2003 | Tom Hedderson | Progressive Conservative | |
| 45th | 2003-2007 | |||
| Harbour Main | ||||
| 46th | 2007-2011 | Tom Hedderson | Progressive Conservative | |
| 47th | 2011-2015 | |||
| 48th | 2015-2019 | Betty Parsley | Liberal | |
| 49th | 2019-present | Helen Conway-Ottenheimer | Progressive Conservative | |
Election results
| 2019 Newfoundland and Labrador general election | ||||||||
|---|---|---|---|---|---|---|---|---|
| Party | Candidate | Votes | % | ±% | ||||
| Progressive Conservative | Helen Conway-Ottenheimer | 4,169 | 60.1 | +25.2 | ||||
| Liberal | Betty Parsley | 2,126 | 30.6 | -8.8 | ||||
| NL Alliance | Mike Cooze | 643 | 9.3 | – | ||||
| Total valid votes | 6,938 | 100 | ||||||
| Total rejected ballots | 57 | |||||||
| Turnout | 6,995 | 69.9 | +13.5 | |||||
| Eligible voters | 10,014 | |||||||
| 2015 Newfoundland and Labrador general election | ||||||||
|---|---|---|---|---|---|---|---|---|
| Party | Candidate | Votes | % | ±% | ||||
| Liberal | Betty Parsley | 2,253 | 39.41 | +28.19 | ||||
| Progressive Conservative | Curtis Buckle | 1,998 | 34.95 | -34.68 | ||||
| New Democratic | Raymond Flaherty | 1,381 | 24.16 | +5.01 | ||||
| Independent | Ted Noseworthy | 85 | 1.49 | |||||
| Total valid votes | 5,717 | 99.25 | ||||||
| Total rejected ballots | 43 | 0.75 | +0.30 | |||||
| Turnout | 5,760 | 56.43 | -0.65 | |||||
| Eligible voters | 10,208 | |||||||
| Liberal gain from Progressive Conservative | Swing | +31.44 | ||||||
| Source: Elections Newfoundland and Labrador[2] | ||||||||
| 2011 Newfoundland and Labrador general election | ||||||||
|---|---|---|---|---|---|---|---|---|
| Party | Candidate | Votes | % | ±% | ||||
| Progressive Conservative | Tom Hedderson | 3,600 | 69.63 | -13.09 | ||||
| New Democratic | Mike Maher | 990 | 19.15 | +13.32 | ||||
| Liberal | Bern Hickey | 580 | 11.22 | -0.23 | ||||
| Total valid votes | 5,170 | 99.56 | – | |||||
| Total rejected ballots | 23 | 0.44 | – | |||||
| Turnout | 5,193 | 57.08 | ||||||
| Eligible voters | 9,098 | |||||||
| Progressive Conservative hold | Swing | -13.21 | ||||||
| Source: Elections Newfoundland and Labrador[3] | ||||||||
| 2007 Newfoundland and Labrador general election | ||||||||
|---|---|---|---|---|---|---|---|---|
| Party | Candidate | Votes | % | ±% | ||||
| Progressive Conservative | Tom Hedderson | 4,586 | 82.72 | +12.00 | ||||
| Liberal | Kevin Slaney | 635 | 11.45 | -10.52 | ||||
| New Democratic | Jean Dandenault | 323 | 5.83 | -1.48 | ||||
| Total valid votes | 5,544 | 99.43 | – | |||||
| Total rejected ballots | 32 | 0.57 | – | |||||
| Turnout | 5,576 | 62.51 | -7.55 | |||||
| Eligible voters | 8,920 | |||||||
| Progressive Conservative hold | Swing | +11.26 | ||||||
| Source: Elections Newfoundland and Labrador[4] | ||||||||
| 2003 Newfoundland and Labrador general election | ||||||||
|---|---|---|---|---|---|---|---|---|
| Party | Candidate | Votes | % | ±% | ||||
| Progressive Conservative | Tom Hedderson | 4,769 | 70.72 | +15.81 | ||||
| Liberal | Fred Akerman | 1,482 | 21.97 | -15.47 | ||||
| New Democratic | Eugene Conway | 493 | 7.31 | -0.34 | ||||
| Total valid votes | 6,744 | 99.73 | – | |||||
| Total rejected ballots | 18 | 0.27 | – | |||||
| Turnout | 6,762 | 70.06 | +2.30 | |||||
| Eligible voters | 9,652 | |||||||
| Progressive Conservative hold | Swing | +15.64 | ||||||
| Source: Elections Newfoundland and Labrador[5] | ||||||||
| 1999 Newfoundland and Labrador general election | ||||||||
|---|---|---|---|---|---|---|---|---|
| Party | Candidate | Votes | % | ±% | ||||
| Progressive Conservative | Tom Hedderson | 3,670 | 54.91 | +13.14 | ||||
| Liberal | Wanda Dawe | 2,502 | 37.44 | -15.17 | ||||
| New Democratic | Fred Akerman | 511 | 7.65 | +3.96 | ||||
| Total valid votes | 6,683 | 99.76 | – | |||||
| Total rejected ballots | 16 | 0.24 | – | |||||
| Turnout | 6,699 | 67.76 | -3.01 | |||||
| Eligible voters | 9,886 | |||||||
| Progressive Conservative gain from Liberal | Swing | +14.16 | ||||||
| Source: Elections Newfoundland and Labrador[6] | ||||||||
| 1996 Newfoundland and Labrador general election | ||||||||
|---|---|---|---|---|---|---|---|---|
| Party | Candidate | Votes | % | ±% | ||||
| Liberal | Don Whelan | 3,407 | 52.61 | +6.82 | ||||
| Progressive Conservative | Eugene Conway | 2,705 | 41.77 | -1.69 | ||||
| New Democratic | Gus Flannigan | 239 | 3.69 | -7.06 | ||||
| Independent | Norm Sylvia | 125 | 1.93 | +1.93 | ||||
| Total valid votes | 6,476 | 99.83 | – | |||||
| Total rejected ballots | 11 | 0.17 | – | |||||
| Turnout | 6,487 | 70.77 | +2.28 | |||||
| Eligible voters | 9,167 | |||||||
| Liberal hold | Swing | +4.26 | ||||||
| Source: Elections Newfoundland and Labrador[7] | ||||||||
| 1993 Newfoundland and Labrador general election | ||||||||
|---|---|---|---|---|---|---|---|---|
| Party | Candidate | Votes | % | ±% | ||||
| Liberal | Don Whelan | 3,310 | 45.79 | +22.17 | ||||
| Progressive Conservative | Randy Simms | 3,141 | 43.46 | -22.13 | ||||
| New Democratic | Gus Flannigan | 777 | 10.75 | -0.04 | ||||
| Total valid votes | 7,228 | 99.75 | – | |||||
| Total rejected ballots | 18 | 0.25 | – | |||||
| Turnout | 7,246 | 68.49 | -10.16 | |||||
| Eligible voters | 10,580 | |||||||
| Liberal gain from Progressive Conservative | Swing | +22.15 | ||||||
| Source: Elections Newfoundland and Labrador[8] | ||||||||
| 1989 Newfoundland and Labrador general election | ||||||||
|---|---|---|---|---|---|---|---|---|
| Party | Candidate | Votes | % | ±% | ||||
| Progressive Conservative | Norman Doyle | 4,123 | 65.59 | +6.71 | ||||
| Liberal | Rod Fowler | 1,485 | 23.62 | +17.43 | ||||
| New Democratic | Gus Flannigan | 678 | 10.79 | -24.14 | ||||
| Total valid votes | 6,286 | 99.46 | – | |||||
| Total rejected ballots | 34 | 0.54 | – | |||||
| Turnout | 6,320 | 78.65 | -0.62 | |||||
| Eligible voters | 8,036 | |||||||
| Progressive Conservative hold | Swing | +12.07 | ||||||
| Source: Elections Newfoundland and Labrador[9] | ||||||||
| 1985 Newfoundland and Labrador general election | ||||||||
|---|---|---|---|---|---|---|---|---|
| Party | Candidate | Votes | % | ±% | ||||
| Progressive Conservative | Norman Doyle | 3,784 | 58.88 | -18.36 | ||||
| New Democratic | George J. Flaherty | 2,245 | 34.93 | +31.80 | ||||
| Liberal | Jerry J. Lewis | 398 | 6.19 | -13.44 | ||||
| Total valid votes | 6,427 | 99.67 | – | |||||
| Total rejected ballots | 21 | 0.33 | – | |||||
| Turnout | 6,448 | 79.27 | -2.40 | |||||
| Eligible voters | 8,134 | |||||||
| Progressive Conservative hold | Swing | -25.08 | ||||||
| Source: Elections Newfoundland and Labrador[10] | ||||||||
| 1982 Newfoundland and Labrador general election | ||||||||
|---|---|---|---|---|---|---|---|---|
| Party | Candidate | Votes | % | ±% | ||||
| Progressive Conservative | Norman Doyle | 4,238 | 77.24 | +16.57 | ||||
| Liberal | Joe Furey | 1,077 | 19.63 | -11.70 | ||||
| New Democratic | Bill Healey | 172 | 3.13 | -1.29 | ||||
| Total valid votes | 5,487 | 99.33 | – | |||||
| Total rejected ballots | 37 | 0.67 | – | |||||
| Turnout | 5,524 | 81.67 | +5.75 | |||||
| Eligible voters | 6,764 | |||||||
| Progressive Conservative hold | Swing | +14.14 | ||||||
| Source: Elections Newfoundland and Labrador[11] | ||||||||
| 1979 Newfoundland and Labrador general election | ||||||||
|---|---|---|---|---|---|---|---|---|
| Party | Candidate | Votes | % | ±% | ||||
| Progressive Conservative | Norman Doyle | 3,100 | 60.67 | -5.29 | ||||
| Liberal | Thomas Moore | 1,601 | 31.33 | -2.71 | ||||
| New Democratic | Margaret Peddle | 226 | 4.42 | +4.42 | ||||
| Independent | Michael J. Laurie | 183 | 3.58 | +3.58 | ||||
| Total valid votes | 5,110 | 99.51 | – | |||||
| Total rejected ballots | 25 | 0.49 | – | |||||
| Turnout | 5,135 | 75.92 | +6.68 | |||||
| Eligible voters | 6,764 | |||||||
| Progressive Conservative hold | Swing | -4.00 | ||||||
| Source: Elections Newfoundland and Labrador[12] | ||||||||
| 1975 Newfoundland general election | ||||||||
|---|---|---|---|---|---|---|---|---|
| Party | Candidate | Votes | % | ±% | ||||
| Progressive Conservative | William Doody | 2,944 | 65.96 | -12.45 | ||||
| Liberal | Wilfred Drover | 1,519 | 34.04 | +21.27 | ||||
| Total valid votes | 4,463 | 99.38 | – | |||||
| Total rejected ballots | 28 | 0.62 | – | |||||
| Turnout | 4,491 | 69.24 | ||||||
| Eligible voters | 6,486 | |||||||
| Progressive Conservative hold | Swing | +16.86 | ||||||
| Source: Elections Newfoundland and Labrador[13] | ||||||||
| 1972 Newfoundland general election | ||||||||
|---|---|---|---|---|---|---|---|---|
| Party | Candidate | Votes | % | ±% | Elected | |||
| Progressive Conservative | Gordon Dawe | 5,181 | 40.09 | +11.97 | √ | |||
| Progressive Conservative | William Doody | 4,953 | 38.32 | +12.32 | √ | |||
| Liberal | Richard Gosse | 1,651 | 12.77 | – | ||||
| Independent | Hugh Joseph Shea | 1,140 | 8.82 | – | ||||
| Total valid votes | 12,925 | – | ||||||
| Total rejected ballots | 48 | – | ||||||
| Eligible voters | 9,389 | |||||||
| Source: Elections Newfoundland and Labrador[14] | ||||||||
| 1971 Newfoundland general election | ||||||||
|---|---|---|---|---|---|---|---|---|
| Party | Candidate | Votes | % | ±% | Elected | |||
| Progressive Conservative | Gordon Dawe | 4,417 | 28.12 | +4.36 | √ | |||
| Progressive Conservative | William Doody | 4,084 | 26.00 | √ | ||||
| Liberal | John W. Mahoney | 3,605 | 22.95 | –3.67 | ||||
| Liberal | Ralph E. Fagan | 3,452 | 21.97 | – | ||||
| New Democratic | Darrell Cole | 151 | 0.96 | – | ||||
| Total valid votes | 15,709 | – | ||||||
| 1966 Newfoundland general election | ||||||||
|---|---|---|---|---|---|---|---|---|
| Party | Candidate | Votes | % | Elected | ||||
| Liberal | Phillip J. Lewis | 2,712 | 30.83 | √ | ||||
| Liberal | John W. Mahoney | 2,342 | 26.62 | √ | ||||
| Progressive Conservative | Gordon Dawe | 2,090 | 23.76 | |||||
| Progressive Conservative | J. J. Carroll | 1,120 | 12.73 | |||||
| Independent | J. J. Hickey | 534 | 6.07 | – | ||||
| Total valid votes | 8,798 | – | ||||||
References
- "Summary of Polling Divisions HARBOUR MAIN" (PDF). Elections Newfoundland and Labrador. 3 August 2011. Retrieved 3 September 2011.
- "2015 Provincial General Election Report" (PDF). Elections Newfoundland and Labrador. 25 July 2016. Archived from the original (PDF) on 18 July 2017. Retrieved 21 November 2018.
- "Report on the Provincial General Election, October 11, 2011" (PDF). Office of the Chief Electoral Officer of Newfoundland and Labrador. 8 June 2012. Retrieved 16 May 2019.
- "Report on the Provincial General Election, October 9, 2007" (PDF). Office of the Chief Electoral Officer of Newfoundland and Labrador. 7 July 2008. Archived from the original (PDF) on 20 October 2016. Retrieved 21 November 2018.
- "Report on the October 21, 2003 General Election" (PDF). Office of the Chief Electoral Officer of Newfoundland and Labrador. 9 July 2004. Archived from the original (PDF) on 4 March 2016. Retrieved 21 November 2018.
- "Report of the Chief Electoral Officer on the General Election for the Forty-Fourth General Assembly, February 9, 1999" (PDF). Office of the Chief Electoral Officer of Newfoundland and Labrador. 9 November 1999. Archived from the original (PDF) on 28 November 2015. Retrieved 21 November 2018.
- "Report of the Chief Electoral Officer on the General Election for the Forty-Third General Assembly, February 22, 1996" (PDF). Office of the Chief Electoral Officer of Newfoundland and Labrador. 28 October 1996. Archived from the original (PDF) on 28 November 2015. Retrieved 21 November 2018.
- "Report of the Chief Electoral Officer on the General Election for the Forty-Second General Assembly, May 3, 1993" (PDF). Office of the Chief Electoral Officer of Newfoundland and Labrador. 1994. Archived from the original (PDF) on 28 November 2015. Retrieved 21 November 2018.
- "Election Statistics 1989" (PDF). Office of the Chief Electoral Officer of Newfoundland and Labrador. 1989. Archived from the original (PDF) on 4 March 2016. Retrieved 21 November 2018.
- "Election Returns 1985" (PDF). Office of the Chief Electoral Officer of Newfoundland and Labrador. 22 October 1985. Archived from the original (PDF) on 4 March 2016. Retrieved 21 November 2018.
- "Election Returns 1982" (PDF). Office of the Chief Electoral Officer of Newfoundland and Labrador. 25 August 1982. Archived from the original (PDF) on 23 November 2015. Retrieved 21 November 2018.
- "Election Returns 1979" (PDF). Office of the Chief Electoral Officer of Newfoundland and Labrador. 12 October 1979. Archived from the original (PDF) on 4 March 2016. Retrieved 22 November 2018.
- "Election Returns 1975" (PDF). Office of the Chief Electoral Officer of Newfoundland and Labrador. 30 April 1976. Archived from the original (PDF) on 23 November 2015. Retrieved 22 November 2018.
- "General Election Returns, March 24, 1972" (PDF). Office of the Chief Electoral Officer of Newfoundland and Labrador. 1973. Archived from the original (PDF) on 5 March 2016. Retrieved 22 November 2018.
External links
This article is issued from Wikipedia. The text is licensed under Creative Commons - Attribution - Sharealike. Additional terms may apply for the media files.