Cape St. Francis (electoral district)
Cape St. Francis is a provincial electoral district for the House of Assembly of Newfoundland and Labrador, Canada.
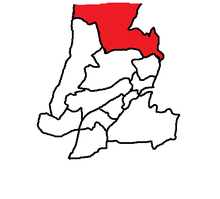 Cape St. Francis (red) in relation to other districts in the St. John's Metropolitan Area. | |||
| Provincial electoral district | |||
| Legislature | Newfoundland and Labrador House of Assembly | ||
| MHA |
Progressive Conservative | ||
| District created | 1966 | ||
| First contested | 1966 | ||
| Last contested | 2019 | ||
| Demographics | |||
| Population (2011) | 13,215 | ||
| Electors (2015) | 8,671 | ||
| Area (km²) | 150 | ||
| Census divisions | Division No. 1 | ||
| Census subdivisions | Torbay, Logy Bay-Middle Cove-Outer Cove, Pouch Cove, Flatrock, Bauline | ||
The vast majority of the district is made up of suburban communities neighbouring the provincial capital St. John's, though the district does take in the northeast end of the city. The majority of residents commute into St. John's daily for work. Prior to 1996, the district was named St. John's East Extern.
The district's boundaries encompass the northeastern tip of Avalon Peninsula, including the outer stretches of St. John's as well as Bauline, Flatrock, Logy Bay-Middle Cove-Outer Cove, Pouch Cove and Torbay.
The district has been a Progressive Conservative stronghold for over 40 years.
Members of the House of Assembly
The district has elected the following Members of the House of Assembly:
| Assembly | Years | Member | Party | |
|---|---|---|---|---|
| St. John's East Extern | ||||
| 34th | 1966-1971 | Tom Hickey | Progressive Conservative | |
| 35th | 1972 | |||
| 36th | 1972-1975 | |||
| 37th | 1975-1979 | |||
| 38th | 1979-1982 | |||
| 39th | 1982-1985 | |||
| 40th | 1985-1986 | |||
| 1986-1989 | Kevin Parsons, Sr. | Progressive Conservative | ||
| 41st | 1989-1993 | |||
| 42nd | 1993-1996 | Jack Byrne | Progressive Conservative | |
| Cape St. Francis | ||||
| 43rd | 1996-1999 | Jack Byrne | Progressive Conservative | |
| 44th | 1999-2003 | |||
| 45th | 2003-2007 | |||
| 46th | 2007-2008 | |||
| 2008-2011 | Kevin Parsons | Progressive Conservative | ||
| 47th | 2011-2015 | |||
| 48th | 2015-2019 | |||
| 49th | 2019–Present | |||
Election results
| 2019 Newfoundland and Labrador general election | ||||||||
|---|---|---|---|---|---|---|---|---|
| Party | Candidate | Votes | % | ±% | ||||
| Progressive Conservative | Kevin Parsons | 4,539 | 72.2 | +5.9 | ||||
| Liberal | Michael Duffy | 1,115 | 17.7 | -8.5 | ||||
| New Democratic | Peter Beck | 396 | 6.3 | -1.2 | ||||
| NL Alliance | Ryan Lane | 233 | 3.7 | – | ||||
| Total valid votes | 6,283 | 100 | ||||||
| Total rejected ballots | 36 | |||||||
| Turnout | 6,319 | 71.4 | +0.02 | |||||
| Eligible voters | 8,850 | |||||||
| 2015 Newfoundland and Labrador general election | ||||||||
|---|---|---|---|---|---|---|---|---|
| Party | Candidate | Votes | % | ±% | ||||
| Progressive Conservative | Kevin Parsons | 4,086 | 66.34 | +6.97 | ||||
| Liberal | Geoff Gallant | 1,613 | 26.19 | +23.26 | ||||
| New Democratic | Mark Gruchy | 460 | 7.47 | -30.22 | ||||
| Total valid votes | 6,159 | 99.52 | – | |||||
| Total rejected ballots | 30 | 0.48 | -0.04 | |||||
| Turnout | 6,189 | 71.38 | +5.85 | |||||
| Eligible voters | 8,671 | |||||||
| Progressive Conservative hold | Swing | -8.15 | ||||||
| Source: Elections Newfoundland and Labrador[1] | ||||||||
| 2011 Newfoundland and Labrador general election | ||||||||
|---|---|---|---|---|---|---|---|---|
| Party | Candidate | Votes | % | ±% | ||||
| Progressive Conservative | Kevin Parsons | 4,132 | 59.38 | -9.59 | ||||
| New Democratic | Geoff Gallant | 2,623 | 37.69 | +14.29 | ||||
| Liberal | Joy Buckle | 204 | 2.93 | -4.70 | ||||
| Total valid votes | 6,959 | 99.47 | – | |||||
| Total rejected ballots | 37 | 0.53 | – | |||||
| Turnout | 6,996 | 65.53 | ||||||
| Eligible voters | 10,676 | |||||||
| Progressive Conservative hold | Swing | -11.94 | ||||||
| Source: Elections Newfoundland and Labrador[2] | ||||||||
| Newfoundland and Labrador provincial by-election, August 27, 2008 upon the death of Jack Byrne | ||||||||
|---|---|---|---|---|---|---|---|---|
| Party | Candidate | Votes | % | ±% | ||||
| Progressive Conservative | Kevin Parsons | 2,865 | 68.97 | -8.87 | ||||
| New Democratic | Kathleen Connors | 972 | 23.40 | +12.78 | ||||
| Liberal | Tonia Power-Mercer | 317 | 7.63 | -3.91 | ||||
| Total valid votes | 4,154 | 99.74 | – | |||||
| Total rejected ballots | 11 | 0.26 | – | |||||
| Turnout | 4,165 | 42.01 | -29.00 | |||||
| Eligible voters | 9,914 | |||||||
| Progressive Conservative hold | Swing | -10.83 | ||||||
| Source: Elections Newfoundland and Labrador[3] | ||||||||
| 2007 Newfoundland and Labrador general election | ||||||||
|---|---|---|---|---|---|---|---|---|
| Party | Candidate | Votes | % | ±% | ||||
| Progressive Conservative | Jack Byrne | 4,983 | 77.84 | +6.70 | ||||
| Liberal | Bill Tapper | 739 | 11.54 | -4.89 | ||||
| New Democratic | Kathleen Connors | 680 | 10.62 | -1.82 | ||||
| Total valid votes | 6,402 | 99.50 | – | |||||
| Total rejected ballots | 32 | 0.50 | – | |||||
| Turnout | 6,434 | 71.01 | ||||||
| Eligible voters | 9,061 | |||||||
| Progressive Conservative hold | Swing | +5.80 | ||||||
| Source: Elections Newfoundland and Labrador[4] | ||||||||
| 2003 Newfoundland and Labrador general election | ||||||||
|---|---|---|---|---|---|---|---|---|
| Party | Candidate | Votes | % | ±% | ||||
| Progressive Conservative | Jack Byrne | 5,604 | 71.14 | +9.47 | ||||
| Liberal | Bill Tapper | 1,294 | 16.43 | -15.44 | ||||
| New Democratic | Ralph Tapper | 980 | 12.44 | +5.98 | ||||
| Total valid votes | 7,878 | 99.58 | – | |||||
| Total rejected ballots | 33 | 0.42 | – | |||||
| Turnout | 7,911 | 66.49 | +4.31 | |||||
| Eligible voters | 11,898 | |||||||
| Progressive Conservative hold | Swing | +12.46 | ||||||
| Source: Elections Newfoundland and Labrador[5] | ||||||||
| 1999 Newfoundland and Labrador general election | ||||||||
|---|---|---|---|---|---|---|---|---|
| Party | Candidate | Votes | % | ±% | ||||
| Progressive Conservative | Jack Byrne | 4,197 | 61.67 | +10.58 | ||||
| Liberal | Jim Martin | 2,169 | 31.87 | -17.04 | ||||
| New Democratic | Shawn Sullivan | 440 | 6.46 | +6.46 | ||||
| Total valid votes | 6,806 | 99.72 | – | |||||
| Total rejected ballots | 19 | 0.27 | – | |||||
| Turnout | 6,825 | 62.18 | -10.81 | |||||
| Eligible voters | 10,171 | |||||||
| Progressive Conservative hold | Swing | +13.81 | ||||||
| Source: Elections Newfoundland and Labrador[6] | ||||||||
| 1996 Newfoundland and Labrador general election | ||||||||
|---|---|---|---|---|---|---|---|---|
| Party | Candidate | Votes | % | ±% | ||||
| Progressive Conservative | Jack Byrne | 3,299 | 51.09 | +4.05 | ||||
| Liberal | Jim Martin | 3,158 | 48.91 | +10.51 | ||||
| Total valid votes | 6,457 | 99.41 | – | |||||
| Total rejected ballots | 38 | 0.59 | – | |||||
| Turnout | 6,495 | 72.99 | -4.46 | |||||
| Eligible voters | 8,898 | |||||||
| Progressive Conservative hold | Swing | +7.28 | ||||||
| Source: Elections Newfoundland and Labrador[7] | ||||||||
| 1993 Newfoundland and Labrador general election | ||||||||
|---|---|---|---|---|---|---|---|---|
| Party | Candidate | Votes | % | ±% | ||||
| Progressive Conservative | Jack Byrne | 4,144 | 47.04 | -1.80 | ||||
| Liberal | Sam Connors | 3,383 | 38.40 | +6.75 | ||||
| New Democratic | Cle Newhook | 1,283 | 14.56 | -4.95 | ||||
| Total valid votes | 8,810 | 99.64 | – | |||||
| Total rejected ballots | 32 | 0.36 | – | |||||
| Turnout | 8,842 | 77.45 | -8.12 | |||||
| Eligible voters | 11,416 | |||||||
| Progressive Conservative hold | Swing | -4.28 | ||||||
| Source: Elections Newfoundland and Labrador[8] | ||||||||
| 1989 Newfoundland and Labrador general election | ||||||||
|---|---|---|---|---|---|---|---|---|
| Party | Candidate | Votes | % | ±% | ||||
| Progressive Conservative | Kevin Parsons, Sr. | 3,750 | 48.84 | +2.77 | ||||
| Liberal | John O'Brien | 2,430 | 31.65 | +9.57 | ||||
| New Democratic | Cle Newhook | 1,498 | 19.51 | -12.34 | ||||
| Total valid votes | 7,678 | 99.84 | – | |||||
| Total rejected ballots | 12 | 0.16 | – | |||||
| Turnout | 7,690 | 85.57 | +17.16 | |||||
| Eligible voters | 8,987 | |||||||
| Progressive Conservative hold | Swing | +6.17 | ||||||
| Source: Elections Newfoundland and Labrador[9] | ||||||||
| Newfoundland and Labrador provincial by-election, December 9, 1986 upon the resignation of Tom Hickey | ||||||||
|---|---|---|---|---|---|---|---|---|
| Party | Candidate | Votes | % | ±% | ||||
| Progressive Conservative | Kevin Parsons, Sr. | 2,462 | 46.07 | -9.59 | ||||
| New Democratic | Cle Newhook | 1,702 | 31.85 | +10.00 | ||||
| Liberal | Roger W. Carter | 1,180 | 22.08 | -0.41 | ||||
| Total valid votes | 5,344 | 99.87 | – | |||||
| Total rejected ballots | 7 | 0.13 | – | |||||
| Turnout | 5,351 | 68.41 | -12.09 | |||||
| Eligible voters | 7,812 | |||||||
| Progressive Conservative hold | Swing | -9.80 | ||||||
| Source: Elections Newfoundland and Labrador[10] | ||||||||
| 1985 Newfoundland and Labrador general election | ||||||||
|---|---|---|---|---|---|---|---|---|
| Party | Candidate | Votes | % | ±% | ||||
| Progressive Conservative | Tom Hickey | 3,489 | 55.66 | -16.98 | ||||
| Liberal | Thomas Fred Littlejohn | 1,410 | 22.49 | +2.22 | ||||
| New Democratic | Robert Anderson | 1,370 | 21.85 | +14.76 | ||||
| Total valid votes | 6,269 | 99.68 | – | |||||
| Total rejected ballots | 20 | 0.32 | – | |||||
| Turnout | 6,289 | 80.50 | -0.38 | |||||
| Eligible voters | 7,812 | |||||||
| Progressive Conservative hold | Swing | -9.6 | ||||||
| Source: Elections Newfoundland and Labrador[11] | ||||||||
| 1982 Newfoundland and Labrador general election | ||||||||
|---|---|---|---|---|---|---|---|---|
| Party | Candidate | Votes | % | ±% | ||||
| Progressive Conservative | Tom Hickey | 4,795 | 72.64 | +11.01 | ||||
| Liberal | David Wheeler | 1,338 | 20.27 | -10.17 | ||||
| New Democratic | Robert Anderson | 468 | 7.09 | -0.84 | ||||
| Total valid votes | 6,601 | 99.77 | – | |||||
| Total rejected ballots | 15 | 0.23 | – | |||||
| Turnout | 6,616 | 80.88 | +1.54 | |||||
| Eligible voters | 8,180 | |||||||
| Progressive Conservative hold | Swing | +10.59 | ||||||
| Source: Elections Newfoundland and Labrador[12] | ||||||||
| 1979 Newfoundland and Labrador general election | ||||||||
|---|---|---|---|---|---|---|---|---|
| Party | Candidate | Votes | % | ±% | ||||
| Progressive Conservative | Tom Hickey | 3,989 | 61.63 | -3.65 | ||||
| Liberal | Roland James Manning | 1,970 | 30.44 | -4.28 | ||||
| New Democratic | Ed Roche | 513 | 7.93 | +7.93 | ||||
| Total valid votes | 6,472 | 99.72 | – | |||||
| Total rejected ballots | 18 | 0.28 | – | |||||
| Turnout | 6,490 | 79.34 | -2.71 | |||||
| Eligible voters | 8,180 | |||||||
| Progressive Conservative hold | Swing | -3.97 | ||||||
| Source: Elections Newfoundland and Labrador[13] | ||||||||
| 1975 Newfoundland general election | ||||||||
|---|---|---|---|---|---|---|---|---|
| Party | Candidate | Votes | % | ±% | ||||
| Progressive Conservative | Tom Hickey | 3,318 | 65.28 | -13.64 | ||||
| Liberal | Michael J. Laurie | 1,765 | 34.72 | +13.64 | ||||
| Total valid votes | 5,083 | 99.22 | – | |||||
| Total rejected ballots | 40 | 0.78 | – | |||||
| Turnout | 5,123 | 82.05 | +9.04 | |||||
| Eligible voters | 6,244 | |||||||
| Progressive Conservative hold | Swing | -13.64 | ||||||
| Source: Elections Newfoundland and Labrador[14] | ||||||||
| 1972 Newfoundland general election | ||||||||
|---|---|---|---|---|---|---|---|---|
| Party | Candidate | Votes | % | ±% | ||||
| Progressive Conservative | Tom Hickey | 8,039 | 78.92 | |||||
| Liberal | Austin Ryan | 2,147 | 21.08 | |||||
| Total valid votes | 10,186 | 99.35 | – | |||||
| Total rejected ballots | 67 | 0.65 | – | |||||
| Turnout | 10,253 | 73.01 | ||||||
| Eligible voters | 14,042 | |||||||
| Progressive Conservative hold | Swing | |||||||
| Source: Elections Newfoundland and Labrador[15] | ||||||||
References
- "2015 Provincial General Election Report" (PDF). Elections Newfoundland and Labrador. 25 July 2016. Retrieved 16 May 2019.
- "Report on the Provincial General Election, October 11, 2011" (PDF). Office of the Chief Electoral Officer of Newfoundland and Labrador. 8 June 2012. Retrieved 16 May 2019.
- "Report of the Chief Electoral Officer on Baie Verte-Springdale and Cape St. Francis By-Elections, August 27, 2008" (PDF). Office of the Chief Electoral Officer of Newfoundland and Labrador. 11 November 2008. Retrieved 22 December 2018.
- "Report on the Provincial General Election, October 9, 2007" (PDF). Office of the Chief Electoral Officer of Newfoundland and Labrador. 7 July 2008. Archived from the original (PDF) on 20 October 2016. Retrieved 21 November 2018.
- "Report on the October 21, 2003 General Election" (PDF). Office of the Chief Electoral Officer of Newfoundland and Labrador. 9 July 2004. Archived from the original (PDF) on 4 March 2016. Retrieved 21 November 2018.
- "Report of the Chief Electoral Officer on the General Election for the Forty-Fourth General Assembly, February 9, 1999" (PDF). Office of the Chief Electoral Officer of Newfoundland and Labrador. 9 November 1999. Archived from the original (PDF) on 28 November 2015. Retrieved 21 November 2018.
- "Report of the Chief Electoral Officer on the General Election for the Forty-Third General Assembly, February 22, 1996" (PDF). Office of the Chief Electoral Officer of Newfoundland and Labrador. 28 October 1996. Archived from the original (PDF) on 28 November 2015. Retrieved 21 November 2018.
- "Report of the Chief Electoral Officer on the General Election for the Forty-Second General Assembly, May 3, 1993" (PDF). Office of the Chief Electoral Officer of Newfoundland and Labrador. 1994. Archived from the original (PDF) on 28 November 2015. Retrieved 21 November 2018.
- "Election Statistics 1989" (PDF). Office of the Chief Electoral Officer of Newfoundland and Labrador. 1989. Archived from the original (PDF) on 4 March 2016. Retrieved 21 November 2018.
- "Election Statistics 1986, By-Elections Held December 9, 1986 in the Electoral Districts of St. John's East, and St. John's East Extern" (PDF). Office of the Chief Electoral Officer of Newfoundland and Labrador. Retrieved 22 December 2018.
- "Election Returns 1985" (PDF). Office of the Chief Electoral Officer of Newfoundland and Labrador. 22 October 1985. Archived from the original (PDF) on 4 March 2016. Retrieved 21 November 2018.
- "Election Returns 1982" (PDF). Office of the Chief Electoral Officer of Newfoundland and Labrador. 25 August 1982. Archived from the original (PDF) on 23 November 2015. Retrieved 21 November 2018.
- "Election Returns 1979" (PDF). Office of the Chief Electoral Officer of Newfoundland and Labrador. 12 October 1979. Archived from the original (PDF) on 4 March 2016. Retrieved 22 November 2018.
- "Election Returns 1975" (PDF). Office of the Chief Electoral Officer of Newfoundland and Labrador. 30 April 1976. Archived from the original (PDF) on 23 November 2015. Retrieved 22 November 2018.
- "General Election Returns, March 24, 1972" (PDF). Office of the Chief Electoral Officer of Newfoundland and Labrador. 1973. Archived from the original (PDF) on 5 March 2016. Retrieved 22 November 2018.