Flow map
In cartography, flow maps are a mix of maps and flow charts, that "show the movement of objects from one location to another, such as the number of people in a migration, the amount of goods being traded, or the number of packets in a network".[1]
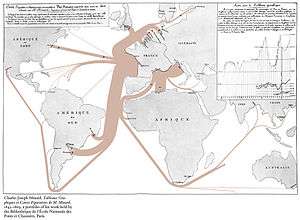
Charles Joseph Minard’s map of French wine exports for 1864.
Overview
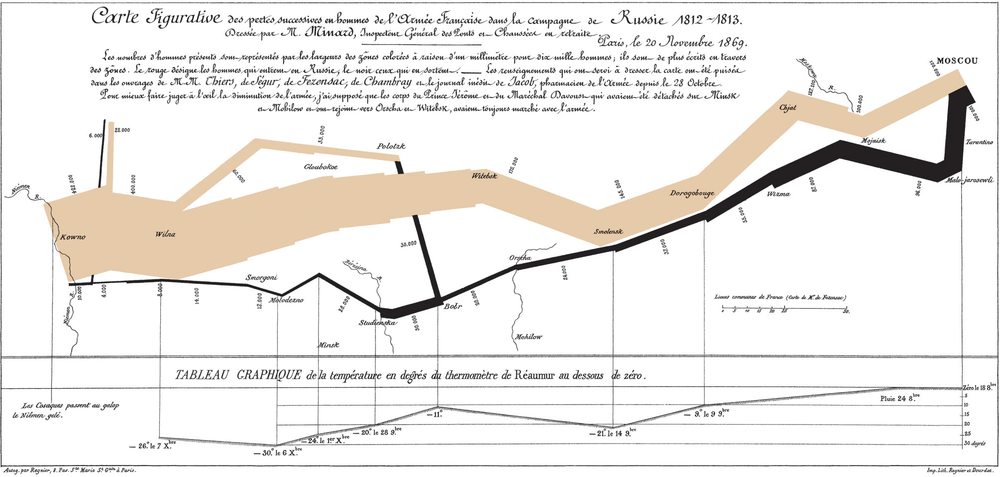
Minard's map of Napoleon's disastrous Russian campaign of 1812.
Flow maps can be used to show movement of almost anything, such as:[2]
- What it is that flows, moves, migrates, etc.
- What direction the flow is moving and/or what the source and destination are.
- How much is flowing, being transferred, transported, etc.
- General information about what is flowing and how it is flowing.
In contrast to route maps, flow maps show little aside from the paths from one point to another.[2]
Other types of flow maps
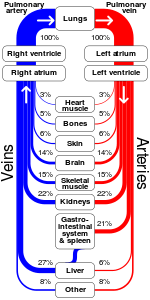
A non-cartographic flow map showing the relative percentages of cardiac output delivered to major organ systems
Beside the flow maps in cartography there are several other kind of flow maps:
- Baker flow map of fluid flows
- Blood flow maps, see history of neuroimaging
- Flow map or solution operator, see random dynamical system
- Process flow map of a manufacturing process
- Sankey diagram in petroleum engineering
- Traffic Flow Maps
- XSL flow maps, see XSL Formatting Objects
See also
- Flow diagram (disambiguation)
- Thematic map
References
- Phan, Doantam; Xiao, Ling; Yeh, Ron; Hanrahan, Pat; Winograd, Terry (2005). "Flow Map Layout". Proceedings of the 2005 IEEE Symposium on Information Visualization (InfoVis '05): 219–224. doi:10.1109/INFVIS.2005.1532150.
- Harris, Robert L. (1999). Information Graphics. p. 157.
Further reading
- Dent, Borden D. (1999). Cartography: Thematic Map Design. New York: McGraw-Hill. ISBN 0-697-38495-0.
- MacEachren, Alan (1995). How Maps Work: Representation, Visualization, and Design. New York: Guilford Press. ISBN 1-57230-040-X.
- Harris, Robert L. (1999). Information Graphics. Oxford University Press. ISBN 0-19-513532-6.
External links
| Wikimedia Commons has media related to Flow maps. |
This article is issued from Wikipedia. The text is licensed under Creative Commons - Attribution - Sharealike. Additional terms may apply for the media files.