East Oakdale, California
East Oakdale is an unincorporated census-designated place (CDP) on the Stanislaus River, located east of the city of Oakdale in Stanislaus County, California.
East Oakdale | |
|---|---|
 Location in Stanislaus County and the state of California | |
| Coordinates: 37°47′37″N 120°48′24″W | |
| Country | |
| State | |
| County | Stanislaus |
| Area | |
| • Total | 5.213 sq mi (13.503 km2) |
| • Land | 4.771 sq mi (12.357 km2) |
| • Water | 0.442 sq mi (1.146 km2) 8.49% |
| Elevation | 144 ft (44 m) |
| Population (2010) | |
| • Total | 2,762 |
| • Density | 530/sq mi (200/km2) |
| Time zone | UTC-8 (Pacific (PST)) |
| • Summer (DST) | UTC-7 (PDT) |
| ZIP code | 95361 |
| Area code(s) | 209 |
| FIPS code | 06-20907 |
| GNIS feature ID | 1853386 |
It is part of the Modesto Metropolitan Statistical Area in the San Joaquin Valley. The population was 2,762 at the 2010 census.
Geography
East Oakdale is located at 37°47′37″N 120°48′24″W (37.793528, -120.806669).[2]
According to the United States Census Bureau, the CDP has a total area of 5.2 square miles (13 km2), of which, 4.7 square miles (12 km2) of it is land and 0.4 square miles (1.0 km2) of it (8.49%) is water.
History
There were three ferries crossing the Stanislaus River on the 19th−century Stockton - Los Angeles Road. The site of the easternmost crossing, Heath & Emory's Ferry, is in present-day East Oakdale. The second, Taylor's Ferry Crossing, was located in the present day city of Oakdale. The third, Islips Ferry, was further down river in present-day Langworth.
Demographics
| Historical population | |||
|---|---|---|---|
| Census | Pop. | %± | |
| U.S. Decennial Census[3] | |||
2010
At the 2010 census East Oakdale had a population of 2,762. The population density was 529.8 people per square mile (204.6/km²). The racial makeup of East Oakdale was 2,530 (91.6%) White, 7 (0.3%) African American, 18 (0.7%) Native American, 60 (2.2%) Asian, 5 (0.2%) Pacific Islander, 78 (2.8%) from other races, and 64 (2.3%) from two or more races. Hispanic or Latino of any race were 284 people (10.3%).[4]
The whole population lived in households, no one lived in non-institutionalized group quarters and no one was institutionalized.
There were 1,055 households, 301 (28.5%) had children under the age of 18 living in them, 809 (76.7%) were opposite-sex married couples living together, 40 (3.8%) had a female householder with no husband present, 27 (2.6%) had a male householder with no wife present. There were 31 (2.9%) unmarried opposite-sex partnerships, and 3 (0.3%) same-sex married couples or partnerships. 138 households (13.1%) were one person and 78 (7.4%) had someone living alone who was 65 or older. The average household size was 2.62. There were 876 families (83.0% of households); the average family size was 2.87.
The age distribution was 562 people (20.3%) under the age of 18, 159 people (5.8%) aged 18 to 24, 413 people (15.0%) aged 25 to 44, 1,046 people (37.9%) aged 45 to 64, and 582 people (21.1%) who were 65 or older. The median age was 50.0 years. For every 100 females, there were 94.5 males. For every 100 females age 18 and over, there were 97.0 males.
There were 1,102 housing units at an average density of 211.4 per square mile, of the occupied units 984 (93.3%) were owner-occupied and 71 (6.7%) were rented.The homeowner vacancy rate was 1.8%; the rental vacancy rate was 5.3%. 2,553 people (92.4% of the population) lived in owner-occupied housing units and 209 people (7.6%) lived in rental housing units.
2000
At the 2000 census there were 2,742 people, 989 households, and 824 families in the CDP. The population density was 486.9 people per square mile (188.0/km²). There were 1,032 housing units at an average density of 183.3 per square mile (70.8/km²). The racial makeup of the CDP was 91.28% White, 0.36% African American, 1.86% Native American, 1.64% Asian, 0.07% Pacific Islander, 2.08% from other races, and 2.70% from two or more races. Hispanic or Latino of any race were 6.82%.[5]
Of the 989 households 33.1% had children under the age of 18 living with them, 75.8% were married couples living together, 5.4% had a female householder with no husband present, and 16.6% were non-families. 13.5% of households were one person and 5.9% were one person aged 65 or older. The average household size was 2.77 and the average family size was 3.03.
The age distribution was 25.3% under the age of 18, 5.5% from 18 to 24, 22.2% from 25 to 44, 34.0% from 45 to 64, and 13.0% 65 or older. The median age was 44 years. For every 100 females, there were 104.9 males. For every 100 females age 18 and over, there were 102.9 males.
The median household income was $70,227 and the median family income was $83,587. Males had a median income of $70,096 versus $36,602 for females. The per capita income for the CDP was $40,633. About 5.1% of families and 7.9% of the population were below the poverty line, including 11.3% of those under age 18 and 3.0% of those age 65 or over.
Government
In the California State Legislature, East Oakdale is in the 8th Senate District, represented by Republican Andreas Borgeas, and the 12th Assembly District, represented by Republican Heath Flora.[6]
In the United States House of Representatives, East Oakdale is in California's 10th congressional district, represented by Democrat Josh Harder.[7]
References
- "2010 Census U.S. Gazetteer Files – Places – California". United States Census Bureau.
- "US Gazetteer files: 2010, 2000, and 1990". United States Census Bureau. 2011-02-12. Retrieved 2011-04-23.
- "Census of Population and Housing". Census.gov. Retrieved June 4, 2016.
- "2010 Census Interactive Population Search: CA - East Oakdale CDP". U.S. Census Bureau. Archived from the original on July 15, 2014. Retrieved July 12, 2014.
- "U.S. Census website". United States Census Bureau. Retrieved 2008-01-31.
- "Statewide Database". Regents of the University of California. Retrieved March 27, 2015.
- "California's 10th Congressional District - Representatives & District Map". Civic Impulse, LLC. Retrieved September 28, 2014.
Municipalities and communities of Stanislaus County, California, United States | ||
|---|---|---|
| Cities | 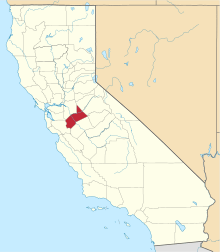 Stanislaus County map | |
| CDPs | ||
| Unincorporated communities | ||
| Ghost towns | ||