Chonburi provincial and local government
The Chonburi Provincial Government is divided into three systems of local government: provincial and local government. Pattaya as Thailand's largest tourist-oriented city, has a special local government.
Chonburi Provincial Government
Chonburi province, with a registered population as of 31 December 2018 of 1,531,407, is led by a governor and is divided into 11 districts (amphoe).[1] Each district is led by a districts chief (nai amphoe). Governor, district chiefs and district clerks are appointed by the central government. There are 92 subdistricts (tambon) each led by a subdistrict chief (kamnan), further divided into 710 villages (muban) each led by a village chief (phu yai ban). Subdistrict chiefs and village chiefs are elected by local citizens.[2][3]
| Districts map Chonburi province | # | Name | Thai |
|---|---|---|---|
 | |||
| 1 | Mueang Chonburi | เมืองชลบุรี | |
| 2 | Ban Bueng | บ้านบึง | |
| 3 | Nong Yai | หนองใหญ่ | |
| 4 | Bang Lamung | บางละมุง | |
| 5 | Phan Thong | พานทอง | |
| 6 | Phanat Nikhom | พนัสนิคม | |
| 7 | Si Racha | ศรีราชา | |
| 8 | Ko Si Chang | เกาะสีชัง | |
| 9 | Sattahip | สัตหีบ | |
| 10 | Bo Thong | บ่อทอง | |
| 11 | Ko Chan | เกาะจันทร์ |
Mueang Chonburi district
| # | Subdistrict | Population | Villages |
|---|---|---|---|
| 1 | Bang Pla Soi | 14,962 | - |
| 2 | Makham Yong | 5,940 | - |
| 3 | Ban Khot | 6,155 | - |
| 4 | Saen Suk | 38,469 | - |
| 5 | Ban Suan | 66,032 | 10 |
| 6 | Nong Ri | 15,857 | 14 |
| 7 | Na Pa | 39,716 | 12 |
| 8 | Nong Khang Khok | 7,990 | 7 |
| 9 | Don Hua Lo | 12,114 | 7 |
| # | Subdistrict | Population | Villages |
|---|---|---|---|
| 10 | Nong Mai Daeng | 12,815 | 7 |
| 11 | Bang Sai | 12,419 | 6 |
| 12 | Khlong Tamru | 8,050 | 6 |
| 13 | Mueang district | 15,364 | 5 |
| 14 | Ban Puek | 8,797 | 7 |
| 15 | Huai Kapi | 23,835 | 7 |
| 16 | Samet | 35,323 | 8 |
| 17 | Ang Sila | 5,838 | 5 |
| 18 | Samnak Bok | 5,387 | 6 |
| Total population | 335,063 | 107 |
Ban Bueng district
| # | Subdistrict | Population | Villages |
|---|---|---|---|
| 1 | Ban Bueng | 33,148 | 5 |
| 2 | Nong Irun | 16,202 | 12 |
| 3 | Khlong Kio | 15,416 | 9 |
| 4 | Nong Chak | 10,766 | 4 |
| # | Subdistrict | Population | Villages |
|---|---|---|---|
| 5 | Nong Phai Kaeo | 9,695 | 5 |
| 6 | Map Phai | 6,297 | 6 |
| 7 | Nong Sam Sak | 6,075 | 5 |
| 8 | Nong Bon Daeng | 5,778 | 6 |
| Total population | 103,377 | 52 |
Nong Yai district
| # | Subdistrict | Population | Villages |
|---|---|---|---|
| 1 | Nong Yai | 8,430 | 6 |
| 2 | Nong Suea Chang | 4,189 | 5 |
| 3 | Khlong Plu | 3,949 | 4 |
| # | Subdistrict | Population | Villages |
|---|---|---|---|
| 4 | Khao Sok | 3,602 | 4 |
| 5 | Hang Sung | 3,455 | 5 |
| Total population | 23,625 | 24 |
Bang Lamung district
| # | Subdistrict | Population | Villages |
|---|---|---|---|
| 1 | Nong Prue | 149,645 | 14 |
| 2 | Na Kluea | 49,202 | 7 |
| 3 | Huai Yai | 29,629 | 13 |
| 4 | Bang Lamung | 24,940 | 9 |
| # | Subdistrict | Population | Villages |
|---|---|---|---|
| 5 | Takhian Tia | 22,570 | 5 |
| 6 | Nong Pla Lai | 22,546 | 9 |
| 7 | Pong | 9,934 | 10 |
| 8 | Khao Mai Kaeo | 6,971 | 5 |
| Total population | 315,437 | 72 |
Phan Thong district
| # | Subdistrict | Population | Villages |
|---|---|---|---|
| 1 | Nong Tamleung | 12,418 | 9 |
| 2 | Phan Thong | 12,340 | 10 |
| 3 | Map Pong | 9,169 | 10 |
| 4 | Bang Nang | 7,121 | 9 |
| 5 | Nong Hong | 7,004 | 6 |
| 6 | Nong Kakha | 6,367 | 5 |
| # | Subdistrict | Population | Villages |
|---|---|---|---|
| 7 | Ban Kao | 5,377 | 7 |
| 8 | Khok Khi Non | 3,142 | 5 |
| 9 | Na Pradu | 2,721 | 5 |
| 10 | Ko Loi | 2,598 | 6 |
| 11 | Bang Hak | 1,172 | 4 |
| Total population | 69,429 | 76 |
Phanat Nikhom district
| # | Subdistrict | Population | Villages |
|---|---|---|---|
| 1 | Nong Hiang | 14,108 | 16 |
| 2 | Mun Nang | 13,661 | 12 |
| 3 | Phanat Nikhom | 10,473 | - |
| 4 | Na Roek | 9,574 | 15 |
| 5 | Na Wang Hin | 7,605 | 11 |
| 6 | Sra Siheliym | 7,043 | 11 |
| 7 | Kut Ngong | 6,891 | 6 |
| 8 | Ban Chang | 6,399 | 7 |
| 9 | Ban Soet | 5,801 | 8 |
| 10 | Nong Prue | 5,658 | 10 |
| # | Subdistrict | Population | Villages |
|---|---|---|---|
| 11 | Na Phra That | 5,366 | 11 |
| 12 | Hua Thanon | 5,158 | 9 |
| 13 | Thung Khwan | 4,436 | 10 |
| 14 | Nong Khayat | 4,157 | 8 |
| 15 | Rai Lak Thong | 3,603 | 11 |
| 16 | Na Matum | 3,149 | 7 |
| 17 | Tha Kham | 3,132 | 7 |
| 18 | Wat Bot | 2,946 | 11 |
| 19 | Khok Pla | 2,787 | 8 |
| 20 | Wat Luang | 2,690 | 7 |
| Total population | 124,637 | 185 |
Si Racha district
| # | Subdistrict | Population | Villages |
|---|---|---|---|
| 1 | Surasak | 67,320 | 10 |
| 2 | Nong Kham | 45,728 | 11 |
| 3 | Bueng | 43,977 | 10 |
| 4 | Thung Sukhla | 41,101 | 12 |
| # | Subdistrict | Population | Villages |
|---|---|---|---|
| 5 | Bo Win | 38,435 | 8 |
| 6 | Bang Phra | 30,877 | 12 |
| 7 | Si Racha | 24,127 | - |
| 8 | Khao Khan Song | 10,234 | 10 |
| Total population | 301,799 | 73 |
Ko Si Chang district
| # | Subdistrict | Population | Villages |
|---|---|---|---|
| 1 | Tha Thewawong | 4,560 | 7 |
Sattahip district
| # | Subdistrict | Population | Villages |
|---|---|---|---|
| 1 | Sattahip | 75,719 | 8 |
| 2 | Plu Ta Luang | 41,497 | 8 |
| 3 | Na Chom Thian | 23,835 | 9 |
| # | Subdistrict | Population | Villages |
|---|---|---|---|
| 4 | Bang Saray | 17,985 | 11 |
| 5 | Samae San | 6,456 | 4 |
| Total population | 165,492 | 40 |
Bo Thong district
| # | Subdistrict | Population | Villages |
|---|---|---|---|
| 1 | Bo Thong | 14,134 | 9 |
| 2 | Phluang Thong | 8,090 | 7 |
| 3 | That Thong | 7,628 | 9 |
| # | Subdistrict | Population | Villages |
|---|---|---|---|
| 4 | Kaset Suwan | 7,078 | 7 |
| 5 | Bo Kwang Thong | 7,054 | 8 |
| 6 | Wat Suwan | 6,334 | 7 |
| Total population | 50,318 | 47 |
Ko Chan district
| # | Subdistrict | Population | Villages |
|---|---|---|---|
| 1 | Ko Chan | 18,923 | 15 |
| 2 | Tha Bun Mi | 18,747 | 12 |
| Total population | 37,670 | 27 |
Pattaya City Special Local Government
Pattaya City Administrative Organisation is a special local government. The executive branch is led by the Mayor of Pattaya (Nayok Mueang Pattaya) and the legislative branch is led by the Council of Pattaya (Sapha Mueang Pattaya). The Mayor of Pattaya and the Councillors of Pattaya are directly elected by the citizens of Pattaya.[4] There is no subdivision of Pattaya City Administrative Organisation. But there are 42 communities, although not directly chosen, which have an advisory role.[3]
Pattaya city
| Pattaya city municipality | Population |
| Subdistrict Nong Prue | 67,413 |
| Subdistrict Na Kluea | 49,202 |
| Subdistrict Nong Pla Lai | 2,343 |
| Subdistrict Huai Yai | 164 |
| Total population | 119,122 |
| Municipality | Communities | Groups |
| Pattaya city.[5] | 42 | - |
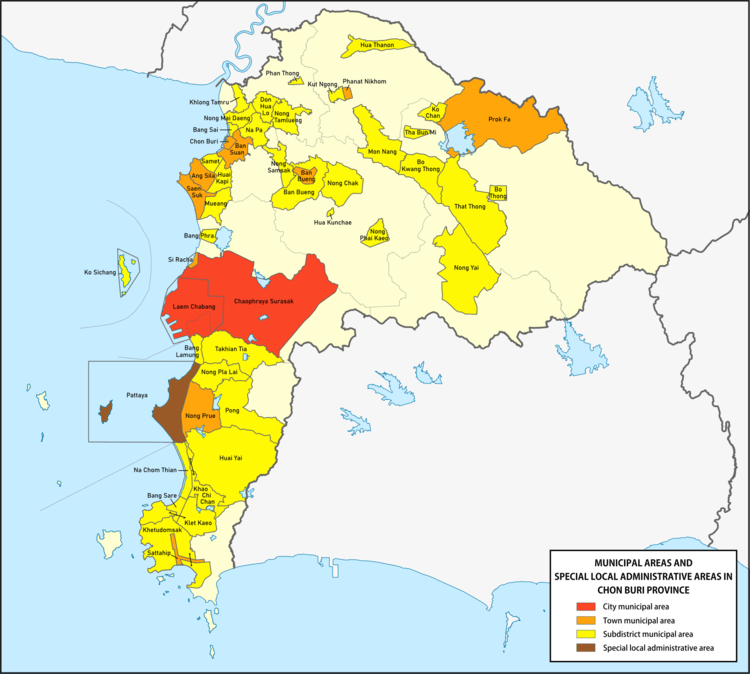
Chonburi Local Government

There is one Chonburi Provincial Administrative Organisation - CPAO (ongkan borihan suan changwat chonburi - อบจ.ชลบุรี oh bo tjo.chonburi). There are 47 municipalities, which are divided into 2 city municipalities (thesaban nakhon), 10 town municipalities (thesaban mueang) and 35 subdistrict municipalities (thesaban tambon). Further for the local communities, which are not connected to a thesaban, there are 50 subdistrict administrative organisations - SAO (ongkan borihan suan tambon). [1] All mayors, chiefs and councillors are directly elected by the local citizens.
[6][4] Municipalities have communities (chumchon), although not directly chosen by the local citizens, which provides advice and recommendations to local administrative organisations. They also promote and support community participation and enterprises at the district level and subdistrict villages.[3]
Mueang Chonburi district
| Ban Suan town municipality | Population |
| Subdistrict Ban Suan | 66,032 |
| Subdistrict Nong Ri | 1,127 |
| Subdistrict Nong Khang Khok | 1,770 |
| Total population | 68,929 |
| Saen Suk town municipality | Population |
| Subdistrict Saen Suk | 38,469 |
| Mueang district | 6,975 |
| Subdistrict Huai Kapi | 908 |
| Total population | 46,352 |
| Ang Sila town municipality | Population |
| Subdistrict Samet | 13,244 |
| Subdistrict Ban Pue | 8,797 |
| Subdistrict Huai Kapi | 7,529 |
| Subdistrict Ang Sila | 5,838 |
| Total population | 35,408 |
| Mueang district town municipality | Population |
| Subdistrict Ban Pla Soi | 14,962 |
| Subdistrict Ban Khot | 6,155 |
| Subdistrict Makham Yong | 5,940 |
| Total population | 27,057 |
| Subdistrict municipalities | Population |
| Na Pa subdistrict municipality | 39,716 |
| Samet subdistrict municipality | 22,079 |
| Huai Kapi subdistrict municipality | 15,398 |
| Nong Mai Daeng subdistrict mun. | 12,815 |
| Subdistrict municipalities | Population |
| Bang Sai subdistrict municipality | 12,419 |
| Don Hua Lo subdistrict mun. | 12,114 |
| Mueang subdistrict municipality | 8,389 |
| Khlong Tamru subdistrict mun. | 4,254 |
| Subdistrict Adm.Org. - SAO | Population |
| Nong Ri SAO | 14,730 |
| Nong Khang Khok SAO | 6,220 |
| Samnak Bok SAO | 5,387 |
| Khlong Tamru SAO | 3,796 |
| Municipality | Communities | Groups |
| Saen Suk.[7] | 15 | - |
| Ang Sila.[8] | 20 | 4 |
| Mueang district.[9] | 18 | 4 |
| Na Pa.[10] | 16 | - |
| Bang Sai.[11] | 16 | - |
| Don Hua Lo.[12] | 8 | - |
Ban Bueng district
| Ban Bueng town municipality | 21,133 |
| Municipality | Communities | Groups |
| Ban Bueng.[13] | 59 | - |
| Subdistrict municipalities | Population |
| Ban Bueng | 12,015 |
| Nong Chak | 10,766 |
| Nong Sam Sak | 6,075 |
| Hua Kunchae | 2,660 |
| Nong Phai Kaeo | 2,371 |
| Subdistrict Adm. Org. - SAO | Population |
| Nong Irun SAO | 16,202 |
| Khlong Kio SAO | 12,756 |
| Nong Phai Kaeo SAO | 7,324 |
| Map Phai SAO | 6,297 |
| Nong Bon Daeng SAO | 5,778 |
Nong Yai district
| Nong Yai subdistrict municipality | 8,430 |
| Subdistrict Adm. Org. - SAO | Population |
| Nong Suea Chang SAO | 4,189 |
| Subdistrict Adm. Org. - SAO | Population |
| Khlong Plu SAO | 3,949 |
| Khao Sok SAO | 3,602 |
| Hang Sung SAO | 3,455 |
Bang Lamung district
| Laem Chabang city municipality | 13,830 |
| Not in Bang Lamung district | 73,003 |
| Nong Prue town municipality | 82,232 |
| Subdistrict municipalities | Population |
| Huai Yai subdistrict municipality | 29,465 |
| Nong Pla Lai subdistrict mun. | 19,467 |
| Takhian Tia subdistrict mun. | 22,461 |
| Bang Lamung subdistrict mun. | 11,955 |
| Pong subdistrict municipality | 9,934 |
| Subdistrict Adm. Org. - SAO | Population |
| Khao Mai Kaeo SAO | 6,971 |
| Municipality | Communities |
| Laem Chabang.[14] | 23 |
Phan Thong district
| Nong Tamleung subdistrict mun. | Population |
| Subdistrict Nong Tamleung | 12,418 |
| Subdistrict Nong Kakha | 4,264 |
| Subdistrict Map Thong | 2,756 |
| Total population | 19,438 |
| Phan Thong subdistrict mun. | 6,080 |
| Municipality | Communities |
| Nong Tamlueng.[15] | 11 |
| Subdistrict Adm. Org. - SAO | Population |
| Phan Thong + Nong Kakha SAO | 8,363 |
| Bang Nang SAO | 7,121 |
| Nong Hong SAO | 7,004 |
| Map Pong SAO | 6,413 |
| Subdistrict Adm. Org. - SAO | Population |
| Ban Kao SAO | 5,377 |
| Ko Loi + Bang Hak SAO | 3,770 |
| Khok Khi Non SAO | 3,142 |
| Na Pradu SAO | 2,721 |
Phanat Nikhom district
| Phanat Nikhom town mun.[16] | 10,473 |
| Municipality | Communities |
| Phanat Nikhom.[17] | 12 |
| Mun Nang.[18] | 16 |
| Mun Nang subdistrict municipality | 13,661 |
| Kut Ngong subdistrict municipality | 6,891 |
| Hua Thanon subdistrict municipality | 5,158 |
| Subdistrict Adm. Org. - SAO | Population |
| Nong Hiang SAO | 14,108 |
| Na Roek SAO | 9,574 |
| Na Wang Hin SAO | 7,605 |
| Sra Siheliym | 7,043 |
| Ban Chang SAO | 6,399 |
| Ban Soet SAO | 5,801 |
| Nong Prue SAO | 5,658 |
| Na Phra That SAO | 5,366 |
| Subdistrict Adm. Org. - SAO | Population |
| Thung Khwang SAO | 4,436 |
| Nong Khayat SAO | 4,157 |
| Rai Lak Thong SAO | 3,603 |
| Na Matum SAO | 3,149 |
| Tha Kham SAO | 3,132 |
| Wat Bot SAO | 2,946 |
| Khok Pla SAO | 2,787 |
| Wat Luang SAO | 2,690 |
Si Racha district
| Chao Phraya Surasak city mun. | Population |
| Subdistrict Surasak | 62,559 |
| Subdistrict Nong Kham | 28,740 |
| Subdistrict Bueng | 28,554 |
| Subdistrict Bo Win | 14,825 |
| Subdistrict Khao Khan Song | 3,519 |
| Total population | 138,197 |
| Laem Chabang city municipality | Population |
| Subdistrict Thung Sukhla | 41,101 |
| Subdistrict Bueng | 15,423 |
| Subdistrict Nong Kham | 11,718 |
| Subdistrict Surasak | 4,761 |
| Total population | 73,003 |
| Not in Si Racha district | 13,830 |
| Si Racha town municipality | 24,127 |
| Bang Phra subdistrict municipality | 13,283 |
| Subdistrict Adm. Org. - SAO | Population |
| Bo Win SAO | 23,610 |
| Bang Phra SAO | 17,594 |
| Khao Khan Song SAO | 6,715 |
| Nong Kham SAO | 5,270 |
| Municipality | Communities | Groups |
| Laem Chabang[14] | 23 | - |
Ko Si Chang district
| Ko Si Chang subdistrict municipality | 4,560 |
| Municipality | Communities | Groups |
| Ko Si Chang.[19] | 7 | - |
Sattahip district
| Sattahip town municipality | Population |
| Subdistrict Sattahip | 19,331 |
| Subdistrict Plu Ta Luang | 3,641 |
| Total population | 22,972 |
| Khet Udom Sak subdistrict mun. | Population |
| Subdistrict Sattahip | 56,388 |
| Subdistrict municipalities | Population |
| Na Chom Thian subdistrict mun. | 17,207 |
| Bang Saray subdistrict mun. | 11,357 |
| Kao Chi Chan subdistrict mun.[20] | Population |
| Subdistrict Na Chom Thian | 6,628 |
| Klet Kaeo subdistrict mun.[20] | Population |
| Subdistrict Bang Saray | 6,628 |
| Subdistrict Adm. Org. - SAO | Population |
| Plu Ta Luang SAO | 37,856 |
| Samae San SAO | 6,456 |
Bo Thong district
| Subdistrict municipalities | Population |
| That Thong subdistrict mun. | 7,628 |
| Bo Kwang Thong subdistrict mun. | 7,054 |
| Bo Thong subdistrict mun. | 4,340 |
| Subdistrict Adm. Org. - SAO | Population |
| Bo Thong SAO | 9,978 |
| Phluang Thong SAO | 8,090 |
| Kaset Suwan SAO | 7,078 |
| Wat Suwan SAO | 6,150 |
Ko Chan district
| Prok Fa town municipality | 14,160 |
| Tha Bun Mi Subdistrict Adm. Org. | 11,958 |
| Subdistrict municipalities | Population |
| Tha Bun Mi subdistrict mun. | 6,789 |
| Ko Chan subdistrict mun. | 4,763 |
Notes
The majority of the information for this wiki-article is based on "Statistics, population and house statistics for the year 2018" from Registration Office Department of the Interior. Reference date is 31 December 2018.[3]
References
- "Basic information". Local Chonburi Province. Archived from the original on 1 August 2019. Retrieved 27 June 2019, at the Wayback Machine.
- "พระราชบัญญัติสภาตำบลและองค์การบริหารส่วนตำบล พ.ศ.๒๕๓๗" [District and Subdistrict Administration Organization Act B.E.2537] (PDF). Royal Thai Government Gazette. 111 (53 Koh): 11–35. 2 December 1994. Retrieved 11 November 2019, and later by the constitution of 1997
- "ร่ยงานสถิติจำนวนประชากรและบ้านประจำปี พ.ศ.2561" [Statistics, population and house statistics for the year 2018]. Registration Office Department of the Interior, Ministry of the Interior (in Thai). 31 December 2018. Retrieved 20 June 2019.
- "Local Personnel Administration, chapter 1/PAO, 2/Municipalities, 3/TAO, 5/City of Pattaya" (PDF). Department of Local Administration. 1999. Archived from the original (PDF) on 1 August 2019. Retrieved 22 July 2019, at the Wayback Machine.
- Community in Pattaya
- "local government organization information separated by provinces". Department of Local Administration. 1 December 2017. Archived from the original on 1 August 2019. Retrieved 20 June 2019, at the Wayback Machine..
- "Saensuk city - Social aspects". www.saensukcity.go.th.
- Ang Sila Municipality - Community
- Chonburi Municipality - Community
- Na Pa Municipality - Community
- "Bang Sai Municipality - Community". www.bangsaichonburi.go.th. Retrieved 25 July 2019.
- Don Hua Lo Municipality - Community
- Ban Bueng Municipality - Community
- Laem Chabang Municipality - Community
- Nong Tamlueng Municipality - Community
- "พระราชกฤษฎีกา จัดตั้งเทศบาลเมืองพนัศนิคม จังหวัดชลบุรี พุทธศักราช ๒๔๘0" [Royal Decree Establishing of Phanat Nikhom town municipality, Chonburi province, B.E.2480 (1937)] (PDF). Royal Thai Government Gazette. 54: 1843–1847. 14 March 1937. Retrieved 16 April 2020, effectively on 15 March 1937
- "Phanat Nikhom Municipality - Community". www.phanatnikhomcity.go.th. Retrieved 26 July 2019.
- Mun Nang Municipality - Community
- "Ko Si Chang Municipality - Community". www.kohsichang.go.th. Retrieved 26 July 2019.
- Total population of 13,256 for two municipalities, for each temporary divided into half