Burning Ship fractal
The Burning Ship fractal, first described and created by Michael Michelitsch and Otto E. Rössler in 1992, is generated by iterating the function:


in the complex plane which will either escape or remain bounded. The difference between this calculation and that for the Mandelbrot set is that the real and imaginary components are set to their respective absolute values before squaring at each iteration. The mapping is non-analytic because its real and imaginary parts do not obey the Cauchy–Riemann equations.[1]

 High-quality deep-zoom image of a small ship in the armada in the left Western antenna of the main ship structure
 Burning Ship deep zoom to 2.3·10−50
 The Burning Ship fractal
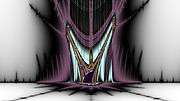
 A zoom-in to the lower left of the Burning Ship fractal, showing a "burning ship" and self-similarity to the complete fractal
 A zoom-in to line on the left of the fractal, showing nested repetition (a different colour scheme is used here)
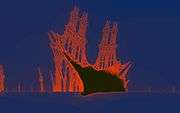 High-quality image of the Burning Ship fractal
 The Burning Ship fractal featured in the 1K intro "JenterErForetrukket" by Youth Uprising; a demoscene production
 Ghost Ship - The Burning Ship fractal rendered using the Nebulabrot technique
 A corresponding Julia set of Burning Ship fractal
 A corresponding Julia set of Burning Ship fractal
Implementation

The below pseudocode implementation hardcodes the complex operations for Z. Consider implementing complex number operations to allow for more dynamic and reusable code. Note that the typical images of the Burning Ship fractal display the ship upright: the actual fractal, and that produced by the below pseudocode, is inverted along the x-axis.
for each pixel (x, y) on the screen, do:
    x := scaled x coordinate of pixel (scaled to lie in the Mandelbrot X scale (-2.5, 1))
    y := scaled y coordinate of pixel (scaled to lie in the Mandelbrot Y scale (-1, 1))

    zx := x // zx represents the real part of z
    zy := y // zy represents the imaginary part of z

    iteration := 0
    max_iteration := 1000

    while (zx*zx + zy*zy < 4 and iteration < max_iteration) do
        xtemp := zx*zx - zy*zy + x
        zy := abs(2*zx*zy + y) // abs returns the absolute value
        zx := abs(xtemp)
        iteration := iteration + 1

    if iteration = max_iteration then // Belongs to the set
        return insideColor

    return iteration × color
References
- Michael Michelitsch and Otto E. Rössler (1992). "The "Burning Ship" and Its Quasi-Julia Sets". In: Computers & Graphics Vol. 16, No. 4, pp. 435–438, 1992. Reprinted in Clifford A. Pickover Ed. (1998). Chaos and Fractals: A Computer Graphical Journey — A 10 Year Compilation of Advanced Research. Amsterdam, Netherlands: Elsevier. ISBN 0-444-50002-2
External links
| Wikimedia Commons has media related to Burning Ship fractal. |
- About properties and symmetries of the Burning Ship fractal, featured by Theory.org
- Burning Ship Fractal, Description and C source code.
- Burning Ship with its Mset of higher powers and Julia Sets
- Burningship, Video,
- Fractal webpage includes the first representations and the original paper cited above on the Burning Ship fractal.
- 3D representations of the Burning Ship fractal
- FractalTS Mandelbrot, Burning ship and corresponding Julia set generator.
| Open-source | 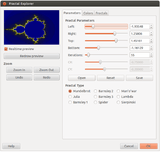 | ||||
|---|---|---|---|---|---|
| GNU | |||||
| Freeware | |||||
| Retail |
| ||||
| Scenery generator | |||||
| Found objects |
| ||||
| Related | |||||
| |||||
| Characteristics |  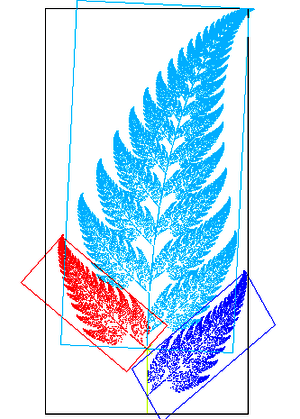  | |
|---|---|---|
| Iterated function system | ||
| Strange attractor | ||
| L-system | ||
| Escape-time fractals | ||
| Rendering techniques | ||
| Random fractals | ||
| People | ||
| Other | ||
.jpg)