Burin-Placentia West
Burin-Placentia West was a provincial electoral district for the House of Assembly of Newfoundland and Labrador, Canada. The district was known as Placentia West prior to 1975. As of 2011 there were 7,673 eligible voters living within the district.[1]
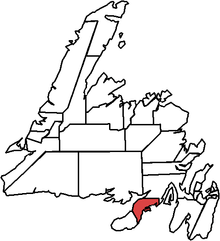 Burin-Placentia West in relation to other districts in Newfoundland | |
| Defunct provincial electoral district | |
| Legislature | Newfoundland and Labrador House of Assembly |
| District created | 1949 |
| First contested | 1949 |
| Last contested | 2011 |
| Demographics | |
| Population (2006) | 11,444 |
| Electors (2011) | 7,673 |
Primarily a fishing district with the Marystown Shipyard and offshore fabrication yard an important part of the economy. Like many other districts, it has faced some tough economic times. Production has dropped at OCI's Marystown fish plant and work at the shipyard has been erratic.
The main communities are Marystown, Burin and Rushoon.
Other communities include Baine Harbour, Beau Bois, Boat Harbour, Brookside, Fox Cove-Mortier, Garnish Pond, Jean de Baie, Parker's Cove, Petite Fort, Port au Bras, Red Harbour, Red Island, Rock Harbour, South East Bight, and Spanish Room.
The district was abolished in 2015 into Placentia West-Bellevue and Burin-Grand Bank.
Members of the House of Assembly
The district has elected the following Members of the House of Assembly:
| Member | Party | Term | |
|---|---|---|---|
| Clyde Jackman | Progressive Conservative | 2003–2015 | |
| Mary Hodder | Liberal | 1996–2003 | |
| Glenn Tobin | Progressive Conservative | 1982–1996 | |
| Don Hollett | Liberal | 1979–1982 | |
| Patrick Canning | Liberal | 1975–1979 | |
| Leo Barry | Progressive Conservative | 1972–1975 | |
| Patrick Canning | Liberal | 1949–1972 | |
Election results
| 2011 Newfoundland and Labrador general election | ||||||||
|---|---|---|---|---|---|---|---|---|
| Party | Candidate | Votes | % | |||||
| Progressive Conservative | Clyde Jackman | 2,538 | 48.45 | |||||
| New Democratic | Julie Mitchell | 2,498 | 47.69 | |||||
| Liberal | Jacqueline Mullett | 202 | 3.86 | |||||
| Total valid votes | 5,238 | 99.77 | ||||||
| Total rejected ballots | 12 | 0.23 | ||||||
| Turnout | 5,250 | 69.00 | ||||||
| Electors on the lists | 7,591 | – | ||||||
| 2007 Newfoundland and Labrador general election | ||||||||
|---|---|---|---|---|---|---|---|---|
| Party | Candidate | Votes | % | |||||
| Progressive Conservative | Clyde Jackman | 3,141 | 59.24 | |||||
| New Democratic | Julie Mitchell | 1,704 | 32.14 | |||||
| Liberal | George Brake | 457 | 8.62 | |||||
| Total valid votes | 5,302 | 99.73 | ||||||
| Total rejected ballots | 14 | 0.27 | ||||||
| Turnout | 5,316 | 69.36 | ||||||
| Electors on the lists | 7,664 | – | ||||||
| Party | Candidate | Votes | % | ± | |
|---|---|---|---|---|---|
| Progressive Conservative | Clyde Jackman | 3450 | 55.05% | +49.18% | |
| Liberal | Sam Synard | 2133 | 34.03% | -19.27% | |
| NDP | Wayne Butler | 684 | 10.91% | -35.79% | |
| Party | Candidate | Votes | % | ± | |
|---|---|---|---|---|---|
| Liberal | Mary Hodder | 3469 | 53.30% | -18.99% | |
| NDP | Wayne Butler | 2658 | 40.83% | +40.83% | |
| Progressive Conservative | Dominic Lundrigan | 382 | 5.87% | -21.84% | |
| Party | Candidate | Votes | % | ± | |
|---|---|---|---|---|---|
| Liberal | Mary Hodder | 4944 | 72.29% | ||
| Progressive Conservative | Terry Keating | 1895 | 27.71% | – | |
References
- "Summary of Polling Divisions BURIN - PLACENTIA WEST" (PDF). Elections Newfoundland and Labrador. 3 August 2011. Retrieved 5 September 2011.
- CBC news NL votes 2007 district profiles
- Encyclopedia of Newfoundland and Labrador