Bennington County, Vermont
Bennington County is a county in the U.S. state of Vermont. As of the 2010 census, the population was 37,125.[1] The shire towns (county seats) are jointly Bennington ("The Southshire") and Manchester ("The Northshire"),[2] and the largest municipality is Bennington. The county was created in 1778.[3]
Bennington County | |
|---|---|
 Bennington County courthouse in Manchester | |
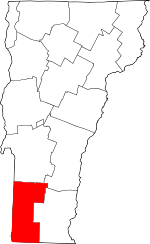 Location within the U.S. state of Vermont | |
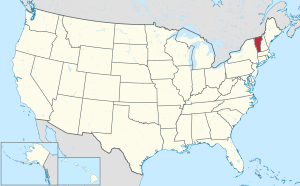 Vermont's location within the U.S. | |
| Coordinates: 43°01′46″N 73°06′29″W | |
| Country | |
| State | |
| Founded | 1778 |
| Shire Town | Bennington & Manchester |
| Largest town | Bennington |
| Area | |
| • Total | 678 sq mi (1,760 km2) |
| • Land | 675 sq mi (1,750 km2) |
| • Water | 2.7 sq mi (7 km2) 0.4%% |
| Population (2010) | |
| • Total | 37,125 |
| • Estimate (2019) | 35,470 |
| • Density | 55/sq mi (21/km2) |
| Time zone | UTC−5 (Eastern) |
| • Summer (DST) | UTC−4 (EDT) |
| Congressional district | At-large |
| Website | www |
History
Bennington is the oldest county in Vermont still in existence, created by the first general assembly on March 17, 1778.[4] Vermont was organized into two original counties, with Bennington in the west and Unity (a few days later renamed Cumberland) in the east.[5] On February 16, 1781 Rutland County was created from Bennington County.[6] On April 13, 1781 Bennington gained the gore east of the town of Bromley (now Peru) from Windham and Windsor Counties.[7]
From 26 June 1781 until 23 February 1782, Vermont attempted to annex part of New York east of the Hudson River (the so-called West Union); inhabitants in the area favored Vermont's township form of government, while Vermont hoped to gain bargaining power through expansion.[8] New York did not lose control of the area. For almost seven months Bennington County overlapped part of Albany County, New York.[9]
On February 27, 1787 Windham County gained the town of Stratton from Bennington County,[10] On 25 October 1805 Rutland County gained from the county when the town of Mount Tabor gained from the town of Peru.[11] The county gained from Rutland County when the town of Dorset gained a small area from the town of Mount Tabor on November 17, 1825.[12]
Geography
According to the U.S. Census Bureau, the county has a total area of 678 square miles (1,760 km2), of which 675 square miles (1,750 km2) is land and 2.7 square miles (7.0 km2) (0.4%) is water.[13]
Adjacent counties
- Rutland County – north
- Windsor County – northeast
- Windham County – east
- Franklin County, Massachusetts – southeast
- Berkshire County, Massachusetts – south
- Rensselaer County, New York – southwest
- Washington County, New York – northwest
National protected areas
Demographics
| Historical population | |||
|---|---|---|---|
| Census | Pop. | %± | |
| 1790 | 12,206 | — | |
| 1800 | 14,617 | 19.8% | |
| 1810 | 15,893 | 8.7% | |
| 1820 | 16,125 | 1.5% | |
| 1830 | 17,468 | 8.3% | |
| 1840 | 16,872 | −3.4% | |
| 1850 | 18,589 | 10.2% | |
| 1860 | 19,436 | 4.6% | |
| 1870 | 21,325 | 9.7% | |
| 1880 | 21,950 | 2.9% | |
| 1890 | 20,448 | −6.8% | |
| 1900 | 21,705 | 6.1% | |
| 1910 | 21,378 | −1.5% | |
| 1920 | 21,577 | 0.9% | |
| 1930 | 21,655 | 0.4% | |
| 1940 | 22,286 | 2.9% | |
| 1950 | 24,115 | 8.2% | |
| 1960 | 25,088 | 4.0% | |
| 1970 | 29,282 | 16.7% | |
| 1980 | 33,345 | 13.9% | |
| 1990 | 35,845 | 7.5% | |
| 2000 | 36,994 | 3.2% | |
| 2010 | 37,125 | 0.4% | |
| Est. 2019 | 35,470 | [14] | −4.5% |
| U.S. Decennial Census[15] 1790–1960[16] 1900–1990[17] 1990–2000[18] 2010–2018[1] | |||
2000 census
As of the census[19] of 2000, there were 36,994 people, 14,846 households, and 9,917 families living in the county. The population density was 55 people per square mile (21/km²). There were 19,403 housing units at an average density of 29 per square mile (11/km²). The racial makeup of the county was 97.75% White, 0.42% Black or African American, 0.20% Native American, 0.62% Asian, 0.01% Pacific Islander, 0.21% from other races, and 0.80% from two or more races. 0.93% of the population were Hispanic or Latino of any race. 16.5% were of Irish, 16.0% English, 10.5% French, 9.1% German, 9.0% American, 8.1% Italian and 6.3% French Canadian ancestry. 96.4% spoke English, 1.2% Spanish and 1.2% French as their first language.
There were 14,846 households out of which 30.50% had children under the age of 18 living with them, 53.10% were married couples living together, 10.10% had a female householder with no husband present, and 33.20% were non-families. 26.80% of all households were made up of individuals and 11.60% had someone living alone who was 65 years of age or older. The average household size was 2.41 and the average family size was 2.91.
In the county, the population was spread out with 23.70% under the age of 18, 7.70% from 18 to 24, 26.30% from 25 to 44, 25.70% from 45 to 64, and 16.70% who were 65 years of age or older. The median age was 40 years. For every 100 females there were 92.20 males. For every 100 females age 18 and over, there were 87.90 males.
The median income for a household in the county was $39,926, and the median income for a family was $46,565. Males had a median income of $31,982 versus $23,632 for females. The per capita income for the county was $21,193. About 7.00% of families and 10.00% of the population were below the poverty line, including 13.40% of those under age 18 and 7.90% of those age 65 or over.
2010 census
As of the 2010 United States Census, there were 37,125 people, 15,470 households, and 9,767 families living in the county.[20] The population density was 55.0 inhabitants per square mile (21.2/km2). There were 20,922 housing units at an average density of 31.0 per square mile (12.0/km2).[21] The racial makeup of the county was 96.6% white, 0.8% black, 0.7% Asian, 0.3% American Indian, 0.3% from other races, and 1.3% from two or more races. Those of Hispanic or Latino origin made up 1.4% of the population.[20] The largest ancestry groups were:


.svg.png)
.svg.png)


.svg.png)
Of the 15,470 households, 27.4% had children under the age of 18 living with them, 48.1% were married couples living together, 10.6% had a female householder with no husband present, 36.9% were non-families, and 29.9% of all households were made up of individuals. The average household size was 2.30 and the average family size was 2.83. The median age was 45.1 years.[20]
The median income for a household in the county was $47,396 and the median income for a family was $60,642. Males had a median income of $40,996 versus $32,068 for females. The per capita income for the county was $27,962. About 8.6% of families and 10.9% of the population were below the poverty line, including 18.1% of those under age 18 and 5.9% of those age 65 or over.[23]
Politics
In 1828, Bennington County voted for National Republican Party candidate John Quincy Adams and for Henry Clay in 1832.
From William Henry Harrison in 1836 to Winfield Scott in 1852, the county would vote for the Whig Party's candidates.
From John C. Frémont in 1856 to Richard Nixon in 1960, the Republican Party would have a 104 year winning streak in the county.
In 1964, the county was won by Democratic Party incumbent President Lyndon B. Johnson, who became the first not only the first Democratic presidential candidate to win the county, but to win the state of Vermont entirely.
Following the Democrats' victory in 1964, the county went back to voting for Republican candidates for another 20 year winning streak starting with Richard Nixon in 1968 and ending with George H. W. Bush in 1988, who became the last Republican presidential candidate to win the county.
In 1992 the county was won by Bill Clinton and has been won by Democratic candidates ever since.
| Year | Republican | Democratic | Third parties |
|---|---|---|---|
| 2016 | 34.1% 5,925 | 54.9% 9,539 | 11.0% 1,917 |
| 2012 | 32.3% 5,687 | 65.5% 11,514 | 2.2% 392 |
| 2008 | 32.1% 6,133 | 65.5% 12,524 | 2.5% 472 |
| 2004 | 40.0% 7,616 | 58.1% 11,069 | 2.0% 380 |
| 2000 | 41.2% 7,284 | 51.0% 9,021 | 7.8% 1,372 |
| 1996 | 32.4% 5,229 | 50.4% 8,139 | 17.2% 2,784 |
| 1992 | 32.4% 5,895 | 44.9% 8,178 | 22.7% 4,143 |
| 1988 | 53.3% 8,387 | 45.6% 7,174 | 1.0% 164 |
| 1984 | 59.1% 9,035 | 39.5% 6,039 | 1.4% 210 |
| 1980 | 44.4% 6,091 | 39.1% 5,361 | 16.5% 2,269 |
| 1976 | 54.2% 6,712 | 43.9% 5,443 | 1.9% 232 |
| 1972 | 60.6% 7,542 | 38.6% 4,804 | 0.9% 107 |
| 1968 | 52.3% 5,967 | 43.5% 4,966 | 4.2% 483 |
| 1964 | 34.6% 3,895 | 65.4% 7,359 | |
| 1960 | 61.2% 7,099 | 38.8% 4,502 | 0.0% 1 |
| 1956 | 75.6% 8,434 | 24.4% 2,719 | 0.0% 4 |
| 1952 | 73.3% 8,385 | 26.4% 3,018 | 0.3% 34 |
| 1948 | 62.3% 5,840 | 35.6% 3,340 | 2.1% 194 |
| 1944 | 58.6% 5,252 | 41.4% 3,709 | |
| 1940 | 57.4% 5,845 | 42.3% 4,308 | 0.3% 27 |
| 1936 | 56.1% 5,515 | 42.4% 4,166 | 1.6% 153 |
| 1932 | 55.8% 5,250 | 42.1% 3,964 | 2.2% 202 |
| 1928 | 63.5% 6,114 | 36.3% 3,498 | 0.2% 18 |
| 1924 | 72.9% 5,341 | 20.0% 1,466 | 7.1% 518 |
| 1920 | 71.4% 4,172 | 27.7% 1,615 | 0.9% 54 |
| 1916 | 60.4% 2,602 | 36.9% 1,590 | 2.7% 116 |
| 1912 | 36.1% 1,464 | 26.1% 1,057 | 37.8% 1,534[25] |
| 1908 | 73.7% 2,453 | 22.5% 748 | 3.9% 129 |
| 1904 | 74.3% 2,419 | 22.9% 745 | 2.8% 92 |
| 1900 | 74.6% 2,666 | 24.4% 871 | 1.1% 38 |
| 1896 | 80.4% 3,086 | 17.1% 656 | 2.5% 97 |
| 1892 | 64.2% 2,196 | 33.8% 1,155 | 2.0% 69 |
| 1888 | 60.7% 2,497 | 27.4% 1,128 | 11.8% 487 |
| 1884 | 62.6% 2,335 | 36.6% 1,366 | 0.8% 30 |
| 1880 | 64.7% 2,641 | 35.3% 1,440 | 0.0% 0 |
Education
Bennington is home to Bennington College and Southern Vermont College. The Community College of Vermont and Vermont Technical College also have campuses in downtown Bennington.
Bennington County is home to these high schools:
- Mount Anthony Union High School in Bennington
- Burr & Burton Academy in Manchester
- Arlington Memorial School in Arlington
- Long Trail School in Dorset
Law enforcement
Bennington County is home to these local law enforcement agencies:
- Bennington Police Department
- Manchester Police Department
- Winhall Police Department
The Bennington County Sheriff's Department and Vermont State Police are two other sources of law enforcement for the county, especially in towns without their own local police departments.
Transportation
Major highways
Bus
The main public transportation provider in Bennington County is the Green Mountain Community Network, whose Green Mountain Express bus system has five local bus routes in and around the town of Bennington and three commuter routes to Manchester; Wilmington; Williamstown, Massachusetts; and points in between as of September 29, 2014. Readsboro is served out of Wilmington by Southeast Vermont Transit's (formerly the Deerfield Valley Transit Association) fare free MOOver bus. There are also commuter buses to Rutland from Manchester and a regional bus line to Albany, New York from Bennington via Marble Valley Regional Transit District and Yankee Trails World Travel, respectively. Premier Coach's Vermont Translines (a partner of Greyhound) also stops in Bennington and Manchester on its intercity bus route between Albany and Burlington. The Shires Connector, an Amtrak Thruway intercity bus route also operated by Vermont Translines, also links Manchester and Bennington with Albany, NY's train station in Rensselaer, New York, their Greyhound bus station and airport.[26]
Air
William H. Morse State Airport is a small public-use and state-owned airport west of downtown Bennington, serving private aviation interests. Commercial airlines are available at Albany International Airport to the west in the state of New York, and to the north at Rutland Southern Vermont Regional Airport in Rutland County.
Communities

Towns
- Arlington
- Bennington (shire town)
- Dorset
- Glastenbury
- Landgrove
- Manchester (shire town)
- Peru
- Pownal
- Readsboro
- Rupert
- Sandgate
- Searsburg
- Shaftsbury
- Stamford
- Sunderland
- Winhall
- Woodford
Villages
Villages are census divisions, but have no separate corporate existence from the towns they are in.
Census-designated places
- Arlington
- Bennington
- Dorset
- Manchester Center
- Readsboro
- South Shaftsbury
See also
References
- "State & County QuickFacts". United States Census Bureau. Archived from the original on June 6, 2011. Retrieved December 30, 2013.
- "Find a County". National Association of Counties. Archived from the original on May 31, 2011. Retrieved June 7, 2011.
- "Vermont: Individual County Chronologies". Vermont Atlas of Historical County Boundaries. The Newberry Library. 2008. Retrieved June 30, 2015.
- Vermont History Timeline Archived September 11, 2011, at the Wayback Machine
- Vt. State Papers, 12:43–44.
- Vermont State Papers, 13:5–6.
- Vt. State Papers, 13:19.
- Vt. State Papers, 13:45–46; Newton, 83–87; Williamson, C., 101–102.
- Vt. State Papers, 3, pt. 2: 67–68.
- Vt. State Papers, 14:173–175.
- McCarty, "Evolution," 134; Vt. Laws 1805, ch. 15/pp. 19–20.
- McCarty, "Evolution," 140; Vt. Laws 1825, no 18/p. 25; Vt. Laws 1832, no. 25/p. 25.
- "2010 Census Gazetteer Files". United States Census Bureau. August 22, 2012. Retrieved June 28, 2015.
- "Population and Housing Unit Estimates". Retrieved May 31, 2019.
- "U.S. Decennial Census". United States Census Bureau. Retrieved June 28, 2015.
- "Historical Census Browser". University of Virginia Library. Retrieved June 28, 2015.
- Forstall, Richard L., ed. (March 27, 1995). "Population of Counties by Decennial Census: 1900 to 1990". United States Census Bureau. Retrieved June 28, 2015.
- "Census 2000 PHC-T-4. Ranking Tables for Counties: 1990 and 2000" (PDF). United States Census Bureau. April 2, 2001. Retrieved June 28, 2015.
- "U.S. Census website". United States Census Bureau. Retrieved May 14, 2011.
- "DP-1 Profile of General Population and Housing Characteristics: 2010 Demographic Profile Data". United States Census Bureau. Archived from the original on February 13, 2020. Retrieved January 20, 2016.
- "Population, Housing Units, Area, and Density: 2010 - County". United States Census Bureau. Archived from the original on February 13, 2020. Retrieved January 20, 2016.
- "DP02 SELECTED SOCIAL CHARACTERISTICS IN THE UNITED STATES – 2006-2010 American Community Survey 5-Year Estimates". United States Census Bureau. Archived from the original on February 13, 2020. Retrieved January 20, 2016.
- "DP03 SELECTED ECONOMIC CHARACTERISTICS – 2006-2010 American Community Survey 5-Year Estimates". United States Census Bureau. Archived from the original on February 13, 2020. Retrieved January 20, 2016.
- Leip, David. "Dave Leip's Atlas of U.S. Presidential Elections". uselectionatlas.org. Retrieved 2018-06-08.
- The leading "other" candidate, Progressive Theodore Roosevelt, received 1,380 votes, while Socialist candidate Eugene Debs received 105 votes, Prohibition candidate Eugene Chafin received 49 votes.
- Vermont Shires Connector, Vermont Translines. Retrieved 2019-12-10.
External links
- Bennington County Sheriff's Department
- National Register of Historic Places listing for Bennington Co., Vermont
Places adjacent to Bennington County, Vermont | |
|---|---|
Municipalities and communities of Bennington County, Vermont, United States | ||
|---|---|---|
| Towns | Map of Vermont highlighting Bennington County | |
| Villages | ||
| CDPs |
| |
| Other communities | ||
| Footnotes | ‡ Disincorporated | |
Montpelier (capital) | ||
| Regions | ||
| Counties | ||
| Cities | ||
| Towns (pop. >5000) | ||
| Festivals | ||
| Topics |
| |
| Society |
| |

| Authority control |
|
|---|