Acid–base titration
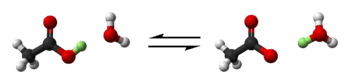
An acid–base titration is a method of quantitative analysis for determining the concentration of an acid or base by exactly neutralizing it with a standard solution of base or acid having known concentration. A pH indicator is used to monitor the progress of the acid–base reaction. If the acid dissociation constant (pKa) of the acid or base dissociation constant (PKb) of base in the analyte solution is known, its solution concentration (molarity) can be determined. Alternately, the pKa can be determined if the analyte solution has a known solution concentration by constructing a titration curve.
| Acids and bases |
|---|
 |
| Acid types |
|
| Base types |
Alkalimetry and acidimetry
Alkalimetry and acidimetry are a kind of volumetric analysis in which the fundamental reaction is a neutralization reaction. Alkalimetry is the specialized analytic use of acid-base titration to determine the concentration of a basic (synonymous to alkaline) substance. Acidimetry, sometimes spelled acidometry, is the same concept of specialized analytic acid-base titration, but for an acidic substance.[1]
Indicator choice
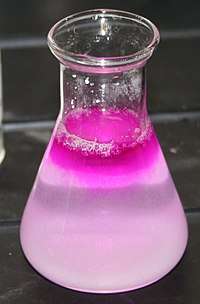
A suitable pH indicator must be chosen in order to detect the end point of the titration. The color change or other effect should occur close to the equivalence point of the reaction so that the experimenter can accurately determine when that point is reached. The pH of the equivalence point can be estimated using the following rules:
- A strong acid will react with a strong base to form a neutral (pH = 7) solution.
- A strong acid will react with a weak base to form an acidic (pH < 7) solution.
- A weak acid will react with a strong base to form a basic (pH > 7) solution.
When a weak acid reacts with a weak base, the equivalence point solution will be basic if the base is stronger and acidic if the acid is stronger. If both are of equal strength, then the equivalence pH will be neutral. However, weak acids are not often titrated against weak bases because the colour change shown with the indicator is often quick, and therefore very difficult for the observer to see the change of colour.
The point at which the indicator changes colour is called the end point. A suitable indicator should be chosen, preferably one that will experience a change in colour (an end point) close to the equivalence point of the reaction.
Mathematical analysis: titration of weak acid
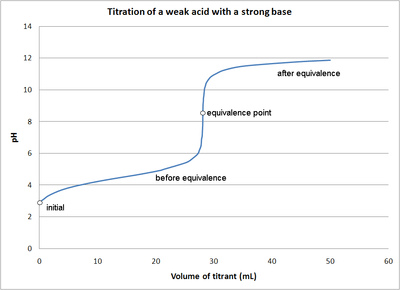
The pH of a weak acid solution being titrated with a strong base solution can be found at different points along the way. These points fall into one of four categories:[2]
- initial pH
- pH before the equivalence point
- pH at the equivalence point
- pH after the equivalence point
for more rigorous calculation, using a RICE chart is required. In fact the equations below are a simplification of the RICE chart.
- The initial pH is approximated for a weak acid solution in water using the equation
- The pH before the equivalence point depends on the amount of weak acid remaining and the amount of conjugate base formed. The pH can be calculated approximately by the Henderson–Hasselbalch equation:
with
- = initial concentration of the acid, divided by mol/L.
- = concentration of the base added, divided by mol/L.
- = initial volume of the acid.
- = volume of the base added.
- At the equivalence point, the weak acid is consumed and converted to its conjugate base. The pH will be greater than 7 and can be calculated from an equation derived from the following relationships:
with
- After the equivalence point, the solution will contain two bases: the conjugate base of the acid and the strong base of the titrant. However, the base of the titrant is stronger than the conjugate base of the acid. Therefore, the pH in this region is controlled by the strong base. As such the pH can be found using the following:


Single formula
More accurately, a single formula[3] that describes the titration of a weak acid with a strong base from start to finish is given below:


where " φ = fraction of completion of the titration (φ < 1 is before the equivalence point, φ = 1 is the equivalence point, and φ > 1 is after the equivalence point)
- = the concentrations of the acid and base respectively
- = the volumes of the acid and base respectively
- = the fraction of the weak acid that is ionized
- = the dissociation constant for the acid
- = concentrations of the H+ and OH– ions respectively


Gallery

Graphical methods
The titration process creates solutions with compositions ranging from pure acid to pure base. Identifying the pH associated with any stage in the titration process is relatively simple for monoprotic acids and bases. The presence of more than one acid or base group complicates these computations. Graphical methods,[4] such as the equiligraph,[5] have long been used to account for the interaction of coupled equilibria. These graphical solution methods are simple to implement, however they are infrequently used.
See also
- Henderson–Hasselbalch equation
- Gran plot (also known as Gran titration or the Gran method)
References
- The Chemical Age – Chemical Dictionary – Chemical Terms. Hesperides. 2007-03-15. p. 14. ISBN 978-1-4067-5758-3.
- Quantitative Chemical Analysis, 7Ed. by Daniel C. Harris. Freeman and Company 2007.
- De Levie, Robert (1993). "Explicit expressions of the general form of the titration curve in terms of concentration: Writing a single closed-form expression for the titration curve for a variety of titrations without using approximations or segmentation". Journal of Chemical Education. 70 (3): 209. Bibcode:1993JChEd..70..209D. doi:10.1021/ed070p209.
- "The Equligraph: Revisiting an old tool". Retrieved 4 October 2015.
- Freiser, H. (1963). Ionic Equilibria in Analytical Chemistry. Kreiger. ISBN 0-88275-955-8.
External links
| Wikimedia Commons has media related to Acid-base titration. |
- Graphical method to solve acid-base problems, including titrations
- Graphic and numerical solver for general acid-base problems - Software Program for phone and tablets
| Instrumentation |
|
|---|---|
| Techniques |
|
| Sampling |
|
| Calibration | |
| Prominent publications | |
| |