2019 Mendip District Council election
The 2019 Mendip District Council election took place on 2 May 2019 to elect members of Mendip District Council in England. As Mendip District councillors are elected on a 4-year term, the next election is due to take place in 2023.[1]
| |||||||||||||||||||||||||||||||||||||||||||||||||||||
All 47 seats to Mendip District Council 24 seats needed for a majority | |||||||||||||||||||||||||||||||||||||||||||||||||||||
|---|---|---|---|---|---|---|---|---|---|---|---|---|---|---|---|---|---|---|---|---|---|---|---|---|---|---|---|---|---|---|---|---|---|---|---|---|---|---|---|---|---|---|---|---|---|---|---|---|---|---|---|---|---|
| |||||||||||||||||||||||||||||||||||||||||||||||||||||
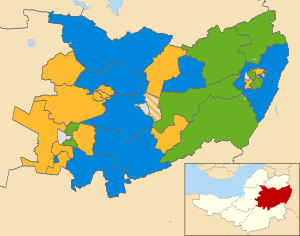 Map showing the results of the 2019 Mendip District Council following the election. | |||||||||||||||||||||||||||||||||||||||||||||||||||||
| |||||||||||||||||||||||||||||||||||||||||||||||||||||
Election results
| Party | Seats | Gains | Losses | Net gain/loss | Seats % | Votes % | Votes | +/− | |
|---|---|---|---|---|---|---|---|---|---|
| Liberal Democrats | 22 | +11 | 46.8 | 33.9 | 16,228 | ||||
| Conservative | 10 | −22 | 21.3 | 33.5 | 16,067 | ||||
| Green | 10 | +7 | 21.3 | 15.9 | 7,633 | ||||
| Independent | 5 | +4 | 10.6 | 7.0 | 3,344 | ||||
| Labour | 0 | +/−0 | 0.0 | 9.6 | 4,667 | ||||
| UKIP | 0 | +/−0 | 0.0 | 0.1 | 56 | ||||
Ward results
The ward results listed below are based on the changes from the 2015 elections not taking into account any party defections or by-elections. Sitting councillors are marked with an asterisk (*).
Ammerdown
| Party | Candidate | Votes | % | ± | |
|---|---|---|---|---|---|
| Green | Alison Margaret Barkshire | 441 | 59.6 | +39.5 | |
| Conservative | Edward George Drewe * | 299 | 40.4 | –5.2 | |
| Majority | 142 | 19.2 | N/A | ||
| Turnout | 757 | 38.3 | –35.0 | ||
| Green gain from Conservative | Swing | ||||
Ashwick, Chilcompton and Stratton
| Party | Candidate | Votes | % | ± | |
|---|---|---|---|---|---|
| Liberal Democrats | Joshua Stuart Burr | 655 | 44.6 | +6.5 | |
| Liberal Democrats | Sam Robin Phripp | 611 | – | ||
| Conservative | Rachel Carter * | 454 | 30.9 | –10.1 | |
| Conservative | John Gerrard Carter * | 441 | – | ||
| Green | David Hine | 233 | 15.9 | N/A | |
| Labour | Ant Butler | 126 | 8.6 | N/A | |
| Turnout | 36.8 | –34.2 | |||
| Liberal Democrats gain from Conservative | Swing | ||||
| Liberal Democrats gain from Conservative | Swing | ||||
Beckington and Selwood
| Party | Candidate | Votes | % | ± | |
|---|---|---|---|---|---|
| Conservative | Shannon Brooke | 383 | 51.2 | –5.8 | |
| Green | Julian Thomas | 193 | 25.8 | +5.8 | |
| Liberal Democrats | Christine Frances Cockroft | 172 | 23.0 | ±0.0 | |
| Majority | 190 | 25.4 | –8.7 | ||
| Turnout | 753 | 42.0 | –31.1 | ||
| Conservative hold | Swing | ||||
Butleigh and Baltonsborough
| Party | Candidate | Votes | % | ± | |
|---|---|---|---|---|---|
| Conservative | Nigel Woollcombe-Adams * | 427 | 52.6 | –8.3 | |
| Liberal Democrats | Richard George Wiltshire | 270 | 33.3 | –5.8 | |
| Labour | Jackie Llewellyn | 115 | 14.2 | N/A | |
| Majority | 157 | 19.3 | –2.5 | ||
| Turnout | 827 | 42.9 | –32.3 | ||
| Conservative hold | Swing | ||||
Chewton Mendip and Ston Easton
| Party | Candidate | Votes | % | ± | |
|---|---|---|---|---|---|
| Conservative | Tom Killen * | 557 | 68.5 | N/A | |
| Liberal Democrats | Christina Murray Baron | 184 | 22.6 | N/A | |
| Labour | Jacky Carter | 72 | 8.9 | N/A | |
| Majority | 373 | 45.9 | N/A | ||
| Turnout | 824 | 47.2 | N/A | ||
| Conservative hold | |||||
Coleford and Holcombe
| Party | Candidate | Votes | % | ± | |
|---|---|---|---|---|---|
| Conservative | Philip John Ham * | 788 | 63.3 | +16.4 | |
| Conservative | Alan Townsend * | 705 | – | ||
| Labour | Melanie Moulding | 456 | 36.7 | N/A | |
| Labour | Chad Chapman | 423 | – | ||
| Turnout | 34.7 | –34.1 | |||
| Conservative hold | Swing | ||||
| Conservative hold | Swing | ||||
Cranmore, Doulting and Nunney
| Party | Candidate | Votes | % | ± | |
|---|---|---|---|---|---|
| Green | Francis Edward Hayden | 419 | 50.9 | N/A | |
| Conservative | David Julian Van Dyk * | 404 | 49.1 | +3.0 | |
| Majority | 15 | 1.8 | N/A | ||
| Turnout | 842 | 45.4 | –27.2 | ||
| Green gain from Conservative | Swing | ||||
Creech
| Party | Candidate | Votes | % | ± | |
|---|---|---|---|---|---|
| Liberal Democrats | Barry William O'Leary | 552 | 63.8 | +34.1 | |
| Conservative | Lesley Anne Parham | 313 | 36.2 | –18.9 | |
| Majority | 239 | 27.6 | N/A | ||
| Turnout | 874 | 43.6 | –23.2 | ||
| Liberal Democrats gain from Conservative | Swing | ||||
Croscombe and Pilton
| Party | Candidate | Votes | % | ± | |
|---|---|---|---|---|---|
| Conservative | Nigel Hewitt-Cooper * | 360 | 34.4 | –23.5 | |
| Liberal Democrats | Ross Kessell | 338 | 32.3 | –9.8 | |
| Independent | James Neil Morris | 202 | 19.3 | N/A | |
| Labour Co-op | Gregory Paul Turner | 146 | 14.0 | N/A | |
| Majority | 22 | 2.1 | –13.7 | ||
| Turnout | 1,050 | 49.1 | –21.4 | ||
| Conservative hold | Swing | ||||
Frome Berkley Down
| Party | Candidate | Votes | % | ± | |
|---|---|---|---|---|---|
| Liberal Democrats | Janine Louise Nash | 427 | 34.8 | +6.8 | |
| Conservative | Eve Berry * | 409 | 33.3 | –5.9 | |
| Green | Matt Mellen | 391 | 31.9 | +17.0 | |
| Conservative | Martin Victor Clark | 341 | – | ||
| Liberal Democrats | Alex Shingler | 304 | – | ||
| Turnout | 32.1 | –31.6 | |||
| Liberal Democrats gain from Conservative | Swing | ||||
| Conservative hold | Swing | ||||
Frome College
| Party | Candidate | Votes | % | ± | |
|---|---|---|---|---|---|
| Liberal Democrats | Adam Owen Matthew Boyden * | 785 | 61.6 | +24.9 | |
| Liberal Democrats | Drew James Gardner | 689 | – | ||
| Conservative | Carole Jane Bullen * | 329 | 25.8 | –12.5 | |
| Conservative | Jamie Seviour | 282 | – | ||
| Labour | Christine Olive De Pufford | 160 | 12.6 | +2.0 | |
| Labour | Lucy Josephine Shapcott | 149 | – | ||
| Turnout | 38.8 | –29.3 | |||
| Liberal Democrats hold | Swing | ||||
| Liberal Democrats gain from Conservative | Swing | ||||
Frome Keyford
| Party | Candidate | Votes | % | ± | |
|---|---|---|---|---|---|
| Green | Shane Collins * | 1,011 | 69.6 | +40.5 | |
| Green | Helen Kay | 977 | – | ||
| Labour | David Alan Oakensen | 257 | 17.7 | +3.2 | |
| Labour | Billy Almond | 249 | – | ||
| Conservative | Randall Heather | 184 | 12.7 | –6.2 | |
| Conservative | Graham Noel | 173 | – | ||
| Turnout | 34.2 | –27.1 | |||
| Green hold | Swing | ||||
| Green gain from Liberal Democrats | Swing | ||||
Frome Market
| Party | Candidate | Votes | % | ± | |
|---|---|---|---|---|---|
| Green | John Clarke | 888 | 64.3 | +29.4 | |
| Green | Michael John Dunk | 868 | – | ||
| Labour | Rosie Mitchell | 252 | 18.2 | +1.3 | |
| Conservative | Elizabeth Janet John | 241 | 17.5 | –9.0 | |
| Conservative | Chris Stacey Moor | 189 | |||
| Labour | Marc James Peel | 179 | – | ||
| Turnout | 37.4 | –25.0 | |||
| Green hold | Swing | ||||
| Green hold | Swing | ||||
Frome Oakfield
| Party | Candidate | Votes | % | ± | |
|---|---|---|---|---|---|
| Independent | Helen Elaine Sprawson-White * | 666 | 81.7 | N/A | |
| Labour | David Ramsay Sibbald | 86 | 10.6 | +1.5 | |
| Conservative | Beverley Ann Andree | 63 | 7.7 | –11.5 | |
| Majority | 580 | 71.2 | N/A | ||
| Turnout | 824 | 41.1 | –23.8 | ||
| Independent gain from Liberal Democrats | Swing | ||||
Helen Elaine Sprawson-White was elected as a Liberal Democrat in 2015.
Frome Park
| Party | Candidate | Votes | % | ± | |
|---|---|---|---|---|---|
| Liberal Democrats | Damon John Hooton * | 647 | 52.6 | +19.1 | |
| Liberal Democrats | Richard Francis Pinnock | 611 | – | ||
| Labour | Pete Mellen | 334 | 27.2 | +7.8 | |
| Labour | Sean L Powell | 308 | – | ||
| Conservative | Vicky Hicks | 248 | 20.2 | –9.8 | |
| Conservative | Hilary Anne Thomas | 225 | – | ||
| Turnout | 34.5 | –27.2 | |||
| Liberal Democrats hold | Swing | ||||
| Liberal Democrats hold | Swing | ||||
Glastonbury St Benedict's
| Party | Candidate | Votes | % | ± | |
|---|---|---|---|---|---|
| Independent | Robert Stephen Henderson * | 227 | 31.2 | N/A | |
| Green | Brian Adrian Outten | 181 | 24.9 | –15.1 | |
| Liberal Democrats | Maggie Dear | 151 | 20.7 | N/A | |
| Conservative | Stephen Bower | 92 | 12.6 | –32.8 | |
| Labour | Emma Jane King | 77 | 10.6 | –4.0 | |
| Majority | 46 | 6.3 | N/A | ||
| Turnout | 728 | 37.7 | –22.2 | ||
| Independent gain from Conservative | Swing | ||||
Robert Stephen Henderson was elected as a Conservative in 2015.
Glastonbury St Edmund's
| Party | Candidate | Votes | % | ± | |
|---|---|---|---|---|---|
| Liberal Democrats | Nick Cottle * | 322 | 43.6 | +7.3 | |
| Green | Michael Kenneth Smyth | 239 | 32.3 | –3.7 | |
| Conservative | Rachel Mary Thompson | 114 | 15.4 | –12.2 | |
| Labour | Simon Anthony Baker-Cooke | 64 | 8.7 | N/A | |
| Majority | 83 | 11.2 | +10.9 | ||
| Turnout | 750 | 44.9 | –26.1 | ||
| Liberal Democrats hold | Swing | ||||
Glastonbury St John's
| Party | Candidate | Votes | % | ± | |
|---|---|---|---|---|---|
| Green | Jon Cousins | 262 | 41.9 | –2.3 | |
| Conservative | John Evan Coles * | 260 | 41.6 | –14.2 | |
| Labour | John Anthony Graham | 103 | 16.5 | N/A | |
| Majority | 2 | 0.3 | N/A | ||
| Turnout | 640 | 32.6 | –31.8 | ||
| Green gain from Conservative | Swing | ||||
Glastonbury St Mary's
| Party | Candidate | Votes | % | ± | |
|---|---|---|---|---|---|
| Green | Lindsay Macdougall | 217 | 25.9 | –1.9 | |
| Conservative | David Albert Swain | 197 | 23.5 | –17.9 | |
| Independent | Robert Paul Lund | 190 | 22.7 | N/A | |
| Liberal Democrats | Laiqa Browne | 186 | 22.2 | +0.1 | |
| Labour | Kama Hannah McKenzie | 47 | 5.6 | N/A | |
| Majority | 20 | 2.4 | N/A | ||
| Turnout | 840 | 50.2 | –21.9 | ||
| Green gain from Conservative | Swing | ||||
Moor
| Party | Candidate | Votes | % | ± | |
|---|---|---|---|---|---|
| Liberal Democrats | Matthew Henry Martin | 483 | 64.7 | +27.6 | |
| Conservative | Sean David Edwin Sloan | 264 | 35.3 | –27.6 | |
| Majority | 219 | 29.3 | N/A | ||
| Turnout | 760 | 36.2 | –35.4 | ||
| Liberal Democrats gain from Conservative | Swing | ||||
Postlebury
| Party | Candidate | Votes | % | ± | |
|---|---|---|---|---|---|
| Green | Michael Gay | 444 | 57.2 | +31.5 | |
| Conservative | Linda Jean Norris | 332 | 42.8 | –9.4 | |
| Majority | 112 | 14.4 | N/A | ||
| Turnout | 782 | 46.2 | –30.7 | ||
| Green gain from Conservative | Swing | ||||
Rode and Norton St. Philip
| Party | Candidate | Votes | % | ± | |
|---|---|---|---|---|---|
| Green | Barbi Lund | 456 | 46.3 | N/A | |
| Conservative | David John Baker | 426 | 43.3 | –26.7 | |
| UKIP | Dion Ralph Drayson | 56 | 5.7 | N/A | |
| Labour | Pascale Gillet | 46 | 4.7 | N/A | |
| Majority | 30 | 3.0 | N/A | ||
| Turnout | 989 | 50.7 | –28.2 | ||
| Green gain from Conservative | Swing | ||||
Rodney and Westbury
| Party | Candidate | Votes | % | ± | |
|---|---|---|---|---|---|
| Liberal Democrats | Ros Wyke * | 630 | 74.0 | +26.6 | |
| Conservative | Holly Sinead Mary Osman | 221 | 26.0 | –17.9 | |
| Majority | 409 | 48.1 | +44.6 | ||
| Turnout | 858 | 48.8 | –30.7 | ||
| Liberal Democrats hold | Swing | ||||
Shepton East
| Party | Candidate | Votes | % | ± | |
|---|---|---|---|---|---|
| Independent | Bente Height * | 388 | 31.0 | N/A | |
| Liberal Democrats | Warren Garfield Kennedy | 388 | 31.0 | –4.9 | |
| Independent | Nicholas Tolson | 348 | – | N/A | |
| Liberal Democrats | Gavin James Mayall | 336 | – | ||
| Conservative | Jeannette May Marsh * | 335 | 26.8 | –18.2 | |
| Conservative | Nigel Ivan Pooley | 258 | – | ||
| Labour | Kevin Powell | 140 | 11.2 | –8.0 | |
| Turnout | 30.9 | –26.9 | |||
| Independent gain from Conservative | Swing | ||||
| Liberal Democrats gain from Conservative | Swing | ||||
Bente Height was elected as a Conservative in 2015.
Shepton West
| Party | Candidate | Votes | % | ± | |
|---|---|---|---|---|---|
| Independent | Chris Inchley | 633 | 45.0 | N/A | |
| Independent | Edric Wayland Hobbs | 580 | – | N/A | |
| Conservative | John William Parham * | 427 | 30.3 | –6.5 | |
| Conservative | Wayne Frapple | 389 | – | ||
| Green | Paul Francis Crummay | 184 | 13.1 | N/A | |
| Labour | Gareth Davies John | 164 | 11.6 | –21.2 | |
| Turnout | 34.5 | –28.1 | |||
| Independent gain from Conservative | Swing | ||||
| Independent gain from Conservative | Swing | ||||
St Cuthbert Out North
| Party | Candidate | Votes | % | ± | |
|---|---|---|---|---|---|
| Conservative | Mike Pullin * | 451 | 52.6 | +3.8 | |
| Liberal Democrats | Tom Wyatt | 406 | 47.4 | +36.1 | |
| Majority | 45 | 5.3 | –17.3 | ||
| Turnout | 879 | 43.3 | –31.1 | ||
| Conservative hold | Swing | ||||
Street North
| Party | Candidate | Votes | % | ± | |
|---|---|---|---|---|---|
| Liberal Democrats | Heather Shearer | 519 | 55.4 | +5.1 | |
| Liberal Democrats | Peter Goater | 492 | – | ||
| Conservative | Matthew Tomlinson | 285 | 30.4 | –19.3 | |
| Conservative | Christopher John Allen | 248 | – | ||
| Labour | John Diment | 133 | 14.2 | N/A | |
| Turnout | 28.0 | –33.2 | |||
| Liberal Democrats hold | Swing | ||||
| Liberal Democrats gain from Conservative | Swing | ||||
Street South
| Party | Candidate | Votes | % | ± | |
|---|---|---|---|---|---|
| Liberal Democrats | Liz Leyshon | 883 | 70.6 | +40.2 | |
| Liberal Democrats | Simon Michael Carswell | 740 | – | ||
| Conservative | Bryan Beha * | 368 | 29.4 | +4.3 | |
| Conservative | Sebastian Alexander Johns | 258 | – | ||
| Turnout | 33.1 | –32.2 | |||
| Liberal Democrats hold | Swing | ||||
| Liberal Democrats gain from Independent | Swing | ||||
Bryan Beha was elected as a Liberal Democrat in 2015.
Street West
| Party | Candidate | Votes | % | ± | |
|---|---|---|---|---|---|
| Conservative | Terry William Napper * | 327 | 52.8 | –11.7 | |
| Liberal Democrats | Adam Sen * | 246 | 39.7 | +4.2 | |
| Labour | Andy Merryfield | 46 | 7.4 | N/A | |
| Majority | 81 | 13.1 | –15.9 | ||
| Turnout | 629 | 34.4 | –36.6 | ||
| Conservative hold | Swing | ||||
The Pennards and Ditcheat
| Party | Candidate | Votes | % | ± | |
|---|---|---|---|---|---|
| Conservative | John Howard Greenhalgh * | 400 | 51.8 | –11.8 | |
| Liberal Democrats | Rob Reed | 201 | 26.0 | –10.4 | |
| Independent | Paul James Chant | 110 | 14.2 | N/A | |
| Labour | Robert McKie | 61 | 7.9 | N/A | |
| Majority | 199 | 25.8 | –1.3 | ||
| Turnout | 777 | 39.7 | –28.9 | ||
| Conservative hold | Swing | ||||
Wells Central
| Party | Candidate | Votes | % | ± | |
|---|---|---|---|---|---|
| Liberal Democrats | Virginia Lois Rogers | 500 | 61.7 | +26.0 | |
| Conservative | John North * | 247 | 30.5 | –11.0 | |
| Labour Co-op | Gill Pettitt | 63 | 7.8 | N/A | |
| Majority | 253 | 31.2 | N/A | ||
| Turnout | 830 | 46.2 | –25.3 | ||
| Liberal Democrats gain from Conservative | Swing | ||||
Wells St Cuthbert's
| Party | Candidate | Votes | % | ± | |
|---|---|---|---|---|---|
| Liberal Democrats | Rob Ayres | 670 | 44.4 | +15.8 | |
| Liberal Democrats | Laura Jayne Waters | 635 | |||
| Conservative | John Derek Osman * | 591 | 39.2 | +3.9 | |
| Conservative | Harvey Siggs * | 553 | – | ||
| Labour | Jennifer Anne Williams | 247 | 16.4 | –5.2 | |
| Turnout | 42.3 | –26.0 | |||
| Liberal Democrats gain from Conservative | Swing | ||||
| Liberal Democrats gain from Conservative | Swing | ||||
Wells St Thomas'
| Party | Candidate | Votes | % | ± | |
|---|---|---|---|---|---|
| Liberal Democrats | Tom Ronan | 939 | 59.3 | +15.2 | |
| Liberal Democrats | Caroline Louise Foss McKinnell | 934 | – | ||
| Conservative | Richard James Greenwell | 480 | 30.3 | –5.0 | |
| Conservative | Sarah Frances Sloan | 435 | – | ||
| Labour Co-op | Eileen Vivian Webber | 164 | 10.4 | N/A | |
| Turnout | 47.4 | –26.4 | |||
| Liberal Democrats hold | Swing | ||||
| Liberal Democrats hold | Swing | ||||
Wookey and St Cuthbert Out West
| Party | Candidate | Votes | % | ± | |
|---|---|---|---|---|---|
| Liberal Democrats | Lucie Claire Taylor Hood | 322 | 41.7 | +6.1 | |
| Conservative | Nigel Philip Taylor * | 294 | 38.0 | –12.0 | |
| Green | Mark Christopher Montgomery | 157 | 20.3 | +5.8 | |
| Majority | 28 | 3.6 | N/A | ||
| Turnout | 782 | 37.7 | –34.9 | ||
| Liberal Democrats gain from Conservative | Swing | ||||
References
- "Election Timetable in England". www.local.gov.uk. Archived from the original on 6 May 2016. Retrieved 6 May 2016.
- "Mendip District Council - Results for District Ward Elections 2019". mendip.gov.uk. Mendip District Council. 3 May 2019. Archived from the original on 26 May 2019. Retrieved 6 May 2020.
- "Declaration of Result of Poll – Election of a Councillor for the Ammerdown Ward" (PDF). mendp.gov.uk. Mendip District Council. 3 May 2019. Retrieved 6 May 2020.
- "Declaration of Result of Poll – Election of a Councillor for the Ashwick, Chilcompton and Stratton Ward" (PDF). mendp.gov.uk. Mendip District Council. 3 May 2019. Retrieved 6 May 2020.
- "Declaration of Result of Poll – Election of a Councillor for the Beckington and Selwood Ward" (PDF). mendp.gov.uk. Mendip District Council. 3 May 2019. Retrieved 6 May 2020.
- "Declaration of Result of Poll – Election of a Councillor for the Butleigh and Baltonsborough Ward" (PDF). mendp.gov.uk. Mendip District Council. 3 May 2019. Retrieved 6 May 2020.
- "Declaration of Result of Poll – Election of a Councillor for the Chewton Mendip and Ston Easton Ward" (PDF). mendp.gov.uk. Mendip District Council. 3 May 2019. Retrieved 6 May 2020.
- "Declaration of Result of Poll – Election of a Councillor for the Coleford and Holcombe Ward" (PDF). mendp.gov.uk. Mendip District Council. 3 May 2019. Retrieved 6 May 2020.
- "Declaration of Result of Poll – Election of a Councillor for the Cranmore, Doulting and Nunney Ward" (PDF). mendp.gov.uk. Mendip District Council. 3 May 2019. Retrieved 6 May 2020.
- "Declaration of Result of Poll – Election of a Councillor for the Creech Ward" (PDF). mendp.gov.uk. Mendip District Council. 3 May 2019. Retrieved 6 May 2020.
- "Declaration of Result of Poll – Election of a Councillor for the Croscombe and Pilton Ward" (PDF). mendp.gov.uk. Mendip District Council. 3 May 2019. Retrieved 6 May 2020.
- "Declaration of Result of Poll – Election of a Councillor for the Frome Berkley Down Ward" (PDF). mendp.gov.uk. Mendip District Council. 3 May 2019. Retrieved 6 May 2020.
- "Declaration of Result of Poll – Election of a Councillor for the Frome College Ward" (PDF). mendp.gov.uk. Mendip District Council. 3 May 2019. Retrieved 6 May 2020.
- "Declaration of Result of Poll – Election of a Councillor for the Frome Keyford Ward" (PDF). mendp.gov.uk. Mendip District Council. 3 May 2019. Retrieved 6 May 2020.
- "Declaration of Result of Poll – Election of a Councillor for the Frome Market Ward" (PDF). mendp.gov.uk. Mendip District Council. 3 May 2019. Retrieved 6 May 2020.
- "Declaration of Result of Poll – Election of a Councillor for the Frome Oakfield Ward" (PDF). mendp.gov.uk. Mendip District Council. 3 May 2019. Retrieved 6 May 2020.
- "Declaration of Result of Poll – Election of a Councillor for the Frome Park Ward" (PDF). mendp.gov.uk. Mendip District Council. 3 May 2019. Retrieved 6 May 2020.
- "Declaration of Result of Poll – Election of a Councillor for the Glastonbury St Benedict's Ward" (PDF). mendp.gov.uk. Mendip District Council. 3 May 2019. Retrieved 6 May 2020.
- "Declaration of Result of Poll – Election of a Councillor for the Glastonbury St Edmund's Ward" (PDF). mendp.gov.uk. Mendip District Council. 3 May 2019. Retrieved 6 May 2020.
- "Declaration of Result of Poll – Election of a Councillor for the Glastonbury St John's Ward" (PDF). mendp.gov.uk. Mendip District Council. 3 May 2019. Retrieved 6 May 2020.
- "Declaration of Result of Poll – Election of a Councillor for the Glastonbury St Mary's Ward" (PDF). mendp.gov.uk. Mendip District Council. 3 May 2019. Retrieved 6 May 2020.
- "Declaration of Result of Poll – Election of a Councillor for the Moor Ward" (PDF). mendp.gov.uk. Mendip District Council. 3 May 2019. Retrieved 6 May 2020.
- "Declaration of Result of Poll – Election of a Councillor for the Postlebury Ward" (PDF). mendp.gov.uk. Mendip District Council. 3 May 2019. Retrieved 6 May 2020.
- "Declaration of Result of Poll – Election of a Councillor for the Rode and Norton St. Philip Ward" (PDF). mendp.gov.uk. Mendip District Council. 3 May 2019. Retrieved 6 May 2020.
- "Declaration of Result of Poll – Election of a Councillor for the Rodney and Westbury Ward" (PDF). mendp.gov.uk. Mendip District Council. 3 May 2019. Retrieved 6 May 2020.
- "Declaration of Result of Poll – Election of a Councillor for the Shepton East Ward" (PDF). mendp.gov.uk. Mendip District Council. 3 May 2019. Retrieved 6 May 2020.
- "Declaration of Result of Poll – Election of a Councillor for the Shepton West Ward" (PDF). mendp.gov.uk. Mendip District Council. 3 May 2019. Retrieved 6 May 2020.
- "Declaration of Result of Poll – Election of a Councillor for the St Cuthbert Out North Ward" (PDF). mendp.gov.uk. Mendip District Council. 3 May 2019. Retrieved 6 May 2020.
- "Declaration of Result of Poll – Election of a Councillor for the Street North Ward" (PDF). mendp.gov.uk. Mendip District Council. 3 May 2019. Retrieved 6 May 2020.
- "Declaration of Result of Poll – Election of a Councillor for the Street South Ward" (PDF). mendp.gov.uk. Mendip District Council. 3 May 2019. Retrieved 6 May 2020.
- "Declaration of Result of Poll – Election of a Councillor for the Street West Ward" (PDF). mendp.gov.uk. Mendip District Council. 3 May 2019. Retrieved 6 May 2020.
- "Declaration of Result of Poll – Election of a Councillor for the The[sic] Pennards and Ditcheat Ward" (PDF). mendp.gov.uk. Mendip District Council. 3 May 2019. Retrieved 6 May 2020.
- "Declaration of Result of Poll – Election of a Councillor for the Wells Central Ward" (PDF). mendp.gov.uk. Mendip District Council. 3 May 2019. Retrieved 6 May 2020.
- "Declaration of Result of Poll – Election of a Councillor for the Wells St Cuthbert's Ward" (PDF). mendp.gov.uk. Mendip District Council. 3 May 2019. Retrieved 6 May 2020.
- "Declaration of Result of Poll – Election of a Councillor for the Wells St Thomas' Ward" (PDF). mendp.gov.uk. Mendip District Council. 3 May 2019. Retrieved 6 May 2020.
- "Declaration of Result of Poll – Election of a Councillor for the Wookey and St Cuthbert Out West Ward" (PDF). mendp.gov.uk. Mendip District Council. 3 May 2019. Retrieved 6 May 2020.
| Somerset County Council | |
|---|---|
| Bath and North East Somerset Council | |
| Mendip District Council | |
| North Somerset Council | |
| Sedgemoor District Council | |
| South Somerset District Council | |
| Somerset West and Taunton District Council | |
| Avon County Council |
|
| Bath City Council | |
| Taunton Deane Borough Council | |
| Wansdyke District Council |
|
| West Somerset District Council | |
| West of England Mayor | |
| |
This article is issued from Wikipedia. The text is licensed under Creative Commons - Attribution - Sharealike. Additional terms may apply for the media files.