2015 City of York Council election
The 2015 City of York Council election took place on 7 May 2015 to elect members of City of York Council in England.[1] The whole council was up for election. Turnout was substantially up across the city due to the election being held on the same day as the general election and other local elections in England.
| |||||||||||||||||||||||||||||||||||||||||||||||||
All 47 seats to City of York Council 24 seats needed for a majority | |||||||||||||||||||||||||||||||||||||||||||||||||
|---|---|---|---|---|---|---|---|---|---|---|---|---|---|---|---|---|---|---|---|---|---|---|---|---|---|---|---|---|---|---|---|---|---|---|---|---|---|---|---|---|---|---|---|---|---|---|---|---|---|
| |||||||||||||||||||||||||||||||||||||||||||||||||
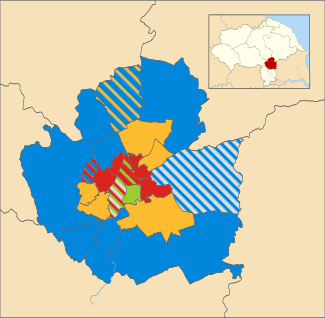 Map of results of 2015 election | |||||||||||||||||||||||||||||||||||||||||||||||||
| |||||||||||||||||||||||||||||||||||||||||||||||||
Since the previous election in 2011 a review of ward boundaries had affected some wards, although the total number of councillors remained at 47. The following wards remained unchanged from 2011: Acomb, Bishopthorpe, Dringhouses and Woodthorpe, Haxby and Wigginton, Holgate, Huntington and New Earswick, Micklegate, Strensall, Westfield and Wheldrake. All other wards saw boundary changes and a new ward, Copmanthorpe, was created from the former Rural West York Ward.
The election saw heavy losses for the ruling Labour Party, which had won overall control of the council in 2011, losing more than 40% of the 26 seats won at the previous election. Several senior Labour councillors were defeated including the party's deputy leader Tracey Simpson-Laing and Cabinet members Dave Merrett and Linsay Cunningham.[2] The Conservatives, Liberal Democrats and Greens all made gains and two Independent councillors were also elected. A record number of new councillors were elected, almost half of the entire Council, with the York Press reporting that "of the 47 seats contested, 25 were won by candidates with council experience while 22 were won by debutants."[3] Following talks between the political groups after the election, the Conservatives and Liberal Democrats agreed to run the Council as a joint administration.[4]
Election result
| City of York Council election 2015 | |||||||||||||||
|---|---|---|---|---|---|---|---|---|---|---|---|---|---|---|---|
| Party | Candidates | Votes | |||||||||||||
| Stood | Elected | Gained | Unseated | Net | % of total | % | No. | Net % | |||||||
| Labour | 47 | 15 | n/a | n/a | -11 | 31.9% | 25.6% | 59,164 | -12.0% | ||||||
| Conservative | 47 | 14 | n/a | n/a | +4 | 29.8% | 28.3% | 65,507 | +6.0% | ||||||
| Liberal Democrats | 47 | 12 | n/a | n/a | +4 | 25.5% | 23.9% | 55,331 | -2.5% | ||||||
| Green | 47 | 4 | n/a | n/a | +2 | 8.5% | 15.6% | 36,114 | +3.4% | ||||||
| Independent | 10 | 2 | n/a | n/a | +1 | 4.3% | 3.5% | 7,986 | +3.0% | ||||||
| UKIP | 9 | 0 | n/a | n/a | 0 | 0% | 2.3% | 5,432 | +2.2% | ||||||
| TUSC | 8 | 0 | n/a | n/a | 0 | 0% | 0.7% | 1,711 | +0.6% | ||||||
Ward results
Acomb ward
| Party | Candidate | Votes | % | ± | |
|---|---|---|---|---|---|
| Labour | Stuart Barnes | 1,462 | 17.9 | -13.5 | |
| Conservative | Keith Myers | 1,440 | 17.7 | +5.8 | |
| Labour | Tracey Simpson-Laing * | 1292 | 15.9 | -14.6 | |
| Conservative | Jason Brown | 1286 | 15.8 | +5.2 | |
| UKIP | Vincent Scaum | 679 | 8.3 | N/A | |
| Liberal Democrats | Reuban Mayne | 636 | 7.8 | +3.4 | |
| Green | Alice Rowan | 506 | 6.2 | +2.9 | |
| Liberal Democrats | John Ballantine | 462 | 5.7 | +2.7 | |
| Green | Andy Wilson | 382 | 4.7 | +1.8 | |
| Turnout | 67.3 | +25.1 | |||
| Labour hold | Swing | ||||
| Conservative gain from Labour | Swing | ||||
- * Represented the Acomb ward of City of York Council, 1999–2015 [7]
Bishopthorpe ward
The parishes of Acaster Malbis and Bishopthorpe
| Party | Candidate | Votes | % | ± | |
|---|---|---|---|---|---|
| Conservative | John Galvin * | 1,274 | 49.3 | -0.7 | |
| Independent | Carole Green | 606 | 23.4 | N/A | |
| Labour | Bob Scrase † | 407 | 15.7 | +10.3 | |
| Green | David Williams | 154 | 6.0 | +0.8 | |
| Liberal Democrats | Daniel Khan | 144 | 5.6 | -21.3 | |
| Turnout | 77.5 | +19.6 | |||
| Conservative hold | Swing | ||||
Clifton ward
| Party | Candidate | Votes | % | ± | |
|---|---|---|---|---|---|
| Labour | Danny Myers | 1,554 | 20.2 | 1.7 | |
| Labour | Margaret Wells | 1,175 | 15.2 | -1.8 | |
| Conservative | Bill Gambold | 826 | 10.7 | 3.7 | |
| Conservative | Jan Powell | 705 | 9.1 | 2.3 | |
| Green | Candy Spillard | 658 | 8.5 | -0.2% | |
| Green | John Walford | 584 | 7.6 | 2.1% | |
| Liberal Democrats | Tobie Abel | 550 | 7.1 | 0.3% | |
| Independent | Ken King * | 479 | 6.2 | N/A | |
| UKIP | David Scullion | 465 | 6 | N/A | |
| Liberal Democrats | Derek Wann | 302 | 3.9 | -0.9 | |
| Independent | David Scott † | 279 | 3.6 | N/A | |
| TUSC | Martin Readle | 131 | 1.7 | N/A | |
| Turnout | 60.4 | ||||
| Labour hold | Swing | ||||
| Labour hold | Swing | ||||
- * Represented the Bootham ward of York City Council, 1982–1996, the Fishergate division of North Yorkshire County Council, 1985–1989, the Bootham ward of City of York Council, 1995–2003, and the Clifton ward of City of York Council, 2003–2015 [8] [9] [7]
- † Represented the Clifton ward of City of York Council, 2003–2015 [7]
Copmanthorpe ward
The parish of Copmanthorpe
| Party | Candidate | Votes | % | ± | |
|---|---|---|---|---|---|
| Conservative | David Carr | 1,339 | 50.6 | ||
| Liberal Democrats | Richard Brown | 689 | 26.1 | ||
| Labour | David Horton * | 432 | 16.3 | ||
| Green | Jennifer Aitken | 184 | 7 | ||
| Turnout | 2644 | 75.7 | |||
| Conservative win (new seat) | |||||
Dringhouses and Woodthorpe ward
| Party | Candidate | Votes | % | ± | |
|---|---|---|---|---|---|
| Liberal Democrats | Ann Reid * | 3,104 | 16.6 | ||
| Liberal Democrats | Stephen Fenton | 2,649 | 14.2 | ||
| Liberal Democrats | Ashley Mason | 2,368 | 12.7 | ||
| Conservative | Daniel Donnor | 1728 | 9.2 | ||
| Conservative | Matthew Litten | 1569 | 8.4 | ||
| Conservative | Matt Freckelton | 1461 | 7.8 | ||
| Labour | Gerard Hodgson † | 1238 | 6.6 | ||
| Labour | Rita Milne | 1159 | 6.2 | ||
| Labour | William Owen | 1022 | 5.5 | ||
| UKIP | Paul Abbott | 792 | 4.2 | ||
| Green | Bronwen Gray | 635 | 3.4 | ||
| Green | John Gray | 512 | 2.7 | ||
| Green | Caleb Wooding | 459 | 2.5 | ||
| Turnout | 18696 | 72.4 | +21.4 | ||
| Liberal Democrats hold | Swing | ||||
| Liberal Democrats gain from Labour | Swing | ||||
| Liberal Democrats gain from Labour | Swing | ||||
Fishergate ward
| Party | Candidate | Votes | % | ± | |
|---|---|---|---|---|---|
| Green | Andy D'Agorne * | 2,241 | 27.1 | ||
| Green | Dave Taylor † | 1,997 | 24.1 | ||
| Labour | George Norman | 974 | 11.8 | ||
| Labour | Susan Watson | 785 | 9.5 | ||
| Conservative | Hugo Graham | 587 | 7.1 | ||
| Conservative | Margaret Redfern | 573 | 6.9 | ||
| UKIP | Thomas Turton | 315 | 3.8 | ||
| Liberal Democrats | Charlie Kingsbury | 275 | 3.3 | ||
| Liberal Democrats | Shawn Imeson | 154 | 1.9 | ||
| TUSC | Jamie Chatfield | 103 | 1.2 | ||
| Turnout | 8274 | 66.2 | +17.5 | ||
| Green hold | Swing | ||||
| Green hold | Swing | ||||
Fulford and Heslington ward
The parish of Fulford and part of the parish of Heslington
| Party | Candidate | Votes | % | ± | |
|---|---|---|---|---|---|
| Liberal Democrats | Keith Aspden * | 1,188 | 55.6 | 6.8 | |
| Conservative | Calum Stewart | 437 | 20.5 | 5.6 | |
| Labour | Geoff Fletcher | 355 | 16.6 | -14.2 | |
| Green | Tess McMahon | 156 | 5.6 | - | |
| Turnout | 2136 | 70.6 | |||
| Liberal Democrats hold | Swing | ||||
- * Represented the Fulford ward of City of York Council, 2003–2015 [7]
Guildhall ward
| Party | Candidate | Votes | % | ± | |
|---|---|---|---|---|---|
| Green | Denise Craghill | 1,895 | 12.5 | ||
| Labour | James Flinders | 1,625 | 10.7 | ||
| Labour | Janet Looker * | 1,621 | 10.7 | ||
| Labour | Kate Pilling | 1407 | 9.3 | ||
| Green | Andy Law | 1253 | 8.3 | ||
| Conservative | Jan Keenan | 1209 | 8.0 | ||
| Conservative | Jack Robinson | 1112 | 7.3 | ||
| Green | June Tranmer | 1060 | 7.0 | ||
| Conservative | Janette Robinson | 984 | 6.5 | ||
| Liberal Democrats | Nick Love | 672 | 4.4 | ||
| UKIP | John Brittlebank | 520 | 3.4 | ||
| Liberal Democrats | Michael Green | 511 | 3.4 | ||
| Independent | Brian Watson † | 416 | 2.7 | ||
| Independent | Gordon Campbell-Thomas | 386 | 2.5 | ||
| Liberal Democrats | Derek Waudby | 254 | 1.7 | ||
| TUSC | Andrew Dickenson | 214 | 1.4 | ||
| Turnout | 53.8 | ||||
| Green gain from Labour | Swing | ||||
| Labour hold | Swing | ||||
| Labour hold | Swing | ||||
- * Represented the Guildhall division of North Yorkshire County Council, 1985–1996, and the Guildhall ward of City of York Council, 1995–2015 [9] [7]
- † Represented the Acomb ward of York City Council, 1979–1984, the Guildhall ward of York City Council, 1988–1996, the Acomb division of North Yorkshire County Council, 1981–1989, and the Guildhall ward of City of York Council, 1995–2015 [8] [9] [7]
Haxby and Wigginton ward
The parishes of Haxby and Wigginton
| Party | Candidate | Votes | % | ± | |
|---|---|---|---|---|---|
| Liberal Democrats | Ian Cuthbertson * | 2,707 | 13.8 | ||
| Conservative | Tony Richardson † | 2,640 | 13.4 | ||
| Conservative | John Gates | 2,582 | 13.1 | ||
| Liberal Democrats | Martin Crosby | 2432 | 12.4 | ||
| Conservative | Roy Watson-Smith | 2395 | 12.2 | ||
| Liberal Democrats | Sue Willer | 2113 | 10.7 | ||
| Labour | Ian Craven | 1129 | 5.7 | ||
| Labour | Stephen Johnstone | 963 | 4.9 | ||
| Labour | Denise Bowgett ‡ | 926 | 4.7 | ||
| Green | Alan Robertshaw | 606 | 3.1 | ||
| Independent | Neil Wyatt | 420 | 2.1 | ||
| Green | Erin Donovan | 414 | 2.1 | ||
| Green | Henry Hale | 344 | 1.7 | ||
| Turnout | 19671 | 71.7 | +23.8 | ||
| Liberal Democrats hold | Swing | ||||
| Conservative hold | Swing | ||||
| Conservative gain from Liberal Democrats | Swing | ||||
Heworth ward
| Party | Candidate | Votes | % | ± | |
|---|---|---|---|---|---|
| Labour | Barbara Boyce * | 2,166 | 14.1 | -4.8 | |
| Labour | Christina Funnell † | 2,101 | 13.6 | -4.5 | |
| Labour | Dafydd Williams ‡ | 2,001 | 13 | -4.9 | |
| Conservative | Jennifer Gambold | 1448 | 9.4 | 0.2 | |
| Conservative | Teri Rhodes | 1377 | 9 | - | |
| Green | Jessica Dixon | 1283 | 8.4 | 3.4 | |
| Conservative | Terry Smith | 1174 | 7.7 | N/A | |
| Green | Nicola Normandale | 1047 | 6.8 | 2.3 | |
| Green | Ginevra Gordon | 907 | 5.9 | N/A | |
| UKIP | Kenneth Guest | 907 | 5.9 | N/A | |
| Liberal Democrats | Ian Packington | 696 | 4.5 | -0.5 | |
| Liberal Democrats | Benedict Rich | 480 | 3.1 | -0.6 | |
| Liberal Democrats | Matthew Smithson | 385 | 2.5 | -0.9 | |
| TUSC | Nigel Smith | 276 | 1.8 | -0.5 | |
| Turnout | 61.3 | ||||
| Labour hold | Swing | ||||
| Labour hold | Swing | ||||
| Labour hold | Swing | ||||
Heworth Without ward
The parish of Heworth Without
| Party | Candidate | Votes | % | ± | |
|---|---|---|---|---|---|
| Liberal Democrats | Nigel Ayre * | 1,420 | 52.4 | -0.2 | |
| Conservative | Andrew Whitney | 603 | 22.3 | -2.1 | |
| Labour | Simon Winch | 374 | 13.8 | -2.1 | |
| UKIP | Fred Bowron | 163 | 6.0 | N/A | |
| Green | Doug Doherty | 150 | 5.5 | 1.1 | |
| Turnout | 75.9 | ||||
| Liberal Democrats hold | Swing | ||||
- * Represented the Heworth Without ward of City of York Council, 2007–2015 [7]
Holgate ward
| Party | Candidate | Votes | % | ± | |
|---|---|---|---|---|---|
| Labour | Sonja Crisp * | 2,183 | 12.5 | -6.4 | |
| Labour | Mary Cannon | 2,037 | 11.7 | -5.3 | |
| Labour | Fiona Derbyshire | 1,789 | 10.2 | -5.1 | |
| Conservative | Adam Cook | 1516 | 8.7 | 3.4 | |
| Green | Pam Hanley | 1273 | 7.3 | 3.5 | |
| Conservative | Kirsten Ovenden | 1221 | 7 | 2.9 | |
| Liberal Democrats | Robert Adamson | 1018 | 5.8 | -5 | |
| Conservative | Petra Sobotkova | 957 | 5.5 | N/A | |
| Green | Andreas Heinemeyer | 954 | 5.5 | 2.4 | |
| UKIP | Judith Morris | 924 | 5.3 | N/A | |
| Green | Peter Harris | 876 | 5 | N/A | |
| Liberal Democrats | Matthew Reid | 849 | 4.9 | -5.3 | |
| Liberal Democrats | Jonathan Morely | 812 | 4.6 | -5.2 | |
| Independent | Christian Vassie † | 729 | 4.2 | N/A | |
| TUSC | Gwen Vardigans | 326 | 1.9 | N/A | |
| Turnout | 65.7 | 21.3 | |||
| Labour hold | Swing | ||||
| Labour hold | Swing | ||||
| Labour hold | Swing | ||||
Hull Road ward
Part of the parish of Heslington
| Party | Candidate | Votes | % | ± | |
|---|---|---|---|---|---|
| Labour | Neil Barnes * | 1,999 | 13.6 | ||
| Labour | Hilary Shepherd | 1,672 | 11.4 | ||
| Labour | David Levene † | 1,599 | 10.9 | ||
| Green | John Cossham | 1408 | 9.6 | ||
| Conservative | Cameron Smith | 1256 | 8.6 | ||
| Conservative | Bethany Wright | 1237 | 8.4 | ||
| Conservative | Jordan Hennessy | 1195 | 8.1 | ||
| Green | John Heawood | 1031 | 7.0 | ||
| Green | Stuart Maule | 857 | 5.8 | ||
| UKIP | Keith Anderson | 667 | 4.5 | ||
| Liberal Democrats | Rachel Edwards | 609 | 4.1 | ||
| Liberal Democrats | Tom Davies | 492 | 3.4 | ||
| Liberal Democrats | Lizzy Roberts | 457 | 3.1 | ||
| TUSC | Megan Ollerhead | 201 | 1.4 | ||
| Turnout | 14680 | 44.7 | |||
| Labour hold | Swing | ||||
| Labour hold | Swing | ||||
| Labour hold | Swing | ||||
- * Represented the Hull Road ward of City of York Council, 2011–2015
- † Represented the Heslington ward of City of York Council, 2011–2015
Huntington and New Earswick ward
The parishes of Huntington and New Earswick
| Party | Candidate | Votes | % | ± | |
|---|---|---|---|---|---|
| Liberal Democrats | Keith Orrell * | 2,885 | 16.1 | ||
| Liberal Democrats | Chris Cullwick | 2,859 | 16.0 | ||
| Liberal Democrats | Carol Runciman † | 2,814 | 15.7 | ||
| Labour | Michael Healy | 1427 | 8.0 | ||
| Conservative | Susan Vaughan | 1388 | 7.7 | ||
| Conservative | Tet Powell | 1263 | 7.0 | ||
| Labour | Lucas Pearce | 1136 | 6.3 | ||
| Conservative | Gavin Shillito | 1133 | 6.3 | ||
| Labour | Jason Rose | 1132 | 6.3 | ||
| Green | Charles Everett | 693 | 3.9 | ||
| Green | Clive Woolley | 621 | 3.5 | ||
| Green | Clive Millard | 569 | 3.2 | ||
| Turnout | 17920 | 63.7 | +23.4 | ||
| Liberal Democrats hold | Swing | ||||
| Liberal Democrats hold | Swing | ||||
| Liberal Democrats hold | Swing | ||||
Micklegate ward
| Party | Candidate | Votes | % | ± | |
|---|---|---|---|---|---|
| Independent | Johnny Hayes | 2,843 | 15.6 | ||
| Labour | Julie Gunnell * | 2,393 | 13.2 | ||
| Green | Lars Kramm | 1,919 | 10.6 | ||
| Labour | Nicholas Button | 1611 | 8.9 | ||
| Green | Mark Havercroft | 1526 | 8.4 | ||
| Green | Helen Johnson | 1495 | 8.2 | ||
| Labour | Dave Merrett † | 1425 | 7.8 | ||
| Conservative | Marc Ilinson | 1332 | 7.3 | ||
| Conservative | William Hanbury | 1105 | 6.1 | ||
| Conservative | Paul Healey ‡ | 1091 | 6.0 | ||
| Liberal Democrats | Martin Bartlett § | 466 | 2.6 | ||
| Liberal Democrats | Carlotta Allum | 448 | 2.5 | ||
| Liberal Democrats | Aileen Hingston | 290 | 1.6 | ||
| TUSC | Amanda Robinson | 236 | 1.3 | ||
| Turnout | 69.5 | +22.4 | |||
| Independent gain from Labour | Swing | ||||
| Labour hold | Swing | ||||
| Green gain from Labour | Swing | ||||
- * Represented the Micklegate ward of City of York Council, 2007–2015 [7]
- † Represented the Bishophill ward of York City Council, 1982–1996, the Bishophill ward of City of York Council, 1995–2003, and the Micklegate ward of City of York Council, 2003–2015 [8] [7]
- ‡ Represented the Rural West York ward of City of York Council, 2007–2015 [7]
- § Represented the Holgate ward of City of York Council, 2003–2007 [7]
Osbaldwick and Derwent ward
The parishes of Dunnington, Holtby, Kexby, Murton, and Osbaldwick
| Party | Candidate | Votes | % | ± | |
|---|---|---|---|---|---|
| Conservative | Jenny Brooks * | 1,989 | 25.9 | ||
| Independent | Mark Warters † | 1,167 | 15.2 | ||
| Conservative | Robin Dickson ‡ | 1162 | 15.1 | ||
| Liberal Democrats | Rosalind Maggs | 934 | 12.2 | ||
| Labour | Callum Shannon | 684 | 8.9 | ||
| Labour | Mark Windmill | 458 | 6.0 | ||
| Liberal Democrats | Richard Hill | 421 | 5.5 | ||
| Green | Sally Brooks | 400 | 5.2 | ||
| Green | Derek Bennett | 310 | 4.0 | ||
| Turnout | 7675 | 71.5 | |||
| Conservative hold | Swing | ||||
| Independent hold | Swing | ||||
Rawcliffe and Clifton Without ward
The parishes of Clifton Without and Rawcliffe
| Party | Candidate | Votes | % | ± | |
|---|---|---|---|---|---|
| Conservative | Peter Dew | 2,325 | 13.9 | ||
| Conservative | Stuart Rawlings | 2,085 | 12.4 | ||
| Conservative | Samuel Lisle | 1,905 | 11.4 | ||
| Labour | Linsay Cunningham * | 1662 | 10.0 | ||
| Liberal Democrats | Richard Shrimpton | 1576 | 9.4 | ||
| Liberal Democrats | Mark Waudby † | 1561 | 9.3 | ||
| Labour | Neil McIlveen * | 1441 | 8.6 | ||
| Liberal Democrats | Samantha Waudby | 1407 | 8.4 | ||
| Labour | Ian Panter | 1347 | 8.0 | ||
| Green | Caroline Boreham | 556 | 3.3 | ||
| Green | Rodney Bell | 481 | 2.9 | ||
| Green | Robin Brabham | 426 | 2.5 | ||
| Turnout | 16772 | 65.5 | |||
| Conservative gain from Labour | Swing | ||||
| Conservative gain from Labour | Swing | ||||
| Conservative hold | Swing | ||||
- * Represented the Skelton, Rawcliffe, and Clifton Without ward of City of York Council, 2011–2015
- † Represented the Rawcliffe and Skelton ward of City of York Council, 1999–2003, and the Skelton, Rawcliffe, and Clifton Without ward of City of York Council, 2003–2007 [7]
Rural West York ward
The parishes of Askham Bryan, Askham Richard, Hessay, Nether Poppleton, Rufforth with Knapton, Skelton, and Upper Poppleton
| Party | Candidate | Votes | % | ± | |
|---|---|---|---|---|---|
| Conservative | Ian Gillies * | 2,428 | 28.4 | ||
| Conservative | Chris Steward † | 2,052 | 24.0 | ||
| Liberal Democrats | Jayne Bradley | 1022 | 12.0 | ||
| Labour | Paul Kind | 663 | 7.8 | ||
| Independent | Joseph Watt ‡ | 661 | 7.7 | ||
| Labour | Victoria Prior | 541 | 6.3 | ||
| Liberal Democrats | Gareth Morgan | 454 | 5.3 | ||
| Green | Sally Hind | 373 | 4.4 | ||
| Green | Gillian Cossham | 358 | 4.2 | ||
| Turnout | 8552 | 73.5 | |||
| Conservative hold | Swing | ||||
| Conservative hold | Swing | ||||
Strensall ward
The parishes of Earswick, Stockton-on-the-Forest, and Strensall with Towthorpe
| Party | Candidate | Votes | % | ± | |
|---|---|---|---|---|---|
| Conservative | Paul Doughty * | 2,385 | 29.3 | ||
| Conservative | Helen Douglas † | 1,886 | 23.1 | ||
| Liberal Democrats | Tony Fisher ‡ | 1369 | 16.8 | ||
| Liberal Democrats | David Goodall | 775 | 9.5 | ||
| Labour | Ann Moxon | 605 | 7.4 | ||
| Labour | John Gorner | 574 | 7.0 | ||
| Green | Robbie Bennett | 314 | 3.9 | ||
| Green | Matthew Durrant | 245 | 3.0 | ||
| Turnout | 8153 | 67.4 | +25.2 | ||
| Conservative hold | Swing | ||||
| Conservative hold | Swing | ||||
Westfield ward
| Party | Candidate | Votes | % | ± | |
|---|---|---|---|---|---|
| Liberal Democrats | Andrew Waller * | 2,866 | 18.2 | ||
| Liberal Democrats | Susan Hunter | 2,369 | 15.0 | ||
| Liberal Democrats | Sheena Jackson | 2,106 | 13.7 | ||
| Labour | Louise Corson | 1564 | 9.9 | ||
| Labour | Stephen Burton † | 1464 | 9.3 | ||
| Labour | Reece Goscinski | 1185 | 7.5 | ||
| Conservative | Andrew Brooks | 784 | 5.0 | ||
| Conservative | Victoria Donnor | 770 | 4.9 | ||
| Conservative | Helen Steward | 655 | 4.2 | ||
| Green | Alison Webb | 650 | 4.1 | ||
| Green | Catherine Heinemeyer | 575 | 3.6 | ||
| Green | Sebastian Butterworth | 545 | 3.5 | ||
| TUSC | John Handforth | 224 | 1.4 | ||
| Turnout | 15757 | 58.5 | +20.5 | ||
| Liberal Democrats gain from Labour | Swing | ||||
| Liberal Democrats gain from Labour | Swing | ||||
| Liberal Democrats gain from Labour | Swing | ||||
Wheldrake ward
The parishes of Deighton, Elvington, Naburn, and Wheldrake
| Party | Candidate | Votes | % | ± | |
|---|---|---|---|---|---|
| Conservative | Susan Mercer | 1,638 | 64.1 | +7.9 | |
| Labour | Caroline Hind | 405 | 15.8 | +2.2 | |
| Liberal Democrats | Jonathan Stott | 281 | 11.0 | -15.5 | |
| Green | William Dyson | 232 | 9.1% | +5.3 | |
| Turnout | 2556 | 76.4 | +22.8 | ||
| Conservative hold | Swing | ||||
References
- "Upcoming elections & referendums". The Electoral Commission. Archived from the original on 15 March 2015. Retrieved 5 April 2015.
- "Senior figures in York lose council seats". BBC News. 9 May 2015. Archived from the original on 12 May 2015. Retrieved 11 April 2016.
- Aitchison, Gavin (9 May 2015). "22 fresh faces bring hope of a new era at York council". York Press. Archived from the original on 11 April 2016. Retrieved 11 April 2016.
- Aitchison, Gavin (18 May 2015). "Tories & Lib Dems to run York - Chris Steward to be leader - Labour ousted - First policies revealed". York Press. Archived from the original on 22 July 2015. Retrieved 11 April 2016.
- City of York Council. "Local election results May 2015". Archived from the original on 30 June 2015. Retrieved 27 June 2015.
- "Council election results\". York Press. 2015. Retrieved 16 February 2018.
- Rallings, Colin; Thrasher, Michael (2015). "City of York Council election results 1995-2011" (PDF). The Elections Centre, Nuffield College, Oxford.
- Rallings, Colin; Thrasher, Michael (2015). "York City Council election results 1973-1994" (PDF). The Elections Centre, Nuffield College, Oxford.
- Rallings, Colin; Thrasher, Michael (2015). "North Yorkshire County Council election results 1973-2009" (PDF). The Elections Centre, Nuffield College, Oxford.
- Rallings, Colin; Thrasher, Michael (2015). "Ryedale District Council election results 1973-2011" (PDF). The Elections Centre, Nuffield College, Oxford.