2001–02 Football League
The 2001–02 Football League (known as the Nationwide Football League for sponsorship reasons) was the 103rd completed season of The Football League.
| Season | 2001–02 |
|---|---|
| Champions | Manchester City |
| Promoted | Manchester City West Bromwich Albion Birmingham City |
| Relegated | Halifax Town |
| New Team in League | Rushden & Diamonds |
← 2000–01 2002–03 → | |
Final league tables and results
The tables and results below are reproduced here in the exact form that they can be found at The Rec.Sport.Soccer Statistics Foundation website,[1] with home and away statistics separated. Play-off results are from the same website.
First Division
| Season | 2001–02 |
|---|---|
| Champions | Manchester City (7th second tier title) |
| Direct promotion to FA Premier League | Manchester City, West Bromwich Albion |
| Promoted to FA Premier League through play-offs | Birmingham City |
| Relegated | Barnsley, Crewe Alexandra Stockport County, |
| Matches played | 552 |
| Goals scored | 1,485 (2.69 per match) |
| Top goalscorer | Shaun Goater (Manchester City), 28 [2] |
← 2000–01 2002–03 → | |
| Pos | Team | Pld | HW | HD | HL | HGF | HGA | AW | AD | AL | AGF | AGA | GD | Pts | Promotion or relegation |
|---|---|---|---|---|---|---|---|---|---|---|---|---|---|---|---|
| 1 | Manchester City | 46 | 19 | 3 | 1 | 63 | 19 | 12 | 3 | 8 | 45 | 33 | +56 | 99 | Football League Champions, promoted to FA Premier League |
| 2 | West Bromwich Albion | 46 | 15 | 4 | 4 | 36 | 11 | 12 | 4 | 7 | 25 | 18 | +32 | 89 | Promoted to FA Premier League |
| 3 | Wolverhampton Wanderers | 46 | 13 | 4 | 6 | 33 | 18 | 12 | 7 | 4 | 43 | 25 | +33 | 86 | Participated in play-offs |
| 4 | Millwall | 46 | 15 | 3 | 5 | 43 | 22 | 7 | 8 | 8 | 26 | 26 | +21 | 77 | |
| 5 | Birmingham City | 46 | 14 | 4 | 5 | 44 | 20 | 7 | 9 | 7 | 26 | 29 | +21 | 76 | Promoted to Premier League through play-offs |
| 6 | Norwich City | 46 | 15 | 6 | 2 | 36 | 16 | 7 | 3 | 13 | 24 | 35 | +9 | 75 | Participated in play-offs |
| 7 | Burnley | 46 | 11 | 7 | 5 | 39 | 29 | 10 | 5 | 8 | 31 | 33 | +8 | 75 | |
| 8 | Preston North End | 46 | 13 | 7 | 3 | 45 | 21 | 7 | 5 | 11 | 26 | 38 | +12 | 72 | |
| 9 | Wimbledon | 46 | 9 | 8 | 6 | 30 | 22 | 9 | 5 | 9 | 33 | 35 | +6 | 67 | |
| 10 | Crystal Palace | 46 | 13 | 3 | 7 | 42 | 22 | 7 | 3 | 13 | 28 | 40 | +8 | 66 | |
| 11 | Coventry City | 46 | 12 | 4 | 7 | 33 | 19 | 8 | 2 | 13 | 26 | 34 | +6 | 66 | |
| 12 | Gillingham | 46 | 12 | 5 | 6 | 38 | 26 | 6 | 5 | 12 | 26 | 41 | −3 | 64 | |
| 13 | Sheffield United | 46 | 8 | 8 | 7 | 34 | 30 | 7 | 7 | 9 | 19 | 24 | −1 | 60 | |
| 14 | Watford | 46 | 10 | 5 | 8 | 38 | 30 | 6 | 6 | 11 | 24 | 26 | +6 | 59 | |
| 15 | Bradford City | 46 | 10 | 1 | 12 | 41 | 39 | 5 | 9 | 9 | 28 | 37 | −7 | 55 | |
| 16 | Nottingham Forest | 46 | 7 | 11 | 5 | 26 | 21 | 5 | 7 | 11 | 24 | 30 | −1 | 54 | |
| 17 | Portsmouth | 46 | 9 | 6 | 8 | 36 | 31 | 4 | 8 | 11 | 24 | 41 | −12 | 53 | |
| 18 | Walsall | 46 | 10 | 6 | 7 | 29 | 27 | 3 | 6 | 14 | 22 | 44 | −20 | 51 | |
| 19 | Grimsby Town | 46 | 9 | 7 | 7 | 34 | 28 | 3 | 7 | 13 | 16 | 44 | −22 | 50 | |
| 20 | Sheffield Wednesday | 46 | 6 | 7 | 10 | 28 | 37 | 6 | 7 | 10 | 21 | 34 | −22 | 50 | |
| 21 | Rotherham United | 46 | 7 | 13 | 3 | 32 | 29 | 3 | 6 | 14 | 20 | 37 | −14 | 49 | |
| 22 | Crewe Alexandra | 46 | 8 | 8 | 7 | 23 | 32 | 4 | 5 | 14 | 24 | 44 | −29 | 49 | Relegated |
| 23 | Barnsley | 46 | 9 | 9 | 5 | 37 | 33 | 2 | 6 | 15 | 22 | 53 | −27 | 48 | |
| 24 | Stockport County | 46 | 5 | 1 | 17 | 19 | 44 | 1 | 7 | 15 | 23 | 58 | −60 | 26 |
Source:
Rules for classification: In the Football League goals scored (GF) takes precedence over goal difference (GD).
Rules for classification: In the Football League goals scored (GF) takes precedence over goal difference (GD).
Play-offs
| Semifinals 1st leg –Apr 28th; 2nd leg –May 1st/2nd, 2002 |
Final at Millennium Stadium, Cardiff May 12th, 2002 | |||||||||
| 3rd | Wolverhampton Wanderers | 1 | 1 | 2 | ||||||
| 6th | Norwich City | 3 | 0 | 3 | ||||||
| 5th | Birmingham City (pen.) | 1 (4) | ||||||||
| 6th | Norwich City | 1 (2) | ||||||||
| 4th | Millwall | 1 | 0 | 1 | ||||||
| 5th | Birmingham City | 1 | 1 | 2 | ||||||
First Division maps
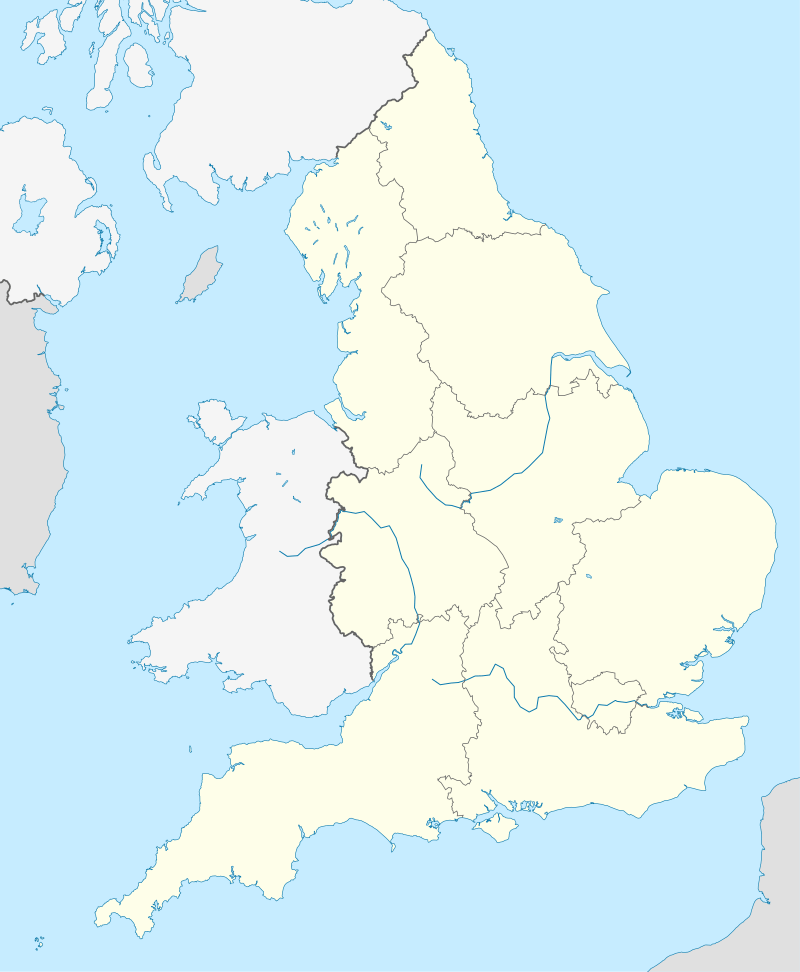
Locations of the Football League First Division 2001–2002 teams
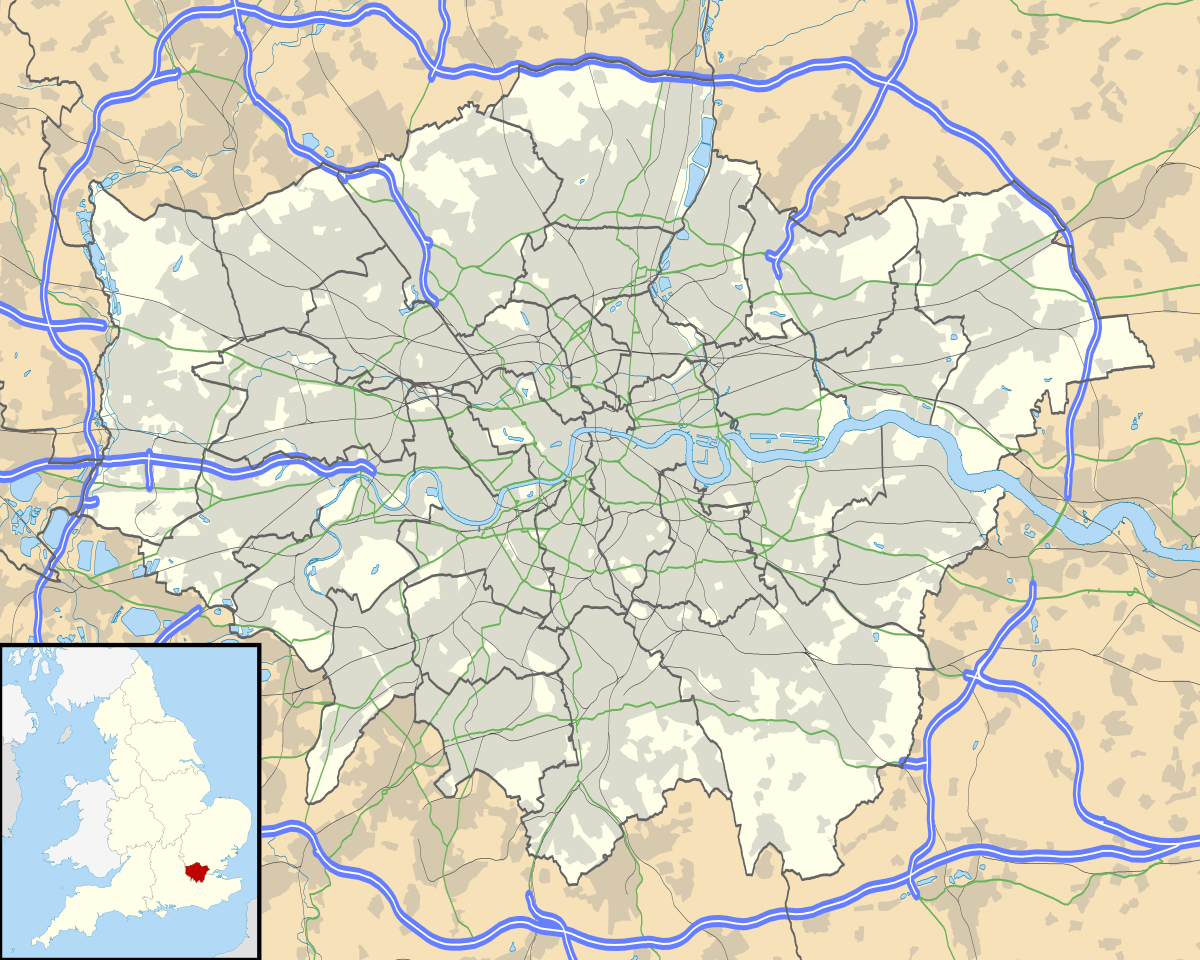
Locations of the Football League First Division London teams 2001–2002
Second Division
| Season | 2001–02 |
|---|---|
| Champions | Brighton & Hove Albion (1st third tier title, and second successive division championship) |
| Direct promotion | Brighton & Hove Albion, Reading |
| Promoted through play-offs | Stoke City |
| Relegated | Bournemouth, Bury, Cambridge United, Wrexham |
| Matches played | 552 |
| Goals scored | 1,472 (2.67 per match) |
| Top goalscorer | Bobby Zamora (Brighton & Hove Albion), 28 [2] |
← 2000–01 2002–03 → | |
| Pos | Team | Pld | HW | HD | HL | HGF | HGA | AW | AD | AL | AGF | AGA | GD | Pts | Promotion or relegation |
|---|---|---|---|---|---|---|---|---|---|---|---|---|---|---|---|
| 1 | Brighton & Hove Albion | 46 | 17 | 5 | 1 | 42 | 16 | 8 | 10 | 5 | 24 | 26 | +24 | 90 | Division Champions, promoted |
| 2 | Reading | 46 | 12 | 7 | 4 | 36 | 20 | 11 | 8 | 4 | 34 | 23 | +27 | 84 | Promoted |
| 3 | Brentford | 46 | 17 | 5 | 1 | 48 | 12 | 7 | 6 | 10 | 29 | 31 | +34 | 83 | Participated in play-offs |
| 4 | Cardiff City | 46 | 12 | 8 | 3 | 39 | 25 | 11 | 6 | 6 | 36 | 25 | +25 | 83 | |
| 5 | Stoke City | 46 | 16 | 4 | 3 | 43 | 12 | 7 | 7 | 9 | 24 | 28 | +27 | 80 | Promoted through play-offs |
| 6 | Huddersfield Town | 46 | 13 | 7 | 3 | 35 | 19 | 8 | 8 | 7 | 30 | 28 | +18 | 78 | Participated in play-offs |
| 7 | Bristol City | 46 | 13 | 6 | 4 | 38 | 21 | 8 | 4 | 11 | 30 | 32 | +15 | 73 | |
| 8 | Queens Park Rangers | 46 | 11 | 10 | 2 | 35 | 18 | 8 | 4 | 11 | 25 | 31 | +11 | 71 | |
| 9 | Oldham Athletic | 46 | 14 | 6 | 3 | 47 | 27 | 4 | 10 | 9 | 30 | 38 | +12 | 70 | |
| 10 | Wigan Athletic | 46 | 9 | 6 | 8 | 36 | 23 | 7 | 10 | 6 | 30 | 28 | +15 | 64 | |
| 11 | Wycombe Wanderers | 46 | 13 | 5 | 5 | 38 | 26 | 4 | 8 | 11 | 20 | 38 | −6 | 64 | |
| 12 | Tranmere Rovers | 46 | 10 | 9 | 4 | 39 | 19 | 6 | 6 | 11 | 24 | 41 | +3 | 63 | |
| 13 | Swindon Town | 46 | 10 | 7 | 6 | 26 | 21 | 5 | 7 | 11 | 20 | 35 | −10 | 59 | |
| 14 | Port Vale | 46 | 11 | 6 | 6 | 35 | 24 | 5 | 4 | 14 | 16 | 38 | −11 | 58 | |
| 15 | Colchester United | 46 | 9 | 6 | 8 | 35 | 33 | 6 | 6 | 11 | 30 | 43 | −11 | 57 | |
| 16 | Blackpool | 46 | 8 | 9 | 6 | 39 | 31 | 6 | 5 | 12 | 27 | 38 | −3 | 56 | |
| 17 | Peterborough United | 46 | 11 | 5 | 7 | 46 | 26 | 4 | 5 | 14 | 18 | 33 | +5 | 55 | |
| 18 | Chesterfield | 46 | 9 | 3 | 11 | 35 | 36 | 4 | 10 | 9 | 18 | 29 | −12 | 52 | |
| 19 | Notts County | 46 | 8 | 7 | 8 | 28 | 29 | 5 | 4 | 14 | 31 | 42 | −12 | 50 | |
| 20 | Northampton Town | 46 | 9 | 4 | 10 | 30 | 33 | 5 | 3 | 15 | 24 | 46 | −25 | 49 | |
| 21 | Bournemouth | 46 | 9 | 4 | 10 | 36 | 33 | 1 | 10 | 12 | 20 | 38 | −15 | 44 | Relegated |
| 22 | Bury | 46 | 6 | 9 | 8 | 26 | 32 | 5 | 2 | 16 | 17 | 43 | −32 | 44 | |
| 23 | Wrexham | 46 | 7 | 7 | 9 | 29 | 32 | 4 | 3 | 16 | 27 | 57 | −33 | 43 | |
| 24 | Cambridge United | 46 | 7 | 7 | 9 | 29 | 34 | 0 | 6 | 17 | 18 | 59 | −46 | 34 |
Source:
Rules for classification: In the Football League goals scored (GF) takes precedence over goal difference (GD).
Rules for classification: In the Football League goals scored (GF) takes precedence over goal difference (GD).
Play-offs
| Semifinals 1st leg –Apr 28th; 2nd leg –May 1st, 2002 |
Final at Millennium Stadium, Cardiff May 11th, 2002 | |||||||||
| 3rd | Brentford | 0 | 2 | 2 | ||||||
| 6th | Huddersfield Town | 0 | 1 | 1 | ||||||
| 3rd | Brentford | 0 | ||||||||
| 5th | Stoke City | 2 | ||||||||
| 4th | Cardiff City | 2 | 0 | 2 | ||||||
| 5th | Stoke City | 1 | 2 | 3 | ||||||
Second Division maps
Locations of the Football League Second Division 2001–2002 teams
Locations of the Football League Second Division London teams 2001–2002
Third Division
| Season | 2001–02 |
|---|---|
| Champions | Plymouth Argyle (1st fourth tier title) |
| Direct promotion | Plymouth Argyle, Luton Town, Mansfield Town |
| Promoted through play-offs | Cheltenham Town |
| Relegated to Conference | Halifax Town |
| New club in the league | Rushden & Diamonds |
| Matches played | 552 |
| Goals scored | 1,397 (2.53 per match) |
| Top goalscorer | Steve Howard (Luton Town), 24 [2] |
← 2000–01 2002–03 → | |
| Pos | Team | Pld | HW | HD | HL | HGF | HGA | AW | AD | AL | AGF | AGA | GD | Pts | Promotion or relegation |
|---|---|---|---|---|---|---|---|---|---|---|---|---|---|---|---|
| 1 | Plymouth Argyle | 46 | 19 | 2 | 2 | 41 | 11 | 12 | 7 | 4 | 30 | 17 | +43 | 102 | Division Champions, promoted |
| 2 | Luton Town | 46 | 15 | 5 | 3 | 50 | 18 | 15 | 2 | 6 | 46 | 30 | +48 | 97 | Promoted |
| 3 | Mansfield Town | 46 | 17 | 3 | 3 | 49 | 24 | 7 | 4 | 12 | 23 | 36 | +12 | 79 | |
| 4 | Cheltenham Town | 46 | 11 | 11 | 1 | 40 | 20 | 10 | 4 | 9 | 26 | 29 | +17 | 78 | Promoted through play-offs |
| 5 | Rochdale | 46 | 13 | 8 | 2 | 41 | 22 | 8 | 7 | 8 | 24 | 30 | +13 | 78 | Participated in play-offs |
| 6 | Rushden & Diamonds[lower-alpha 1] | 46 | 14 | 5 | 4 | 40 | 20 | 6 | 8 | 9 | 29 | 33 | +16 | 73 | |
| 7 | Hartlepool United | 46 | 12 | 6 | 5 | 53 | 23 | 8 | 5 | 10 | 21 | 25 | +26 | 71 | |
| 8 | Scunthorpe United | 46 | 14 | 5 | 4 | 43 | 22 | 5 | 9 | 9 | 31 | 34 | +18 | 71 | |
| 9 | Shrewsbury Town | 46 | 13 | 4 | 6 | 36 | 19 | 7 | 6 | 10 | 28 | 34 | +11 | 70 | |
| 10 | Kidderminster Harriers | 46 | 13 | 6 | 4 | 35 | 17 | 6 | 3 | 14 | 21 | 30 | +9 | 66 | |
| 11 | Hull City | 46 | 12 | 6 | 5 | 38 | 18 | 4 | 7 | 12 | 19 | 33 | +6 | 61 | |
| 12 | Southend United | 46 | 12 | 5 | 6 | 36 | 22 | 3 | 8 | 12 | 15 | 32 | −3 | 58 | |
| 13 | Macclesfield Town | 46 | 7 | 7 | 9 | 23 | 25 | 8 | 6 | 9 | 18 | 27 | −11 | 58 | |
| 14 | York City | 46 | 11 | 5 | 7 | 26 | 20 | 5 | 4 | 14 | 28 | 47 | −13 | 57 | |
| 15 | Darlington | 46 | 11 | 6 | 6 | 37 | 25 | 4 | 5 | 14 | 23 | 46 | −11 | 56 | |
| 16 | Exeter City | 46 | 7 | 9 | 7 | 25 | 32 | 7 | 4 | 12 | 23 | 41 | −25 | 55 | |
| 17 | Carlisle United | 46 | 11 | 5 | 7 | 31 | 21 | 1 | 11 | 11 | 18 | 35 | −7 | 52 | |
| 18 | Leyton Orient | 46 | 10 | 7 | 6 | 37 | 25 | 3 | 6 | 14 | 18 | 46 | −16 | 52 | |
| 19 | Torquay United | 46 | 8 | 6 | 9 | 27 | 31 | 4 | 9 | 10 | 19 | 32 | −17 | 51 | |
| 20 | Swansea City | 46 | 7 | 8 | 8 | 26 | 26 | 6 | 4 | 13 | 27 | 51 | −24 | 51 | |
| 21 | Oxford United | 46 | 8 | 7 | 8 | 34 | 28 | 3 | 7 | 13 | 19 | 34 | −9 | 47 | |
| 22 | Lincoln City | 46 | 8 | 4 | 11 | 25 | 27 | 2 | 12 | 9 | 19 | 35 | −18 | 46 | |
| 23 | Bristol Rovers | 46 | 8 | 7 | 8 | 28 | 28 | 3 | 5 | 15 | 12 | 32 | −20 | 45 | |
| 24 | Halifax Town | 46 | 5 | 9 | 9 | 24 | 28 | 3 | 3 | 17 | 15 | 56 | −45 | 36 | Relegated to Conference |
Source:
Rules for classification: In the Football League goals scored (GF) takes precedence over goal difference (GD).
Notes:
Rules for classification: In the Football League goals scored (GF) takes precedence over goal difference (GD).
Notes:
- New club in the league
Play-offs
| Semifinals 1st leg –Apr 27th; 2nd leg –Apr 30th, 2002 |
Final at Millennium Stadium, Cardiff May 6th, 2002 | |||||||||
| 4th | Cheltenham Town (pens.) | 1 | 1 | 2 (5) | ||||||
| 7th | Hartlepool United | 1 | 1 | 2 (4) | ||||||
| 4th | Cheltenham Town | 3 | ||||||||
| 6th | Rushden & Diamonds | 1 | ||||||||
| 5th | Rochdale | 2 | 1 | 3 | ||||||
| 6th | Rushden & Diamonds | 2 | 2 | 4 | ||||||
Third Division maps
Kidderminster Harriers
Locations of the Football League Third Division teams 2001–2002
References
- "England 2001–02". Rec.Sport.Soccer Statistics Foundation. Archived from the original on 24 January 2010. Retrieved 2010-02-24.
- "English League Leading Goalscorers". RSSSF. Retrieved 2010-10-31.
This article is issued from Wikipedia. The text is licensed under Creative Commons - Attribution - Sharealike. Additional terms may apply for the media files.