1995–96 Football League
The 1995-1996 Football League season was the 97th completed season of The Football League. It was contested through three divisions, the First Division, Second Division and Third Division.[1]
| Season | 1995–96 |
|---|---|
| Champions | Sunderland |
| Promoted | Sunderland Derby County |
← 1994–95 1996–97 → | |
First Division
| Season | 1995–96 |
|---|---|
| Champions | Sunderland (2nd second tier title) |
| Direct promotion to FA Premier League | Sunderland, Derby County |
| Promoted to FA Premier League through play-offs | Leicester City |
| Relegated | Luton Town, Millwall, Watford |
| Matches played | 552 |
| Goals scored | 1,417 (2.57 per match) |
| Top goalscorer | John Aldridge (Tranmere Rovers), 27 [2] |
| Biggest home win | Sunderland 6–0 Millwall |
| Biggest away win | Barnsley 0–5 Birmingham City |
| Highest scoring | Watford 6–3 Reading |
← 1994–95 1996–97 → | |
| Pos | Team | Pld | HW | HD | HL | HGF | HGA | AW | AD | AL | AGF | AGA | GD | Pts | Promotion or relegation |
|---|---|---|---|---|---|---|---|---|---|---|---|---|---|---|---|
| 1 | Sunderland | 46 | 13 | 8 | 2 | 32 | 10 | 9 | 9 | 5 | 27 | 23 | +26 | 83 | Football League Champions, promoted to FA Premier League |
| 2 | Derby County | 46 | 14 | 8 | 1 | 48 | 22 | 7 | 8 | 8 | 23 | 29 | +20 | 79 | Promoted to FA Premier League |
| 3 | Crystal Palace | 46 | 9 | 9 | 5 | 34 | 22 | 11 | 6 | 6 | 33 | 26 | +19 | 75 | Participated in play-offs |
| 4 | Stoke City | 46 | 13 | 6 | 4 | 32 | 15 | 7 | 7 | 9 | 28 | 34 | +11 | 73 | |
| 5 | Leicester City | 46 | 9 | 7 | 7 | 32 | 29 | 10 | 7 | 6 | 34 | 31 | +6 | 71 | Promoted to Premier League through play-offs |
| 6 | Charlton Athletic | 46 | 8 | 11 | 4 | 28 | 23 | 9 | 9 | 5 | 29 | 22 | +12 | 71 | Participated in play-offs |
| 7 | Ipswich Town | 46 | 13 | 5 | 5 | 45 | 30 | 6 | 7 | 10 | 34 | 39 | +10 | 69 | |
| 8 | Huddersfield Town | 46 | 14 | 4 | 5 | 42 | 23 | 3 | 8 | 12 | 19 | 35 | +3 | 63 | |
| 9 | Sheffield United | 46 | 9 | 7 | 7 | 29 | 25 | 7 | 7 | 9 | 28 | 29 | +3 | 62 | |
| 10 | Barnsley | 46 | 9 | 10 | 4 | 34 | 28 | 5 | 8 | 10 | 26 | 38 | −6 | 60 | |
| 11 | West Bromwich Albion | 46 | 11 | 5 | 7 | 34 | 29 | 5 | 7 | 11 | 26 | 39 | −8 | 60 | |
| 12 | Port Vale | 46 | 10 | 5 | 8 | 30 | 29 | 5 | 10 | 8 | 29 | 37 | −7 | 60 | |
| 13 | Tranmere Rovers | 46 | 9 | 9 | 5 | 42 | 29 | 5 | 8 | 10 | 22 | 31 | +4 | 59 | |
| 14 | Southend United | 46 | 11 | 8 | 4 | 30 | 22 | 4 | 6 | 13 | 22 | 39 | −9 | 59 | |
| 15 | Birmingham City | 46 | 11 | 7 | 5 | 37 | 23 | 4 | 6 | 13 | 24 | 41 | −3 | 58 | |
| 16 | Norwich City | 46 | 7 | 9 | 7 | 26 | 24 | 7 | 6 | 10 | 33 | 31 | +4 | 57 | |
| 17 | Grimsby Town | 46 | 8 | 10 | 5 | 27 | 25 | 6 | 4 | 13 | 28 | 44 | −14 | 56 | |
| 18 | Oldham Athletic | 46 | 10 | 7 | 6 | 33 | 20 | 4 | 7 | 12 | 21 | 30 | +4 | 56 | |
| 19 | Reading | 46 | 8 | 7 | 8 | 28 | 30 | 5 | 10 | 8 | 26 | 33 | −9 | 56 | |
| 20 | Wolverhampton Wanderers | 46 | 8 | 9 | 6 | 34 | 28 | 5 | 7 | 11 | 22 | 34 | −6 | 55 | |
| 21 | Portsmouth | 46 | 8 | 6 | 9 | 34 | 32 | 5 | 7 | 11 | 27 | 37 | −8 | 52 | |
| 22 | Millwall | 46 | 7 | 6 | 10 | 23 | 28 | 6 | 7 | 10 | 20 | 35 | −20 | 52 | Relegated |
| 23 | Watford | 46 | 7 | 8 | 8 | 40 | 33 | 3 | 10 | 10 | 22 | 37 | −8 | 48 | |
| 24 | Luton Town | 46 | 7 | 6 | 10 | 30 | 34 | 4 | 6 | 13 | 10 | 30 | −24 | 45 |
Source:
Play-offs
| Semifinals 1st leg – May 12th; 2nd leg – May 15th, 1996 |
Final at Wembley May 27th, 1996 | |||||||||
| 3rd | Crystal Palace | 2 | 1 | 3 | ||||||
| 6th | Charlton Athletic | 1 | 0 | 1 | ||||||
| 3rd | Crystal Palace | 1 | ||||||||
| 5th | Leicester City (a.e.t.) | 2 | ||||||||
| 4th | Stoke City | 0 | 0 | 0 | ||||||
| 5th | Leicester City | 0 | 1 | 1 | ||||||
Results
Top scorers
| Rank | Player | Club | Goals |
|---|---|---|---|
| 1 | Tranmere Rovers | 26 | |
| 2 | Crystal Palace | 20 | |
| = | Derby County | 20 | |
| 4 | Ipswich Town | 19 | |
| = | Leicester City | 19 | |
| 6 | Ipswich Town | 18 | |
| 7 | Barnsley | 17 | |
| = | West Bromwich Albion | 17 |
Locations
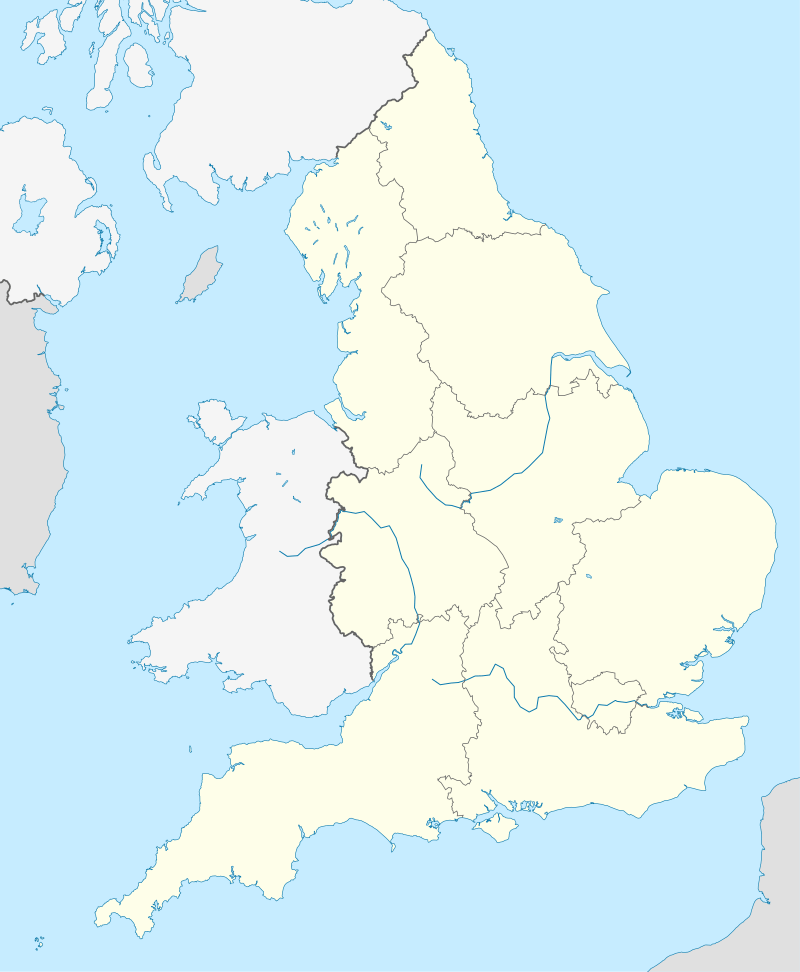
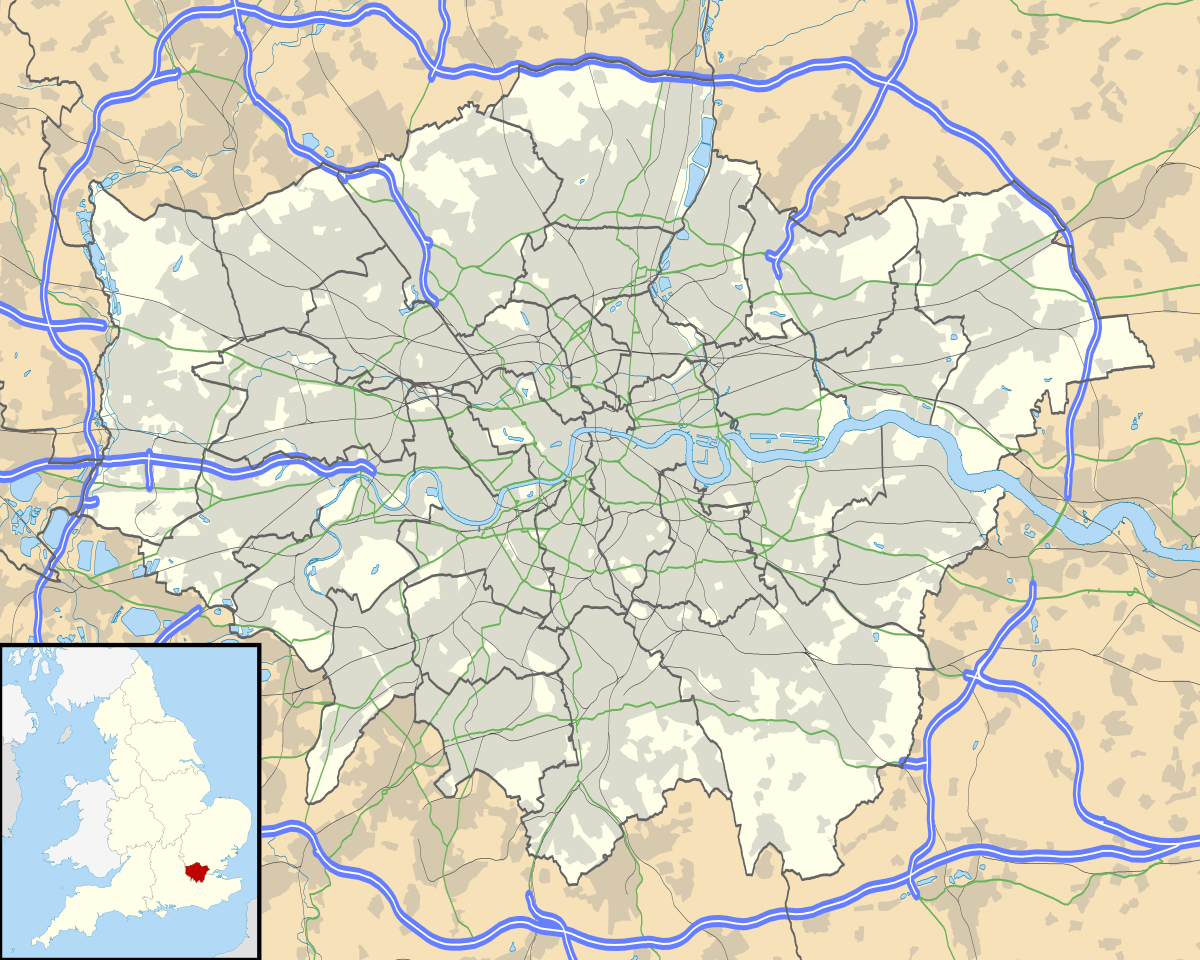
Locations of the First Division London teams
Second Division
| Season | 1995–96 |
|---|---|
| Champions | Swindon Town (1st third tier title) |
| Direct promotion | Swindon Town, Oxford United |
| Promoted through play-offs | Bradford City |
| Relegated | Brighton & Hove Albion, Carlisle United, Hull City, Swansea City |
| Matches played | 552 |
| Goals scored | 1,414 (2.56 per match) |
| Top goalscorer | Marcus Stewart (Bristol Rovers), 21; Gary Martindale (Peterborough United/ Notts County), 21 [2] |
← 1994–95 1996–97 → | |
| Pos | Team | Pld | HW | HD | HL | HGF | HGA | AW | AD | AL | AGF | AGA | GD | Pts | Promotion or relegation |
|---|---|---|---|---|---|---|---|---|---|---|---|---|---|---|---|
| 1 | Swindon Town | 46 | 12 | 10 | 1 | 37 | 16 | 13 | 7 | 3 | 34 | 18 | +37 | 92 | Division Champions, promoted |
| 2 | Oxford United | 46 | 17 | 4 | 2 | 52 | 14 | 7 | 7 | 9 | 24 | 25 | +37 | 83 | Promoted |
| 3 | Blackpool | 46 | 14 | 5 | 4 | 41 | 20 | 9 | 8 | 6 | 26 | 20 | +27 | 82 | Participated in play-offs |
| 4 | Notts County | 46 | 14 | 6 | 3 | 42 | 21 | 7 | 9 | 7 | 21 | 18 | +24 | 78 | |
| 5 | Crewe Alexandra | 46 | 13 | 3 | 7 | 40 | 24 | 9 | 4 | 10 | 37 | 36 | +17 | 73 | |
| 6 | Bradford City | 46 | 15 | 4 | 4 | 41 | 25 | 7 | 3 | 13 | 30 | 44 | +2 | 73 | Promoted through play-offs |
| 7 | Chesterfield | 46 | 14 | 6 | 3 | 39 | 21 | 6 | 6 | 11 | 17 | 30 | +5 | 72 | |
| 8 | Wrexham | 46 | 12 | 6 | 5 | 51 | 27 | 6 | 10 | 7 | 25 | 28 | +21 | 70 | |
| 9 | Stockport County | 46 | 8 | 9 | 6 | 30 | 20 | 11 | 4 | 8 | 31 | 27 | +14 | 70 | |
| 10 | Bristol Rovers | 46 | 12 | 4 | 7 | 29 | 28 | 8 | 6 | 9 | 28 | 32 | −3 | 70 | |
| 11 | Walsall | 46 | 12 | 7 | 4 | 38 | 20 | 7 | 5 | 11 | 22 | 25 | +15 | 69 | |
| 12 | Wycombe Wanderers | 46 | 9 | 8 | 6 | 36 | 26 | 6 | 7 | 10 | 27 | 33 | +4 | 60 | |
| 13 | Bristol City | 46 | 10 | 6 | 7 | 28 | 22 | 5 | 9 | 9 | 27 | 38 | −5 | 60 | |
| 14 | Bournemouth | 46 | 12 | 5 | 6 | 33 | 25 | 4 | 5 | 14 | 18 | 45 | −19 | 58 | |
| 15 | Brentford | 46 | 12 | 6 | 5 | 24 | 15 | 3 | 7 | 13 | 19 | 34 | −6 | 58 | |
| 16 | Rotherham United | 46 | 11 | 7 | 5 | 31 | 20 | 3 | 7 | 13 | 23 | 42 | −8 | 56 | |
| 17 | Burnley | 46 | 9 | 8 | 6 | 35 | 28 | 5 | 5 | 13 | 21 | 40 | −12 | 55 | |
| 18 | Shrewsbury Town | 46 | 7 | 8 | 8 | 32 | 29 | 6 | 6 | 11 | 26 | 41 | −12 | 53 | |
| 19 | Peterborough United | 46 | 9 | 6 | 8 | 40 | 27 | 4 | 7 | 12 | 19 | 39 | −7 | 52 | |
| 20 | York City | 46 | 8 | 6 | 9 | 28 | 29 | 5 | 7 | 11 | 30 | 44 | −15 | 52 | |
| 21 | Carlisle United | 46 | 11 | 6 | 6 | 35 | 20 | 1 | 7 | 15 | 22 | 52 | −15 | 49 | Relegated |
| 22 | Swansea City | 46 | 8 | 8 | 7 | 27 | 29 | 3 | 6 | 14 | 16 | 50 | −36 | 47 | |
| 23 | Brighton & Hove Albion | 46 | 6 | 7 | 10 | 25 | 31 | 4 | 3 | 16 | 21 | 38 | −23 | 40 | |
| 24 | Hull City | 46 | 4 | 8 | 11 | 26 | 37 | 1 | 8 | 14 | 10 | 41 | −42 | 31 |
Source:
Play-offs
| Semifinals 1st leg –May 12th; 2nd leg –May 15th, 1996 |
Final at Wembley Stadium May 26th, 1996 | |||||||||
| 3rd | Blackpool | 2 | 0 | 2 | ||||||
| 6th | Bradford City | 0 | 3 | 3 | ||||||
| 4th | Notts County | 0 | ||||||||
| 6th | Bradford City | 2 | ||||||||
| 4th | Notts County | 2 | 1 | 3 | ||||||
| 5th | Crewe Alexandra | 2 | 0 | 2 | ||||||
Results
Top scorers
| Rank | Player | Club(s) | Goals |
|---|---|---|---|
| 1 | Bristol Rovers | 21 | |
| = | Peterborough United Notts County | 21 |
Third Division
| Season | 1995–96 |
|---|---|
| Champions | Preston North End (1st fourth tier title) |
| Direct promotion | Preston North End, Bury, Gillingham |
| Promoted through play-offs | Plymouth Argyle |
| Relegated to Conference | None |
| Matches played | 552 |
| Goals scored | 1,346 (2.44 per match) |
| Top goalscorer | Steve White (Hereford United), 29 Andy Saville (Preston North End), 29 [2] |
← 1994–95 1996–97 → | |
| Pos | Team | Pld | HW | HD | HL | HGF | HGA | AW | AD | AL | AGF | AGA | GD | Pts | Promotion |
|---|---|---|---|---|---|---|---|---|---|---|---|---|---|---|---|
| 1 | Preston North End | 46 | 11 | 8 | 4 | 44 | 22 | 12 | 9 | 2 | 34 | 16 | +40 | 86 | Division Champions, promoted |
| 2 | Gillingham | 46 | 16 | 6 | 1 | 33 | 6 | 6 | 11 | 6 | 16 | 14 | +29 | 83 | Promoted |
| 3 | Bury | 46 | 11 | 6 | 6 | 33 | 21 | 11 | 7 | 5 | 33 | 27 | +18 | 79 | |
| 4 | Plymouth Argyle | 46 | 14 | 5 | 4 | 41 | 20 | 8 | 7 | 8 | 27 | 29 | +19 | 78 | Promoted through play-offs |
| 5 | Darlington | 46 | 10 | 6 | 7 | 30 | 21 | 10 | 12 | 1 | 30 | 21 | +18 | 78 | Participated in play-offs |
| 6 | Hereford United | 46 | 13 | 5 | 5 | 40 | 22 | 7 | 9 | 7 | 25 | 25 | +18 | 74 | |
| 7 | Colchester United | 46 | 13 | 7 | 3 | 37 | 22 | 5 | 11 | 7 | 24 | 29 | +10 | 72 | |
| 8 | Barnet | 46 | 13 | 6 | 4 | 40 | 19 | 5 | 10 | 8 | 25 | 26 | +20 | 70 | |
| 9 | Chester City | 46 | 11 | 9 | 3 | 45 | 22 | 7 | 7 | 9 | 27 | 31 | +19 | 70 | |
| 10 | Wigan Athletic | 46 | 15 | 3 | 5 | 36 | 21 | 5 | 7 | 11 | 26 | 35 | +6 | 70 | |
| 11 | Northampton Town | 46 | 9 | 10 | 4 | 32 | 22 | 9 | 3 | 11 | 19 | 22 | +7 | 67 | |
| 12 | Scunthorpe United | 46 | 8 | 8 | 7 | 36 | 30 | 7 | 7 | 9 | 31 | 31 | +6 | 60 | |
| 13 | Doncaster Rovers | 46 | 11 | 6 | 6 | 25 | 19 | 5 | 5 | 13 | 24 | 41 | −11 | 59 | |
| 14 | Exeter City | 46 | 9 | 9 | 5 | 25 | 22 | 4 | 9 | 10 | 21 | 31 | −7 | 57 | |
| 15 | Rochdale | 46 | 7 | 8 | 8 | 32 | 33 | 7 | 5 | 11 | 25 | 28 | −4 | 55 | |
| 16 | Cambridge United | 46 | 8 | 8 | 7 | 34 | 30 | 6 | 4 | 13 | 27 | 41 | −10 | 54 | |
| 17 | Fulham | 46 | 10 | 9 | 4 | 39 | 26 | 2 | 8 | 13 | 18 | 37 | −6 | 53 | |
| 18 | Mansfield Town | 46 | 6 | 10 | 7 | 25 | 29 | 5 | 10 | 8 | 29 | 35 | −10 | 53 | |
| 19 | Lincoln City | 46 | 8 | 7 | 8 | 32 | 26 | 5 | 7 | 11 | 25 | 47 | −16 | 53 | |
| 20 | Hartlepool United | 46 | 8 | 9 | 6 | 30 | 24 | 4 | 4 | 15 | 17 | 43 | −20 | 49 | |
| 21 | Leyton Orient | 46 | 11 | 4 | 8 | 29 | 22 | 1 | 7 | 15 | 15 | 41 | −19 | 47 | |
| 22 | Cardiff City | 46 | 8 | 6 | 9 | 24 | 22 | 3 | 6 | 14 | 17 | 42 | −23 | 45 | |
| 23 | Scarborough | 46 | 5 | 11 | 7 | 22 | 28 | 3 | 5 | 15 | 17 | 41 | −30 | 40 | |
| 24 | Torquay United | 46 | 4 | 9 | 10 | 17 | 36 | 1 | 5 | 17 | 13 | 48 | −54 | 29 |
Source:
Play-offs
| Semifinals 1st leg – May 12th; 2nd leg – May 15th, 1996 |
Final at Wembley Stadium May 25th, 1996 | |||||||||
| 4th | Plymouth Argyle | 0 | 3 | 3 | ||||||
| 7th | Colchester United | 1 | 1 | 2 | ||||||
| 4th | Plymouth Argyle | 1 | ||||||||
| 5th | Darlington | 0 | ||||||||
| 5th | Darlington | 2 | 2 | 4 | ||||||
| 6th | Hereford United | 1 | 1 | 2 | ||||||
Results
Top scorers
| Rank | Player | Club | Goals |
|---|---|---|---|
| 1 | Hereford United | 29 | |
| = | Preston North End | 29 |
Locations
Locations of the Third Division London teams
References
- "England 1995–96". Rec.Sport.Soccer Statistics Foundation. Retrieved 2010-02-24.
- "English League Leading Goalscorers". RSSSF. Retrieved 2010-10-31.
This article is issued from Wikipedia. The text is licensed under Creative Commons - Attribution - Sharealike. Additional terms may apply for the media files.