1979 Portuguese local elections
The Portuguese local elections of 1979 took place on 16 December. They were the second local elections in Portugal since the democratic revolution of 1974 introduced the concept of democratic local power.
| |||||||||||||||||||||||||||||||||||||||||||||||||
All 305 Portuguese municipalities and 4,260 Portuguese Parishes All 1,900 local government councils | |||||||||||||||||||||||||||||||||||||||||||||||||
|---|---|---|---|---|---|---|---|---|---|---|---|---|---|---|---|---|---|---|---|---|---|---|---|---|---|---|---|---|---|---|---|---|---|---|---|---|---|---|---|---|---|---|---|---|---|---|---|---|---|
| Turnout | 71.7% | ||||||||||||||||||||||||||||||||||||||||||||||||
| |||||||||||||||||||||||||||||||||||||||||||||||||

.jpg)
.jpg)
| This article is part of the series: |
| Politics and government of Portugal |
|---|
 |
| Portugal |
The elections consisted of three separate elections in the 305 Portuguese municipalities, the election for the Municipal Chambers, whose winner is elected mayor, another election for the Municipal Assembly and a last one for the lower-level Parish Assembly, whose winner is elected parish president, this last was held separately in the more than 4,000 parishes around the country.
The Socialist Party finished on the top of the results table, however that was because the coalition between the two major right-wing parties, the Democratic and Social Center and the Social Democratic Party, the Democratic Alliance, did not participated in all Municipalities and Parishes, being the parties which composed it, separated in many Municipalities
The left-wing United People Alliance dominated the election in the municipalities of the South of the country, gathering more than 60% of the voting.
Turnout in these elections increased compared with the 1976 election, as 71.7% of the electorate cast a ballot, the highest turnout recorded in a nationwide local election.
Parties
The main political forces involved in the election were:
- Democratic Alliance (AD) (only in some municipalities)
- Democratic and Social Center (CDS) (only in some municipalities)
- Socialist Party (PS)
- Social Democratic Party (PSD) (only in some municipalities)
- United People Alliance (APU)
National summary of votes and seats
Municipal Councils
.png)
Municipalities won by:
■ - PS: 60
■ - AD: 73
■ - APU: 50
■ - PSD: 101
■ - CDS: 20
■ - PPM: 1
| Parties | Votes | % | Candidacies | Councillors | Mayors | ||||
|---|---|---|---|---|---|---|---|---|---|
| # | ± | # | ± | ||||||
| Socialist | 1,258,966 | 28.33 | 297 | 516 | 60 | ||||
| Democratic Alliance | 1,044,642 | 23.51 | 138 | 426 | — | 73 | — | ||
| United People Alliance[A] | 885,899 | 19.94 | 295 | 316 | 50 | ||||
| Social Democratic | 723,953 | 16.29 | 156 | 475 | 101 | ||||
| Democratic and Social Centre | 334,258 | 7.52 | 102 | 156 | 20 | ||||
| People's Democratic Union | 53,076 | 1.19 | 95 | 3 | — | 0 | — | ||
| Portuguese Workers' Communist | 19,508 | 0.44 | 63 | 0 | 0 | ||||
| Christian Democratic | 6,631 | 0.15 | 9 | 2 | — | 0 | — | ||
| People's Monarchist | 6,219 | 0.14 | 3 | 6 | 1 | ||||
| UEDS | 1,882 | 0.04 | 7 | 0 | — | 0 | — | ||
| Workers Party of Socialist Unity | 273 | 0.01 | 2 | 0 | — | 0 | — | ||
| Total valid | 4,271,897 | 97.56 | — | 1,900 | 305 | ||||
| Blank ballots | 44,693 | 1.01 | |||||||
| Invalid ballots | 63,679 | 1.43 | |||||||
| Total (turnout 71.74%) | 4,380,269 | 100.00 | |||||||
| A In 1976, as Electoral Front United People. | |||||||||
Municipal Assemblies
| Parties | Votes | % | Candidacies | Mandates | |||||
|---|---|---|---|---|---|---|---|---|---|
| # | ± | ||||||||
| Socialist | 1,245,306 | 27.86 | 2,686 | ||||||
| Democratic Alliance | 1,056,656 | 23.64 | 2,122 | — | |||||
| United People Alliance[A] | 916,990 | 20.51 | 1,746 | ||||||
| Social Democratic | 747,911 | 16.73 | 2,230 | ||||||
| Democratic and Social Centre | 308,721 | 6.91 | 832 | ||||||
| People's Democratic Union | 55,794 | 1.25 | 58 | — | |||||
| Portuguese Workers' Communist | 10,783 | 0.24 | 0 | ||||||
| People's Monarchist | 5,578 | 0.12 | 26 | ||||||
| UEDS | 596 | 0.01 | 3 | — | |||||
| Christian Democratic | 417 | 0.00 | 0 | ||||||
| Total valid | 4,266,013 | 97.28 | — | 9,703 | |||||
| Blank ballots | 59,564 | 1.33 | |||||||
| Invalid ballots | 62,241 | 1.39 | |||||||
| Total (turnout 71.86%) | 4,387,818 | 100.00 | |||||||
| A In 1976, as Electoral Front United People. | |||||||||
Parish Assemblies
| Parties | Votes | % | Candidacies | Mandates | Presidents | ||||
|---|---|---|---|---|---|---|---|---|---|
| # | ± | # | ± | ||||||
| Socialist | 1,219,298 | 27.77 | 10,613 | ||||||
| Democratic Alliance | 1,000,702 | 22.79 | 9,785 | — | — | ||||
| United People Alliance[A] | 898,670 | 20.47 | 4,732 | ||||||
| Social Democratic | 736,954 | 16.78 | 9,447 | ||||||
| Democratic and Social Centre | 306,332 | 6.98 | 4,661 | ||||||
| Independents | 49,207 | 1.12 | 707 | ||||||
| People's Democratic Union | 41,414 | 0.94 | 55 | — | — | ||||
| Portuguese Workers' Communist | 6,010 | 0.14 | 3 | ||||||
| People's Monarchist | 5,006 | 0.12 | 78 | ||||||
| Christian Democratic | 2,594 | 0.06 | 26 | — | — | ||||
| Workers Party of Socialist Unity | 695 | 0.02 | 1 | — | — | ||||
| UEDS | 600 | 0.01 | 2 | — | — | ||||
| Total valid | 4,141,981 | 97.19 | — | 40,110 | — | ' | — | ||
| Blank ballots | 54,704 | 1.25 | |||||||
| Invalid ballots | 68,502 | 1.56 | |||||||
| Total (turnout 70.72%) | 4,265,187 | 100.00 | |||||||
| A In 1976, as Electoral Front United People. | |||||||||
Maps
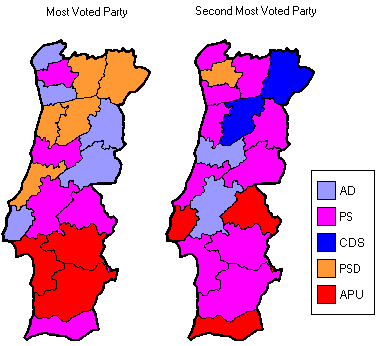 The first and the second most voted parties in Municipal Councils in each district. (Azores and Madeira are not shown)
- The first and the second most voted parties in Municipal Assemblies in seach district. (Azores and Madeira are not shown)
- The first and the second most voted parties in Parish Assemblies in seach district. (Azores and Madeira are not shown)
Notes
- The source of the voting data is the Portuguese Electoral Commission
Further Notes:
- Democratic Alliance (AD) was composed by the Democratic Social Center (CDS), the Social Democratic Party (PSD) and the People's Monarchist Party (PPM).
- Although the PSD, the CDS and the PPM were united in the Democratic Alliance, they appear in the scorecard because they ran separated in several municipalities.
- United People Alliance (APU) was composed by the Portuguese Communist Party (PCP) and the Portuguese Democratic Movement (MDP/CDE).
- The number of candidacies expresses the number of municipalities or parishes in which the party or coalition presented lists.
- The number of mandates expresses the number of municipal deputies in the Municipal Assembly election and the number of parish deputies in the Parish Assembly election.
- The turnout varies because one may choose not to vote for all the organs.
References
- Sum of PSD, AD, CDS and PPM votes.
- Sum of PSD, AD, CDS and PPM elected mayors.
- Sum of PSD, AD, CDS and PPM elected councillors.
External links
| Presidential elections | |
|---|---|
| Parliamentary elections |
|
| Local elections | |
| European elections | |
| Referendums | |
| |