1911 Cisleithanian legislative election
Legislative elections to elect members of the Imperial Council were held in Cisleithania, the Austrian section of Austria-Hungary over several days in June and July 1911.[1] A coalition of German national and liberal parties, the Deutscher Nationalverband, emerged as the largest bloc in Parliament, holding 100 of the 516 seats. Voter turnout was 80.2%.[2]
| |||||||||||||||||||||||||||||||||||||||||||||||||||||||||||||||||||||||||||||||||||||||||||||
All 516 seats in the Imperial Council 259 seats needed for a majority | |||||||||||||||||||||||||||||||||||||||||||||||||||||||||||||||||||||||||||||||||||||||||||||
|---|---|---|---|---|---|---|---|---|---|---|---|---|---|---|---|---|---|---|---|---|---|---|---|---|---|---|---|---|---|---|---|---|---|---|---|---|---|---|---|---|---|---|---|---|---|---|---|---|---|---|---|---|---|---|---|---|---|---|---|---|---|---|---|---|---|---|---|---|---|---|---|---|---|---|---|---|---|---|---|---|---|---|---|---|---|---|---|---|---|---|---|---|---|
| Turnout | 4,625,082 (80.20%) | ||||||||||||||||||||||||||||||||||||||||||||||||||||||||||||||||||||||||||||||||||||||||||||
| |||||||||||||||||||||||||||||||||||||||||||||||||||||||||||||||||||||||||||||||||||||||||||||
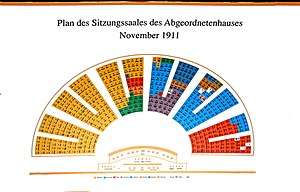 Seats of the House of Deputies of the Imperial Austro-Hungarian Council. Situation after the November 1911 Cisleithanian legislative elections. The seats are marked by nationality. | |||||||||||||||||||||||||||||||||||||||||||||||||||||||||||||||||||||||||||||||||||||||||||||
| |||||||||||||||||||||||||||||||||||||||||||||||||||||||||||||||||||||||||||||||||||||||||||||
.jpg)

| This article is part of a series on the politics and government of Austria-Hungary |
|---|
| Compromise of 1867 |
|
|
This was the second election under universal male suffrage, and the last before the dissolution of the empire as a result of World War I. At that dissolution it was the German representatives that formed the first truly Austrian legislative body of the Republic of German-Austria.
In the German-speaking areas the results however were similar to the previous elections in 1907, with the Christian Socials as the largest party (76 seats), followed by the Social Democrats (43) and the German People's Party (32). Both the major parties lost seats, and the parties which gained were the moderate centre and the radicals. Results varied by province, with Lower Austria providing the political base for the two largest parties. There was a wide difference between rural areas (Christian Social) and urban (Social Democrat), a split (social cleavage) that had become more evident since 1907, with the Christian Socials losing their support in the outer belt of Viennese districts. Support for the German People's party was more even. The German People's Party found its support in the middle strata of Austrian society. On the other hand, industrialists rejected this party in favour of the Freisinnige group, particularly the German Progressive Party, as did the more prosperous merchants.
Among the non-German nationalities, the results also differed widely between nations.[3]
Results
| Party | Votes | % | Seats | +/– |
|---|---|---|---|---|
| Croatian Nation | ||||
| People's Party | 33,565 | 0.74 | 5 | |
| Pure Party of Rights | 28,254 | 0.62 | 4 | |
| Social Democratic Party of Croatia and Slavonia | 329 | 0.01 | 0 | New |
| Croatian Nation & Slovenian Nation | ||||
| Slavic Nationalists | 20,770 | 0.46 | 3 | New |
| Czech Nation | ||||
| Social Democratic Party (Autonomists) | 357,234 | 7.87 | 25 | |
| Czech Agrarian Party | 257,717 | 5.68 | 36 | |
| Catholic-National Conservative Parties in Bohemia & Moravia | 128,056 | 2.82 | 7 | |
| Czech National Social Party | 95,901 | 2.11 | 13 | |
| Christian Social Parties in Bohemia & Moravia | 83,124 | 1.83 | 0 | |
| Young Czech Party | 56,673 | 1.25 | 14 | |
| Czech Progressive People's Party | 34,443 | 0.76 | 5 | |
| Czech Constitutionalist Progressive Party | 20,881 | 0.46 | 4 | |
| Social Democratic Party (Centralists) | 19,374 | 0.43 | 1 | New |
| Czech Independents | 10,832 | 0.24 | 1 | |
| Old Czech Party | 9,872 | 0.22 | 1 | |
| Czech Paper Candidates | 9,836 | 0.22 | 0 | |
| Czech Realist Party | 4,984 | 0.11 | 0 | |
| Officials’ Party | 3,201 | 0.07 | 0 | New |
| Czech National Party | 1,893 | 0.04 | 0 | |
| German Nation | ||||
| Christian Social Party | 608,346 | 13.41 | 75 | |
| Social Democratic Party | 542,549 | 11.96 | 46 | |
| Agrarian Party | 106,548 | 2.35 | 22 | |
| German Radical Party | 90,523 | 2.00 | 22 | |
| German People's Party | 71,882 | 1.58 | 21 | |
| German Progressive Party | 71,114 | 1.57 | 25 | |
| German Freedom Party[a] | 66,738 | 1.47 | 15 | New |
| German-National Party[a] | 28,689 | 0.63 | 4 | |
| German Workers' Party | 26,670 | 0.59 | 3 | |
| Upper Austrian Farmers' Club | 22,009 | 0.48 | 0 | |
| Pan-German Association | 20,527 | 0.45 | 4 | |
| German Miners and Farmers' Association | 15,301 | 0.34 | 0 | New |
| German Independents | 14,934 | 0.33 | 2 | |
| German Conservatives | 14,597 | 0.32 | 0 | |
| Independent Christian Socials | 10,299 | 0.23 | 1 | New |
| German Paper Candidates | 7,569 | 0.16 | 0 | New |
| Central Industrial Committee | 6,422 | 0.14 | 0 | |
| Free Socialists | 4,074 | 0.09 | 1 | |
| German Conservative Farmers' Party | 3,623 | 0.08 | 0 | |
| Imperial Economic Policy Party | 2,885 | 0.06 | 1 | New |
| Social Politicians | 2,735 | 0.06 | 1 | |
| German Economic Party | 1,893 | 0.04 | 0 | New |
| Italian Nation | ||||
| Italian National-Liberal Party | 41,928 | 0.93 | 5 | |
| Italian People’s Party | 40,543 | 0.89 | 10 | |
| Italian Social Democratic Party | 23,068 | 0.51 | 3 | |
| Italian Liberal Party | 5,925 | 0.13 | 1 | |
| Italian Liberal Farmers' Association | 3,685 | 0.10 | 0 | |
| Italian Independents | 436 | 0.01 | 0 | |
| Democratic Party | 321 | 0.01 | 0 | New |
| Jewish Candidates | ||||
| Jewish National Party | 31,781 | 0.70 | 1 | |
| Polish Nation | ||||
| Polish People's Party | 185,674 | 4.09 | 24 | |
| Polish Conservative Party | 137,199 | 3.02 | 17 | |
| Polish National Democratic Party | 98,460 | 2.17 | 10 | |
| Polish Democratic Party | 84,181 | 1.86 | 13 | |
| Polish Social Democratic Party | 64,569 | 1.42 | 8 | |
| Polish Independents | 38,028 | 0.84 | 3 | New |
| Polish Centre Party | 23,139 | 0.51 | 1 | |
| Galician Christian Social Party[d] | 21,982 | 0.49 | 3 | |
| Independent Socialists | 6,515 | 0.14 | 2 | |
| Polish Pro-German Party | 5,902 | 0.13 | 0 | New |
| Independent Democrats | 4,302 | 0.10 | 1 | New |
| Polish Progressive Democratic Party | 2,933 | 0.06 | 1 | |
| Romanian Nation | ||||
| Romanian National (Defense) Party | 38,408 | 0.85 | 4 | |
| Romanian National (Democratic) Party | 11,810 | 0.26 | 1 | |
| Romanian Independents | 5,728 | 0.12 | 0 | |
| Ruthenian Nation | ||||
| Ukrainian Party–Young Ruthenian Party | 326,955 | 7.21 | 23 | |
| Russian National Party | 128,160 | 2.82 | 2 | |
| Ukrainian Radical Party | 54,701 | 1.20 | 5 | |
| Ukrainian Social Democratic Party | 21,618 | 0.48 | 1 | |
| Serbian Nation | ||||
| Serb People's Party | 11,460 | 0.25 | 2 | |
| Slovenian Nation | ||||
| Slovene People's Party | 54,089 | 1.19 | 10 | |
| Slovene Christian Social Party[b] | 43,203 | 0.95 | 10 | |
| Slovene Liberal Party | 33,170 | 0.73 | 2 | |
| Slovenian Nationalists | 16,858 | 0.37 | 1 | |
| Slovene Social Democratic Party[c] | 14,368 | 0.32 | 0 | |
| Slovenian Pro-Germans | 5,260 | 0.12 | 0 | |
| Slovenian Independents | 3,408 | 0.08 | 0 | |
| Unknown or split | ||||
| Unknown or split votes | 30,453 | 0.67 | – | – |
| Invalid/blank votes | 87,996 | – | – | – |
| Total | 4,625,082 | 100 | 516 | |
| Registered voters/turnout | 5,767,065 | 80.20 | - | |
| Source: ANNO | ||||
a Candidates that ran under the German Freedom Party and German-National Party labels were members of either the German People's Party or the German Progressive Party, which ran as a joint list in certain constituencies.
b Ran as the Slovenian Clerical Party in Styria and Gorizia and Gradisca.
c Ran as the Yugoslavian Social Democratic Party in Carniola.
d Ran as the Polish Clerical Party in Silesia
By parliamentary grouping
| Grouping | Seats | +/– |
|---|---|---|
| German National Association | 100 | |
| Uniform Bohemian Club | 84 | New |
| Christian Social Union | 73 | |
| Poland Club | 70 | |
| Club of German Social Democrats | 49 | |
| Ukrainian Association | 28 | |
| Croatian-Slovenian Club | 27 | New |
| Club of Bohemian Social Democrats | 25 | |
| Latin Union | 21 | New |
| Club of Polish Social Democrats | 9 | |
| Dalmatian Club | 7 | New |
| Independents | 23 | |
| Total | 516 | |
| Source: Nohlen & Stöver | ||
See also
References
- Dieter Nohlen & Philip Stöver (2010) Elections in Europe: A data handbook, p196 ISBN 978-3-8329-5609-7
- Nohlen & Stöver, p209
- Stanley Z. Pech (1989) "Political Parties among Austrian Slavs: A Comparative Analysis of the 1911 Reichsrat Election Results" Canadian Slavonic Papers, Vol. 31, No. 2, Essays in Honour of Peter Brock (June, 1989), pp170–193
Bibliography
| |||||||||||
| |||||||||||