West Perry School District
| West Perry Area School District | |
|---|---|
 | |
| Address | |
|
2606 Shermans Valley Road Elliottsburg, Perry County, Pennsylvania 17024-9706 United States | |
| Information | |
| Type | Public |
| School board | 9 elected members |
| Superintendent |
Dr. Michael O'Brien Superintendent (Contract July 1, 2014 - June 30, 2019)[1] Salary $136,997 (2016) |
| Administrator |
Ms Stevie Jo Heller Business Manager[2] |
| Principal | Ms. Kristi Wickard, ES, former Hummel, Ronald, ES, $97,921 (2012) |
| Principal |
Mrs. Renee LeDonne MS, former Danko, Bernard, $92,020 (2012) Mr. Christopher Young, MS Vice principal |
| Principal |
Rahn, Christopher, HS $85,000 (2012) Ms. Paula Jones, Assistant Principal HS |
| Principal | Mr. Lucas Clouse, ES, former Conaway, Dianne, ES $83,811 (2012) |
| Principal | Mrs. Kathleen Kassirer, ES, former Clouse, Lucas, ES, salary $72,500 (2012) |
| Staff | 157 non teaching staff members (2014),[4] 173 non teaching staff (2012), 177 staff[5] |
| Faculty | 179 teachers (2014),[6] 180 teachers (2012), 190 teachers (2010)[7] |
| Grades | Kindergarten-12th |
| Age | 5 years old to 21 years for special education students |
| Number of pupils |
2,482 Pupils (2016)[8] |
| • Kindergarten | 193 (2015),[14] 200 (2013),[15] 185 (2010) |
| • Grade 1 | 174 (2015), 182 (2013), 188 (2010) |
| • Grade 2 | 193 (2015), 213 (2013), 192 |
| • Grade 3 | 200 (2015), 173 (2013), 193 |
| • Grade 4 | 176 (2015), 183 (2013), 184 |
| • Grade 5 | 207 (2015), 184 (2013), 218 |
| • Grade 6 | 182 (2015), 206 (2013), 215 |
| • Grade 7 | 175 (2015), 193 (2013), 216 |
| • Grade 8 | 196 (2015), 221 (2013), 215 |
| • Grade 9 | 218 (2015), 233 (2013), 232 |
| • Grade 10 | 197 (2015), 196 (2013), 223 |
| • Grade 11 | 219 (2015), 202 (2013), 226 |
| • Grade 12 | 183 (2015), 197 (2013), 211 (2010) |
| • Other | Enrollment projected to decline to 2,643 in 2016[16] |
| Color(s) | Green and White |
| Mascot | Mustang |
| Budget |
$38.29 million (2016-17)[17] |
| Per pupil spending |
$11,499 (2008) |
| Website | http://www.westperry.org |
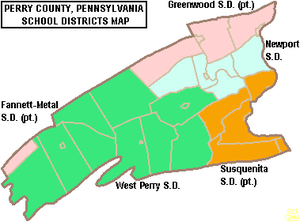
The West Perry School District is a midsized, public school district located in western Perry County, Pennsylvania. It encompasses over 325 square miles (840 km2), covering virtually all of the western half of the county. As one of Perry County's four school districts, West Perry serves: the boroughs of Blain, New Bloomfield and Landisburg, as well as, Carroll Township, Centre Township, Jackson Township, Northeast Madison Township, Saville Township, Spring Township, Southwest Madison Township, Toboyne Township, and Tyrone Township, making it the largest school district in terms of area in Perry County. According to 2008 local census data, West Perry School District had a resident population of 17,101 people. According to the US Census Bureau, by 2010, the District's population had grown to 19,005 people.[22] In 2010, the educational attainment levels, for the population 25 and over, was 83.3% high school graduates and 14.5% college graduates.[23]
Per the Pennsylvania Budget and Policy Center, 36.7% of the District’s pupils lived at 185% or below the Federal Poverty level as shown by their eligibility for the federal free or reduced price school meal programs in 2012.[24] In 2013 the Pennsylvania Department of Education, reported that 25 students in the West Perry School District were homeless.[25] In 2009, the District residents' per capita income was $17,802, while the median family income was $47,210 a year.[26] In Perry County, the median household income was $57,375.[27] In the Commonwealth, the median family income was $49,501[28] and the United States median family income was $49,445, in 2010.[29] In 2014, the median household income in the USA was $53,700.[30]
For school year 2014-15, West Perry School District had an enrollment of 2,509 pupils. The District employed: 198 teachers, 129 full-time and part-time support personnel, and 17 administrators. The District received more than $15.9 million in state funding in school year 2014-15.[31] According to District officials, in school year 2009-2010, West Perry School District provided basic educational services to 2,679 pupils. The District employed: 238 teachers, 174 full-time and part-time support personnel and 20 administrators. The District received more than $15 million in state funding in school year 2009-10. Per District officials, in school year 2007–08, the West Perry School District provided basic educational services to 2,722 pupils through the employment of 237 teachers, 172 full-time and part-time support personnel, and 20 administrators. The demographics of the district students are: 98% white, 0% Asian, 1% black and 1% Hispanic.[32]
West Perry School District operates three elementary schools (K-5th):
- Blain Elementary School,
- Carroll Elementary School,
- New Bloomfield Elementary School
- West Perry Middle School (6th −8th)
- West Perry High School (9th–12th)
Additionally, the District operates Hidden Valley School which is a full-time emotional support facility for students who benefit from an alternate educational setting. Hidden Valley students are in grades 6–12 from the West Perry School District, along with students from other districts in Perry County.
West Perry High School students may choose to attend Cumberland Perry Area Vocational Technical School which is located in Mechanicsburg, Pennsylvania. CPAVTA provides training in the: construction and mechanical trades, culinary arts, health aids, computer technical careers and other fields. Students may also attend Capital Area Online Learning Association (CAOLA) online education programs.[33] The service is operated by the CAIU15. The Capital Area Intermediate Unit IU15 also provides West Perry School District with a wide variety of services, like: specialized education for disabled students; hearing, speech and visual disability services and professional development for staff and faculty.
Governance
West Perry School District is governed by 9 individually elected board members (serve four-year terms), the Pennsylvania State Board of Education, the Pennsylvania Department of Education and the Pennsylvania General Assembly.[34] The federal government controls programs it funds like Title I funding for low-income children in the Elementary and Secondary Education Act and the No Child Left Behind Act, (renamed Every Student Succeeds Act (ESSA) in December 2015) which mandates the district focus its resources on student success in acquiring reading and math skills.[35] The school board is required by state law to post a financial report on the district in its website by March of each school year.[36] The Board is compliant in March 2016.[37]
The Superintendent and Business Manager are appointed by the school board. The Superintendent is the chief administrative officer with overall responsibility for all aspects of operations, including education and finance. The Business Manager is responsible for budget and financial operations. Neither of these officials are voting members of the School Board. The School Board enters into individual employment contracts for these positions. In Pennsylvania, public school districts are required to give 150 days notice to the Superintendent regarding renewal of the employment contract.[38] The School Board enters into individual employment contracts for these positions. These contracts must be in writing and are subject to public disclosure under the state’s Right to Know Act. In Pennsylvania, public school districts are required to give 150 days notice to the Superintendent and Business Manager regarding renewal of their employment contracts.[38] Pursuant to Act 141 of 2012 which amended the Pennsylvania School Code, all school districts that have hired superintendents on/after the fall of 2012 are required to develop objective performance standards and post them on the district’s website.[39]
The Commonwealth Foundation for Public Policy Alternatives Sunshine Review gave the school board and district administration a "D-" for transparency based on a review of "What information can people find on their school district's website". It examined the school district's website for information regarding; taxes, the current budget, meetings, school board members names and terms, contracts, audits, public records information and more.[40]
Academic achievement
In 2016, West Perry School District ranked 331st out of 493 Pennsylvania public school districts, by the Pittsburgh Business Times.[41] The ranking is based on the last 3 years of student academic achievement as demonstrated by PSSAs results in: reading, writing, math and science and the three Keystone Exams (literature, Algebra 1, Biology I) in high school.[42] Three school districts were excluded because they do not operate high schools (Saint Clair Area School District, Midland Borough School District, Duquesne City School District). The PSSAs are given to all children in grades 3rd through 8th. Adapted PSSA examinations are given to children in the special education programs. Writing exams were given to children in 5th and 8th grades.
|
|
|
- Overachievers ranking
In 2013, the Pittsburgh Business Times reported an Overachievers Ranking for 497 Pennsylvania school districts. West Perry School District ranked 479th. The paper describes the ranking as: "the ranking answers the question – which school districts do better than expectations based upon economics? This rank takes the Honor Roll rank and adds the percentage of students in the district eligible for free and reduced-price lunch into the formula. A district finishing high on this rank is smashing expectations, and any district above the median point is exceeding expectations."[50]
- 2012 - 473rd
- 2011 - 485th
- 2010 - 491st[50]
- 2009 - 491st
- Opportunity Scholarship Tax Credit Program
In 2012, the Pennsylvania Department of Education (PDE) released a report identifying two West Perry School District schools as among the lowest achieving schools for reading and mathematics in the state.[51][52] Both Blain Elementary School and West Perry Senior High School were among the 15% lowest achieving schools in the Commonwealth. Parents and students may be eligible for scholarships to transfer to another public or nonpublic school through the state's Opportunity Scholarship Tax Credit Program passed in June 2012.[53] The scholarships are limited to those students whose family's income is less than $60,000 annually, with another $12,000 allowed per dependent. Maximum scholarship award is $8,500, with special education students receiving up to $15,000 for a year's tuition. Parents pay any difference between the scholarship amount and the receiving school's tuition rate. Students may seek admission to neighboring public school districts. Each year the PDE publishes the tuition rate for each individual public school district.[54] Fifty-three public schools in Allegheny County are among the lowest-achieving schools in 2011. According to the report, parents in 414 public schools (74 school districts) were offered access to these scholarships. For the 2012-13 school year, eight public school districts in Pennsylvania had all of their schools placed on the list including: Sto-Rox School District, Chester Upland School District, Clairton City School District, Duquesne City School District, Farrell Area School District, Wilkinsburg Borough School District, William Penn School District and Steelton-Highspire School District.[55] In 2014, Monessen City School District had all three of its schools added to the list. Funding for the scholarships comes from donations by businesses which receive a state tax credit for donating. For 2013-2014, no West Perry School District school was on the list. In 2014-15 the schools remained off the list.[52] In 2016-17, West Perry School District schools continued to remain off the list.[56]
In 2009, the academic achievement of the students of the West Perry School District was in the bottom 9th percentile of the 500 school districts in Pennsylvania. Scale (0–99; 100 is state best)[57]
District AYP status history
In 2012, West Perry School District remained in Warning Adequate Yearly Progress (AYP) status, Only one of its schools achieved AYP status in 2012.[58] In 2011, West Perry School District declined to Warning AYP status. In 2011, 94 percent of the 500 Pennsylvania public school districts achieved the No Child Left Behind Act progress level of 72% of students reading on grade level and 67% of students demonstrating on grade level math. In 2011, 46.9 percent of Pennsylvania school districts achieved Adequate Yearly Progress (AYP) based on student performance. An additional 37.8 percent of school districts made AYP based on a calculated method called safe harbor, 8.2 percent on the growth model and 0.8 percent on a two-year average performance.[59]
- 2006 - 2010 - Achieved AYP status each school year
- 2005 - Making Progress - School Improvement Level 1 AYP
- 2004 - declined to School Improvement Level 1 AYP status due to lagging student achievement in reading and mathematics[60]
- 2003 - Warning AYP status due to lagging student achievement.[61]
Districts in School Improvement status are required by the Pennsylvania Department of Education to develop an Improvement Plan and to submit it for approval by the Pennsylvania Department of Education. They are also required to notify parents of the low academic achievement in the schools.
Graduation rate
In 2016, West Perry School District's graduation rate declined to 86.11%.[62]
- 2015 - 88%.[63]
- 2014 - 87.74%.[64]
- 2013 - 92%[65]
- 2012 - 74%.[66]
- 2011 - 71%.[67]
- 2010 - 69%, In 2010, the Pennsylvania Department of Education issued a new, 4-year cohort graduation rate.[68]
- Traditional method of reporting
High school
West Perry Senior High School is located at 2608 Shermans Valley Road, Elliottsburg. In 2016, enrollment was reported as 811 pupils in 9th through 12th grades, with 30.8% of pupils eligible for a free lunch due to family poverty. Additionally, 16% of pupils received special education services, while 3.9% of pupils were identified as gifted.[73] In 2014, enrollment was reported as 802 pupils in 9th through 12th grades, with 32.79% of pupils eligible for a free lunch due to family poverty.[74] In 2013, enrollment was reported as 836 pupils in 9th through 12th grades, with 29.8% of pupils eligible for a free lunch due to family poverty. Additionally, 16.8% of pupils received special education services, while 4.24% of pupils were identified as Intellectual giftedness.[75] The school employed 55 teachers.[76] Per the Pennsylvania Department of Education 100% of the teachers were rated "Highly Qualified" under the federal No Child Left Behind Act. The School is not a federally designated Title I school.
According to the National Center for Education Statistics, in 2010, the School reported 886 pupils enrolled in grades 9th through 12th, with 235 students eligible for a federal free or reduced-price lunch due to family poverty. West Perry Senior High School employed 66 teachers, for a student–teacher ratio of 13:1.[77]
- 2016 School Performance Profile
SPP 77.9 out of 100 points. West Perry Area High School Keystone Exams mandated testing results were: 76% of students were on grade level in reading/literature and just 67% of students demonstrated on grade level in Algebra I, at the end of the course. In Biology I, 65.6% of pupils demonstrated on grade level science understanding at the end of the Biology course.[78] The requirement that pupils pass the Keystone Exams in reading, algebra I and bIology I in order to graduate was postponed until 2019 by the Pennsylvania General Assembly because less than 60% of 12 grade pupils statewide would have been eligible for graduation from high school due to failing one or more Keystone Exams.[79] Fifty-four percent of the 2,676 public schools in Pennsylvania achieved a passing score of 70 or better.[80]
- 2015 School Performance Profile
West Perry High School achieved 79.5 out of 100. Reflects on grade level reading, mathematics and science achievement. The PDE reported that 77% of the High School’s students were on grade level in reading/literature. In Algebra 1, 67% of students showed on grade level skills at the end of the course. In Biology I, 59.6% demonstrated on grade level science understanding at the end of the course.[81] Statewide, 53 percent of schools with an eleventh grade achieved an academic score of 70 or better. Five percent of the 2,033 schools with 11th grade were scored at 90 and above; 20 percent were scored between 80 and 89; 28 percent between 70 and 79; 25 percent between 60 and 69 and 22 percent below 60. The Keystone Exam results showed: 73 percent of students statewide scored at grade-level in English, 64 percent in Algebra I and 59 percent in biology.[82][83]
- 2014 School Performance Profile
West Perry Senior High School achieved 73.7 out of 100. Reflects on grade level reading, mathematics and science achievement. In reading/literature - only 67% were on grade level. In Algebra 1, just 62.7% showed on grade level skills. In Biology, only 50.9% demonstrated on grade level science understanding at the end of the course.[84][85] Statewide, the percentage of high school students who scored proficient and advanced in Algebra I increased to 39.7% to 40.1%. The percentage of high school students who scored proficient and advanced in reading/literature declined to 52.5%. The percentage of high school students who scored proficient and advanced in biology improved from 39.7% to 41.4%.[86]
- 2013 School Performance Profile
West Perry High School achieved 63.3 out of 100. Reflects on grade level reading, mathematics and science achievement. In reading/literature - 81.8% of tested pupils were on grade level. In Algebra 1, 59% showed on grade level math skills. In Biology, just 50% of pupils showed on grade level science understanding at the end of their Biology course.[87] According to the Pennsylvania Department of Education, 2,181 public schools (less than 73 percent of Pennsylvania public schools), achieved an academic score of 70 or higher. Pennsylvania 11th grade students no longer take the PSSAs. Instead, beginning in 2012, they take the Keystone Exams at the end of the associated course.[88]
- AYP history
In 2012, West Perry Senior High School was in Making Progress: in School Improvement I. In 2011, West Perry Senior High School declined to School Improvement I status due to poor student achievement in both reading and mathematics. In 2010, the school was in Warning status due to low student performance.[89] The school administration was required to develop a school improvement plan that focused on raising student academic achievement. The school was eligible to receive additional federal school improvement funds.
- PSSA Results:
Pennsylvania System of School Assessments, commonly called PSSAs are No Child Left Behind Act related examinations which were administered from 2003 through 2012, in all Pennsylvania public high schools. The exams were administered in the Spring of each school year. The goal was for 100% of students to be on grade level or better in reading and mathematics, by the Spring of 2014. The tests focused on the state's Academic Standards for reading, writing, mathematics and science. The Science exam included content in science, technology, ecology and the environmental studies. The mathematics exam included: algebra I, algebra II, geometry and trigonometry. The standards were first published in 1998 and are mandated by the Pennsylvania State Board of Education.[90]
In 2013, the Commonwealth of Pennsylvania changed its high school assessments to the Keystone Exams in Algebra 1, Reading/literature and Biology1. The exams are given at the end of the course, rather than all in the spring of the student's 11th grade year.[91]
- 11th Grade Reading:
- 2012 - 69% on grade level, (18% below basic). State - 67% of 11th graders are on grade level.[92]
- 2011 - 62% (18% below basic). 69.1% [93]
- 2010 - 60%, State - 67%
- 2009 - 61%, State - 65%
- 2008 - 48%, State - 65%
- 2007 - 61%, State - 65% [94]
- 2006 - 63%, State - 69%[95]
- 11th Grade Math:
- 2012 - 57% on grade level (28% below basic). In Pennsylvania, 59% of 11th graders are on grade level.
- 2011 - 46%, (32% below basic). State - 60.3%
- 2010 - 47%, State - 59% [96]
- 2009 - 44%, State - 56%
- 2008 - 35%, State - 56%
- 2007 - 49%, State - 53%
- 2006 - 51%, State - 52%
- 11th Grade Science:
- 2012 - 48% on grade level (9% below basic). State - 42% of 11th graders were on grade level.[97]
- 2011 - 37% (16% below basic). State - 40%
- 2010 - 37%, State - 39% [98]
- 2009 - 48%, State - 40%[99]
- 2008 - 25%, State - 39%[100]
Science in Motion West Perry High School took advantage of a state program called Science in Motion which brought college professors and sophisticated science equipment to the school to raise science awareness and to provide inquiry-based experiences for the students. The Science in Motion program was funded by a state appropriation and cost the school nothing to participate.[101] Gettysburg College provides the experiences in the region.
College remediation
According to a Pennsylvania Department of Education study released in January 2009, 37% of West Perry School District graduates required remediation in mathematics and or reading before they were prepared to take college level courses in the Pennsylvania State System of Higher Education or community colleges.[102] Less than 66% of Pennsylvania high school graduates, who enroll in a four-year college in Pennsylvania, will earn a bachelor's degree within six years. Among Pennsylvania high school graduates pursuing an associate degree, only one in three graduate in three years.[103] Per the Pennsylvania Department of Education, one in three recent high school graduates who attend Pennsylvania's public universities and community colleges takes at least one remedial course in math, reading or English.
Graduation requirements
The West Perry School Board requires that each candidate for graduation shall have earned twenty-six (26) credits, including: English 4 credits, Math 3 credits, Social Studies 4 credits, Science 3 credits, Art/Humanities 2 credits, wellness fitness 4 credits, Career Preparation 1 credit, Technology 1 credit, and electives 6 credits.[104]
By law, all Pennsylvania secondary school students must complete a project as a part of their eligibility to graduate from high school. The type of project, its rigor and its expectations are set by the individual school district.[105] Effective with the graduating class of 2017, the Pennsylvania Board of Education eliminated the state mandate that students complete a culminating project in order to graduate.[106]
By Pennsylvania School Board regulations, beginning with the class of 2019,[107] public school students must demonstrate successful completion of secondary level course work in Algebra I, Biology, and English Literature by passing the Keystone Exams.[108][109][110] For the class of 2019, a composition exam will be added. For the class of 2020, passing a civics and government exam will be added to the graduation requirements. The original intent was to gradually add seven more exams including civics and geometry. In 2017, the Pennsylvania General Assembly passed legislation that eliminated developing any more Keystone Exams in other subjects.[111][112] In 2011, Pennsylvania high school students field tested the Algebra 1, Biology and English Lit exams. The statewide results were: Algebra 1 38% on grade level, Biology 35% on grade level and English Lit - 49% on grade level.[113] Individual student, school or district reports were not made public, although they were reported to district officials by the Pennsylvania Department of Education.
Students identified as having special needs and qualifying for an Individual Educational Program (IEP) may graduate by meeting the requirements of their IEP. Students have several opportunities to pass the exams. Schools are mandated to provide targeted assistance to help the student be successful. Those who do not pass after several attempts can perform a project in order to graduate.[114][110] Pennsylvania school district superintendents have been given the discretion to graduate up to 10% of pupils in a graduating class, who have not passed the exams or successfully completed a project.
In 2017, the Pennsylvania General Assembly passed House Bill 202,[115] which makes modifications of the Keystone Exam mandates for students who attend VoTech and Career Tech schools. These pupils will be allowed to use alternate assessments or industry-based certifications.[116][117]
Dual enrollment
West Perry High School offers a dual enrollment program. This state program permits high school students to take courses, at local higher education institutions, to earn college credits. Students remain enrolled at their high school. The courses count towards high school graduation requirements and towards earning a college degree. The students continue to have full access to activities at their high school. The college credits are offered at a deeply discounted rate. The state offers a small grant to assist students in costs for tuition, fees and books.[118] Under the Pennsylvania Transfer and Articulation Agreement, many Pennsylvania colleges and universities accept these credits for students who transfer to their institutions.[119] For the 2009–10 funding year, the school district received a state grant of $1,434 for the program.
SAT scores
In 2016, 95 West Perry School District students took the SAT exams. The District's Verbal Average Score was 503. The Math average score was 504. The Writing average score was .[120] The College Board also reported that statewide 92,569 pupils took the exams with average scores declining again in all three measurers to: 494 in reading, 508 in math and 482 in writing.[121]
In 2015, 80 West Perry School District students took the SAT exams. The District's Verbal Average Score was 516. The Math average score was 505. The Writing average score was 482.[122] The College Board also reported that statewide 96,826 pupils took the exams with average scores declining in all three measurers to: 495 in reading, 511 in math and 484 in writing.[123]
In 2014, 92 West Perry School District students took the SAT exams. The District's Verbal Average Score was 509. The Math average score was 497. The Writing average score was 490.[124] Statewide in Pennsylvania, Verbal Average Score was 497. The Math average score was 504. The Writing average score was 480. The College Board also reported that nationwide scores were: 497 in reading, 513 in math and 487 in writing.[125]
In 2013, 97 West Perry School District students took the SAT exams. The District's Verbal Average Score was 488. The Math average score was 479. The Writing average score was 477. The College Board reported that statewide scores were: 494 in reading, 504 in math and 482 in writing. The nationwide SAT results were the same as in 2012.[126]
In 2012, 81 West Perry School District students took the SAT exams. The District's Verbal Average Score was 505. The Math average score was 494. The Writing average score was 474. The statewide Verbal SAT exams results were: Verbal 491, Math 501, Writing 480. In the USA, 1.65 million students took the exams achieving scores: Verbal 496, Math 514, Writing 488. According to the College Board the maximum score on each section was 800, and 360 students nationwide scored a perfect 2,400.
In 2011, 103 West Perry School District students took the SAT exams. The District's Verbal Average Score was 498. The Math average score was 502. The Writing average score was 487.[127] Pennsylvania ranked 40th among states with SAT scores: Verbal - 493, Math - 501, Writing - 479.[128] In the United States, 1.65 million students took the exam in 2011. They averaged 497 (out of 800) verbal, 514 math and 489 in writing.[129]
The Center for Rural Pennsylvania, a research arm of the Pennsylvania General Assembly, compared the SAT data of students in rural areas of Pennsylvania to students in urban areas. From 2003 to 2005, the average total SAT score for students in rural Pennsylvania was 992, while urban students averaged 1,006. During the same period, 28 percent of 11th and 12th graders in rural school districts took the exam, compared to 32 percent of urban students in the same grades. The average math and verbal scores were 495 and 497, respectively, for rural students, while urban test-takers averaged 499 and 507, respectively. Pennsylvania’s SAT composite score ranked low on the national scale in 2004. The composite SAT score of 1,003 left Pennsylvania ranking 44 out of the 50 states and Washington, DC.[130]
AP Courses
In 2014, West Perry High School offered 5 Advanced Placement (AP) courses at a higher cost than regular courses. The fee for each AP Exam is $91 (2014).[131] The school normally retains $9 of that fee as a rebate to help with administrative costs. In 2012, the fee was $89 per test per pupil. Students have the option of taking College Board approved courses and then taking the College Board's examination in the Spring. Students, who achieve a 3 or better on the exam, may be awarded college credits at US universities and colleges. Each higher education institution sets its own standards about what level of credits are awarded to a student based on their AP exam score. Most higher education give credits for scores of 4 or 5. Some schools also give credits for scores of 3. High schools give credits towards graduation to students who take the school's AP class. At West Perry High School fewer than 10 students who took an AP course earned a 3 or better on the exam.[132]
- 2015, West Perry claimed to offer 19 AP courses, with just 11% of pupils who took an AP course earning a 3 or better on the end of course AP exam given by the College Board.[133]
- 2016, West Perry reported offering 7 AP courses, with just 15% of pupils who took an AP course earning a 3 or better on the end of course AP exam given by the College Board.[134]
West Perry Middle school
West Perry Middle School is located 2620 Shermans Valley Road, Elliottsburg. In 2016, enrollment declined further to 548 pupils, in grades 6th through 8th, with 40% of pupils eligible for a free lunch due to family poverty. Additionally, 18% of pupils received special education services, while 2% of pupils were identified as gifted.[135]
In 2015, West Perry Middle School enrollment declined to 566 pupils in grades 6th-8th. In 2014, enrollment declined again to 577 pupils, in grades 6th through 8th, with 37% of pupils eligible for a free lunch due to family poverty. In 2013, enrollment was 610 pupils, in grades 6th through 8th, with 38% of pupils eligible for a free lunch due to family poverty. Additionally, 17.7% of pupils received special education services, while 2.95% of pupils were identified as gifted.[136] According to a 2013 report by the Pennsylvania Department of Education, 98% of its teachers were rated "Highly Qualified" under No Child Left Behind.[137] The School was not a federally designated Title I school.
According to the National Center for Education Statistics, in 2010, the school had 642 pupils enrolled in grades 6th through 8th, with 208 students eligible for a federal free or reduced-price lunch due to family poverty. The school is a federally designated Title I school. The school employed 49 teachers, for a student–teacher ratio of 13:1.[138] The middle school's combined 7th and 8th grades ranked 470th out of 829 Pennsylvania middle schools for student academic achievement in 2008–2009.[139]
- 2016 School Performance Profile
SPP 80.4 out of 100 points. West Perry Middle School PSSA mandated testing results were: 60% of students in 8th grade were on grade level in reading, while just 25% of students demonstrated on grade level in mathematics. In science, 61.5% of eighth grade pupils demonstrated on grade level science understanding.[140] In 7th grade, 66% of the school's pupils were on grade level in reading, while just 39% demonstrated on grade level math skills. Among 6th graders, 69% were on grade level in reading and only 39% were on grade level in math.
- 2015 School Performance Profile
The PDE withheld SPP scores in 2015. It was reported that 65% of 8th grade students at West Perry Middle School students were on grade level in reading on the PSSAs given in April 2015. In math/Algebra 1, 26% of 8th grade students showed on grade level skills. In science, 67% of the school’s 8th graders demonstrated on grade level science understanding. No eighth grade writing scores were reported. In 7th grade, 53% were on grade level in reading, while 24% showed on grade level math skills. Among 6th graders, 64% were on grade level in reading and just 36% were on grade level in mathematics.[141] Statewide 58% of eighth (8th) graders were on grade level in reading, while 29% demonstrated on grade level math skills. Pennsylvania 7th graders were 58% on grade level in reading and 33% demonstrated on grade level math skills. Among sixth (6th) graders, 60.7% were reading on grade level, while 39.7% demonstrated on grade level math skills.[142]
- 2014 School Performance Profile
West Perry Middle School achieved 88.9 out of 100. Reflects on grade level reading, mathematics and science achievement. In reading/literature - 73% were on grade level. In Algebra 1/Math, 77% showed on grade level mathematics skills. In Science, 68% of 8th graders showed on grade level science understanding. In writing, 86% of the 8th grade students demonstrated on grade level writing skills.[143]
- 2013 School Performance Profile
West Perry Middle School achieved 88.3 out of 100. Reflects on grade level reading, writing, mathematics and science achievement. In reading, just 74% of the students were on grade level. In Mathematics/Algebra 1, 78% of the students showed on grade level skills. In Science, only 60% of the 8th graders demonstrated on grade level understanding. In writing, 82% of the 8th grade students demonstrated on grade level writing skills.[144]
AYP history
In 2012, West Perry Middle School declined to School Improvement II status. Under No Child Left Behind, the administration was required to notify parents of the low student academic achievement. The school was required to offer tutoring to raise student achievement.[145]
- 2011 - declined to School Improvement II for continuing low student achievement for students with IEPs.[146] In 2011, 2010, the attendance rate was 94%.[147]
- 2010 - Making Progress: in School Improvement I due to low student achievement.[148] The Pennsylvania Department of Education required the West Perry Middle School's administration to develop a School Improvement Plan to address its academic shortcomings and to submit the plan for approval.
- 2009 - declined further to School Improvement Level I AYP status due to low student achievement[149]
- 2008 - declined to Warning AYP status due to lagging student academic achievement.[150]
- 2007 - achieved AYP status[151]
- 2006 - achieved AYP status
- 2005 - declined to Warning status
- 2004 - achieved AYP status
- 2003 - Warning AYP status due to lagging student achievement
- PSSA History
Sixth and seventh grades have been tested in reading and mathematics since 2006. Eighth graders are tested in: reading, writing, mathematics and Science. Beginning in the Spring of 2013, eighth graders, who are enrolled in Algebra I take the Keystone Exam for Algebra I at the end of the course. The testing of 8th grade in reading and mathematics began in 1999.[152] Testing in science began in 2007. The goal is for 100% of students to be on grade level or better in reading and mathematics, by the Spring of 2014. The tests focus on the state's Academic Standards for reading, writing, mathematics and science.[153] The standards were published in 1998 and are mandated by the Pennsylvania State Board of Education.[90] In 2014, the Commonwealth adopted the Pennsylvania Core Standards - Mathematics.[154]
- 8th Grade Reading:
- 2012 - 76% on grade level (11% below basic). In Pennsylvania, 79% of 8th graders on grade level.[155]
- 2011 - 82%, (8% below basic). State - 81.8%
- 2010 - 80%, State - 81%[156]
- 2009 - 80%, State - 80%[157]
- 2008 - 76%, State - 78%[158]
- 2007 - 76%, State - 75%[159]
- 8th Grade Math:
- 2012 - 84% on grade level (7% below basic). State - 76% [160]
- 2011 - 81%, (8% below basic). State - 76.9%
- 2010 - 80%, State - 75%
- 2009 - 68%, State - 71%
- 2008 - 64%, State - 70%[161]
- 2007 - 70%, State - 67%
- 8th Grade Science:
- 2012 - 58% on grade level (21% below basic). State – 59% of 8th graders were on grade level.
- 2011 - 64% (16% below basic). State – 58.3%
- 2010 - 56%, State - 57%
- 2009 - 61%, State - 54%
- 2008 - 48%, State - 52% [162]
|
|
|
|
- Dropout Early Warning System
In 2015, West Perry School District implemented a no cost dropout prevention Early Warning System and Interventions Catalog at the junior high school.[164] The process identifies students at risk for dropping out by examining the pupil’s: attendance, behavior and course grades. Interventions are implemented to assist at-risk pupils to remain in school. The program is funded by federal and private dollars.[165]
Blain Elementary School
Blain Elementary School is located 132 Blain Road, Blain. In 2016, the School's enrollment was 323 pupils in grades kindergarten through 5th, with 45% of pupils receiving a federal free or reduced price meals due to family poverty. Additionally, 11% of the pupils receive special education services, while less than 1% are identified as gifted.[166] According to a report by the Pennsylvania Department of Education, 100% of the teachers were rated highly qualified under No Child Left Behind. The school provides full day kindergarten.[167] The school is a federally designated Title I school.
In 2014, Blain Elementary School's enrollment was 321 pupils in grades kindergarten through 5th, with 50% of pupils receiving a federal free or reduced price meals due to family poverty.[168] In 2013, Blain Elementary School's enrollment was 304 pupils in grades kindergarten through 5th, with 50% of pupils receiving a federal free or reduced price meals due to family poverty. Additionally, 13% of the pupils receive special education services, while less than 1% are identified as gifted.[169] According to a report by the Pennsylvania Department of Education, 100% of the teachers were rated highly qualified under No Child Left Behind. The school provides half day kindergarten.[170] The school is a federally designated Title I school. The school has provided full day kindergarten to all its pupils since 2009-10.[171]
According to the National Center for Education Statistics, in 2010, Blain Elementary School had 294 pupils enrolled in grades kindergarten through 5th, with 131 students eligible for a federal free or reduced-price lunch due to family poverty. The school employed 23 teachers, for a student–teacher ratio of 12:1.[172] In 2010-2011, the Pennsylvania Department of Education identified Blain Elementary School as one of the lowest achieving schools in the Commonwealth. Parents qualified for an Opportunity Scholarship to transfer their child to another school in the area. In 2013, Blain Elementary School was off the list. It remained off the list in 2015-16.
- 2016 School Performance Profile
SPP 62.3 out of 100 points. Blain Elementary School PSSA mandated testing results were: just 45% of students in 5th grade were on grade level in reading, while just 32% of students demonstrated on grade level mathematics skills. In 4th grade, only 44% were on grade level in reading, while just 32% demonstrated on grade level math skills. In science, 80% of fourth grade pupils demonstrated on grade level understanding of science concepts in the state standards. Among the school's third graders, 71% were on grade level in reading and 62% showed on grade level mathematics skills.[173][174]
- 2015 School Performance Profile
The SPP was withheld by the PDE. According to the Pennsylvania Department of Education, 65% of 5th grade students at Blain Elementary School were on grade level in reading on the PSSAs given in April 2015. In mathematics, just 39% of 5th grade students showed on grade level skills. No fifth grade writing scores were reported. In 4th grade, 57% were on grade level in reading, while 49% showed on grade level math skills. In science, 88% of fourth graders showed on grade level understanding. Among third (3rd) graders, 54% were on grade level in reading and just 36% were on grade level in mathematics.[175] Statewide 61.9% of fifth (5th) graders were on grade level in reading, while 42.8% demonstrated on grade level math skills. Pennsylvania 4th graders were 58.6% on grade level in reading and 44.4% demonstrated on grade level math skills. In science, 77.3% of fourth graders showed on grade level understanding. Among Pennsylvania third (3rd) graders, 62% were reading on grade level, while 48.5% demonstrated on grade level math skills.[176]
- 2014 School Performance Profile
Blain Elementary School achieved a score of 83.3 out of 100. The score reflects on grade level: reading, science, writing and mathematics achievement. In 2013-14, only 67% of the students were reading on grade level in grades 3rd through 5th. In 3rd grade, just 65.7% of the pupils were reading on grade level. In math, 67.7% were on grade level (3rd-5th grades). In 4th grade science, 92% of the pupils demonstrated on grade level understanding. In writing, only 75% of 5th grade pupils demonstrated on grade level skills.[177]
- 2013 School Performance Profile
Blain Elementary School achieved a score of 71 out of 100. The score reflects on grade level: reading, science, writing and mathematics achievement. In 2012-13, only 58% of the students were reading on grade level in grades 3rd through 5th. In 3rd grade, 74% of the pupils were reading on grade level. In math, just 64% were on grade level (3rd-5th grades). In 4th grade science, 80% of the pupils demonstrated on grade level understanding. In writing only 60% of 5th grade pupils demonstrated on grade level skills.[178]
- AYP history
From 2004 to 2012, Blain Elementary School achieved Adequate Yearly Progress (AYP) status each school year.[179] In 2003, Blain Elementary School was in Warning AYP status due to lagging student achievement. The attendance rate was 95%. In 2010 the attendance rate was reported as 95%. It was also 95% in 2009.[180]
- PSSA results
Each year, in the Spring, the 3rd graders take the PSSAs in math and reading. The fourth grade is tested in reading, math and science. The fifth grade is evaluated in reading, mathematics and writing. Pennsylvania System of School Assessments, commonly called PSSAs are No Child Left Behind Act related examinations which were administered beginning 2003 to all Pennsylvania public school students in grades 3rd-8th.[181] The goal was for 100% of students to be on grade level or better in reading and mathematics, by the Spring of 2014.[182][183][184] The tests focused on the state's Academic Standards for reading, writing, mathematics and science. The Science exam is given to 4th grades and includes content in science, technology, ecology and the environmental studies.[185]
|
|
|
|
- 4th Grade Science:
- 2012 - 78%, (12% below basic). State - 82%
- 2011 - 80%, (2% below basic), State – 82.9%
- 2010 - 87%, (5% below basic). State - 81%
- 2009 - 89%, (4% below basic), State - 83%
- 2008 - 86%, State - 81%
|
|
Carroll Elementary School
Carroll Elementary School is located 6670 Spring Road, Shermans Dale. In 2016, the School's enrollment declined to 385 pupils in grades kindergarten through 5th, with 40% of pupils receiving a federal free or reduced price meals due to family poverty. Additionally, 10% of the pupils receive special education services, while 1% are identified as gifted.[191]
In 2014, Carroll Elementary School's enrollment was 396 pupils in grades kindergarten through 5th, with 43.6% of pupils receiving a federal free or reduced price meals due to family poverty.[192] In 2013, Carroll Elementary School's enrollment was 373 pupils in grades kindergarten through 5th, with 40% of pupils receiving a federal free or reduced price meals due to family poverty. Additionally, 10% of the pupils receive special education services, while 1.6% are identified as gifted.[193] According to a report by the Pennsylvania Department of Education, 100% of the teachers were rated highly qualified under No Child Left Behind. The school provides half day kindergarten and is a federally designated Title I school.[194] The School has provided full day kindergarten since 2009-10.
According to the National Center for Education Statistics, in 2010, Carroll Elementary School had 395 pupils enrolled in grades kindergarten through 5th, with 134 students eligible for a federal free or reduced-price lunch due to family poverty. The School employed 27 teachers, for a student–teacher ratio of 14:1.[195] According to a report by the Pennsylvania Department of Education, 100% of its teachers were rated "Highly Qualified" under No Child Left Behind.[196]
West Perry School District has provided full-day kindergarten since 2010.[197] Proponents of full day kindergarten claim it will reduce special education numbers and it will raise primary student academic achievement in reading.[198] Those outcomes have not been realized in the West Perry School District. Reading achievement in particular has not improved.[199]
- 2016 School Performance Profile
SPP 78.7 points out of 100 points. Carroll Elementary School PSSA mandated testing results were: 58% of students in 5th grade were on grade level in reading, while 50% of students demonstrated on grade level mathematics skills. In 4th grade, just 51% were on grade level in reading, while only 37% demonstrated on grade level math skills. In science, 79% of fourth grade pupils demonstrated on grade level understanding of science concepts in the state standards. Among the school's third graders, just 52% were on grade level in reading and 50% showed on grade level mathematics skills.[173][174]
- 2015 School Performance Profile
According to the Pennsylvania Department of Education, 53% of 5th grade students at Carroll Elementary School were on grade level in reading on the PSSAs given in April 2015. In mathematics, just 34% of 5th grade students showed on grade level skills. No fifth grade writing scores were reported. In 4th grade, 49% were on grade level in reading, while only 20% showed on grade level math skills. In science, 65% of fourth graders showed on grade level understanding. Among third (3rd) graders, just 49% were on grade level in reading and 28% were on grade level in mathematics.[200] Statewide 61.9% of fifth (5th) graders were on grade level in reading, while 42.8% demonstrated on grade level math skills. Pennsylvania 4th graders were 58.6% on grade level in reading and 44.4% demonstrated on grade level math skills. In science, 77.3% of fourth graders showed on grade level understanding. Among Pennsylvania third (3rd) graders, 62% were reading on grade level, while 48.5% demonstrated on grade level math skills.[201]
- 2014 School Performance Profile
Carroll Elementary School achieved a score of 72.1 out of 100. The score reflects on grade level: reading, science, writing and mathematics achievement. In 2013-14, only 62% of the students were reading on grade level in grades 3rd through 5th. In 3rd grade, 67.2% of the pupils were reading on grade level. In math, 67% were on grade level (3rd-5th grades). In 4th grade science, just 68.8% of the pupils demonstrated on grade level understanding. In writing, only 63% of 5th grade pupils demonstrated on grade level skills.[202]
- 2013 School Performance Profile
Carroll Elementary School achieved a score of 77.1 out of 100. The score reflects on grade level: reading, science, writing and mathematics achievement. In 2012-20, only 60% of the students were reading on grade level in grades 3rd through 5th. In 3rd grade, 74% of the pupils were reading on grade level. In math, just 66% were on grade level (3rd-5th grades). In 4th grade science, 76% of the pupils demonstrated on grade level understanding. In writing only 60% of 5th grade pupils demonstrated on grade level writing skills.[203]
- AYP History
In 2012, Carroll Elementary School declined to Warning AYP status due to lagging student achievement in reading and mathematics.[204] From 2003 through 2011 - achieved AYP status each school year.[205] In 2011, 2010 and 2009 the attendance rate was 94%.[206]
- PSSA Results
|
|
|
|
- 4th Grade Science:
- 2012 - 64% (15% below basic). State - 82%
- 2011 - 74% (6% below basic). State – 82.9%
- 2010 - 79%, State - 81%
- 2009 - 70%, State - 83%
- 2008 - 83%, State - 81%
|
|
New Bloomfield Elementary School
New Bloomfield Elementary School is located 300 West High Street, New Bloomfield. In 2016, the School's enrollment declined further to 400 pupils in grades Kindergarten through 5th, with 38.5% of pupils receiving a federal free or reduced price meals due to family poverty. Additionally, 15.7% of the pupils receive special education services, while 1% are identified as gifted.[213]
In 2014, New Bloomfield Elementary School's enrollment was 416 pupils in grades kindergarten through 5th, with 40% of pupils receiving a federal free or reduced price meals due to family poverty.[214] In 2013, New Bloomfield Elementary School's enrollment was 455 pupils in grades kindergarten through 5th, with 43% of pupils receiving a federal free or reduced price meals due to family poverty. Additionally, 14% of the pupils receive special education services, while 1% are identified as gifted.[215] According to a report by the Pennsylvania Department of Education, 100% of the teachers were rated highly qualified under No Child Left Behind. The school provides full day kindergarten in 2013.[216] The school is a federally designated Title I school.
According to the National Center for Education Statistics, in 2010, New Bloomfield Elementary School had 437 pupils enrolled in grades kindergarten through 5th, with 146 students eligible for a federal free or reduced-price lunch due to family poverty. The school employed 31 teachers, for a student–teacher ratio of 14:1.[217] According to a report by the Pennsylvania Department of Education, 100% of its teachers were rated "Highly Qualified" under No Child Left Behind.[218]
- 2016 School Performance Profile
SPP 75.7 out of 100 points. New Bloomfield Elementary School PSSA mandated testing results were: 61% of students in 5th grade were on grade level in reading, while just 52% of students demonstrated on grade level mathematics skills. In 4th grade, 64% were on grade level in reading, while 61% demonstrated on grade level math skills. In science, 86% of fourth grade pupils demonstrated on grade level understanding of science concepts in the state standards. Among the school's third graders, 70% were on grade level in reading and 54% showed on grade level mathematics skills.[173][174]
- 2015 School Performance Profile
According to the Pennsylvania Department of Education, 60% of 5th grade students at New Bloomfield Elementary School were on grade level in reading on the PSSAs given in April 2015. In mathematics, just 42% of 5th grade students showed on grade level skills. No fifth grade writing scores were reported. In 4th grade, 58% were on grade level in reading, while 58% showed on grade level math skills. In science, 82% of fourth graders showed on grade level understanding. Among third (3rd) graders, 62% were on grade level in reading and 58% were on grade level in mathematics.[219] Statewide 61.9% of fifth (5th) graders were on grade level in reading, while 42.8% demonstrated on grade level math skills. Pennsylvania 4th graders were 58.6% on grade level in reading and 44.4% demonstrated on grade level math skills. In science, 77.3% of fourth graders showed on grade level understanding. Among Pennsylvania third (3rd) graders, 62% were reading on grade level, while 48.5% demonstrated on grade level math skills.[220]
- 2014 School Performance Profile
New Bloomfield Elementary School achieved a School Performance Score of 75 out of 100. The score reflects on grade level: reading, science, writing and mathematics achievement. In 2013-14, only 63.5% of the students were reading on grade level in grades 3rd through 5th. In 3rd grade, 66% of the pupils were reading on grade level. In math, 74.5% were on grade level (3rd-5th grades). In 4th grade science, 81% of the pupils demonstrated on grade level understanding. In writing, only 57.8% of 5th grade pupils demonstrated on grade level skills.[221]
- 2013 School Performance Profile
New Bloomfield Elementary School achieved a score of out of 100. The score reflects on grade level: reading, science, writing and mathematics achievement. In 2012-13, only 62% of the students were reading on grade level in grades 3rd through 5th. In 3rd grade, 78% of the pupils were reading on grade level. In math, only 71% were on grade level (3rd-5th grades). In 4th grade science, just 78% of the pupils demonstrated on grade level understanding. In writing only 44% of 5th grade pupils demonstrated on grade level writing skills.[222]
- AYP History
In 2012, New Bloomfield Elementary School declined to Warning AYP status due to lagging student achievement in reading and mathematics.[223] In 2011 and 2010, New Bloomfield Elementary School achieved AYP status.[224] In 2010, New Bloomfield Elementary School reported a 95% attendance rate. In 2009 the attendance rate was also 95%.[225]
PSSA History:
|
|
|
|
- 4th Grade Science:
- 2012 - 84% (2% below basic). State - 82%
- 2011 - 84% (2% below basic), State – 82.9%
- 2010 - 84%, State – 81%
- 2009 - 86%, State – 83%
- 2008 - 84%, State – 81%
|
|
Special education
In December 2015, West Perry School District administration reported that 389 pupils or 15.6% of the district's pupils received Special Education services, with 42.9% of identified students having a specific learning disability.[232]
In 2012, West Perry School District administration reported that 411 pupils or 15.9% of the district's pupils received Special Education services, with 49.1% of identified students having a specific learning disability.[233]
In 2011, the District's administration reported that 428 pupils or 16.4% of the district's pupils received special education services, with 46% of identified students having a specific learning disability. In December 2009, the District's administration reported that 466 pupils or 17% of the district's pupils received special education services.[234]
In the fall of the 2010-11 school year, West Perry School District initiated full-day kindergarten[235] Proponents of full day kindergarten claim it will reduce special education numbers and it will raise primary student academic achievement especially in reading and math.[198] Those outcomes have not been realized in the West Perry School District. Reading achievement has not improved, with just 65% of elementary school students reading on grade level.[236]
The District engages in identification procedures to ensure that eligible students receive an appropriate educational program consisting of special education and related services, individualized to meet student needs. At no cost to the parents, these services are provided in compliance with state and federal law; and are reasonably calculated to yield meaningful educational benefit and student progress. To identify students who may be eligible for special education, various screening activities are conducted on an ongoing basis. These screening activities include: review of group-based data (cumulative records, enrollment records, health records, report cards, ability and achievement test scores); hearing, vision, motor, and speech/language screening; and review by the Instructional Support Team or Student Assistance Team. When screening results suggest that the student may be eligible, the District seeks parental consent to conduct a multidisciplinary evaluation. Parents who suspect their child is eligible may verbally request a multidisciplinary evaluation from a professional employee of the District or contact the Special Education Department.[237]
In 2010, the state of Pennsylvania provided $1,026,815,000 for special education services. The funds were distributed to districts based on a state policy which estimates that 16% of the district's pupils are receiving special education services. This funding is in addition to the state's basic education per pupil funding, as well as, all other state and federal funding.[238] Total funds that are received by school districts are calculated through a formula. The Pennsylvania Department of Education oversees four appropriations used to fund students with special needs: Special Education; Approved Private Schools; Pennsylvania Chartered Schools for the Deaf and Blind; and Early Intervention. The Pennsylvania Special Education funding system assumes that 16% of the district’s students receive special education services. It also assumes that each student’s needs accrue the same level of costs.[239] Over identification of students, in order to increase state funding, has been an issue in the Commonwealth. Some districts have more than 20% of its students receiving special education services while others have 10% supported through special education.[240] The state requires each public school district and charter school to have a three-year special education plan to meet the unique needs of its special education students.[241] In 2012, the Obama Administration's US Department of Education issued a directive that schools include students with disabilities in extracurricular activities, including sports.[242]
West Perry School District received a $1,684,745 supplement for special education services in 2010-2011.[243] For the 2011-2012, 2012–2013, 2013–2014 and 2014-2015 school years, all Pennsylvania public school districts received the same level of funding for special education that they received in 2010-11. This level funding is provided regardless of changes in the number of pupils who need special education services and regardless of the level of services the respective students required.[244][245] For the 2014-2015 school year, West Perry School District received an increase to $1,710,474 from the Commonwealth for special education funding.[246]
Additionally, the state provides supplemental funding for extraordinarily impacted students. The District must apply for this added funding.
Gifted education
The District Administration reported that 76 or 2.85% of its students were gifted in 2009.[247] By law, the district must provide mentally gifted programs at all grade levels. The primary emphasis is on enrichment and acceleration of the regular education curriculum. Students identified as gifted attending the High School have access to dual enrollment with local colleges. The referral process for a gifted evaluation can be initiated by teachers or parents by contacting the student’s building principal and requesting an evaluation. All requests must be made in writing. To be eligible for mentally gifted programs in Pennsylvania, a student must have a cognitive ability of at least 130 as measured on a standardized ability test by a certified school psychologist. Other factors that indicate giftedness will also be considered for eligibility.[248]
Budget
Pennsylvania public school districts budget and expend funds according to procedures mandated by the General Assembly and the Pennsylvania Department of Education (PDE). An annual operating budget is prepared by school district administrative officials. A uniform form is furnished by the PDE and submitted to the board of school directors for approval prior to the beginning of each fiscal year on July 1.
Under Pennsylvania’s Taxpayer Relief Act, Act 1 of the Special Session of 2006, all school districts of the first class A, second class, third class and fourth class must adopt a preliminary budget proposal. The proposal must include estimated revenues and expenditures and the proposed tax rates. This proposed budget must be considered by the Board no later than 90 days prior to the date of the election immediately preceding the fiscal year. The preliminary budget proposal must also be printed and made available for public inspection at least 20 days prior to its adoption. The board of school directors may hold a public hearing on the budget, but are not required to do so. The board must give at least 10 days’ public notice of its intent to adopt the final budget according to Act 1 of 2006.[249]
In June 2016, West Perry School board reduced overstaffing by eliminating 14 teaching positions as well as other non teching staff positions. The board approved increasing Superintendent Michael O'Brien's salary to $136,997 for the 2016-17 school year.[250]
In 2013, the average teacher salary in the West Perry School District was $52,864 a year, while the cost of the benefits teachers received was $19,832 per employee, for a total annual average teacher compensation of $72,697.[251] The District employed 239 teachers and administrators with a top salary of $107,000.[252] West Perry School District teacher and administrator retirement benefits are equal to at least 2.00% x Final Average Salary x Total Credited Service. (Some teachers benefits utilize a 2.50% benefit factor.) [253] After 40 years of service, a teacher can retire with 100% of the average salary of their final 3 years of employment. According to a study conducted at the American Enterprise Institute, in 2011, public school teachers’ total compensation is roughly 50 percent higher than they would likely receive in the private sector. The study found that the most generous benefits that teachers receive are not accounted for in many studies of compensation including: pension, retiree health benefits and job security.[254]
In 2011, the average teacher salary in West Perry School District was $50,485 a year, while the cost of the benefits teachers received was $18,312 per employee, for a total annual average teacher compensation of $68,797.[255] The District employed 230 teachers and administrators with a top salary of $107,000.[256]
In 2007, West Perry School District employed 196 teachers. The average teacher salary in the district was $47,052 for 180 days worked.[257] As of 2007, Pennsylvania ranked in the top 10 states in average teacher salaries. When adjusted for cost of living Pennsylvania ranked fourth in the nation for teacher compensation.[258] Additionally, the teachers receive a defined benefit pension, health insurance, professional development reimbursement, paid personal days, 10 paid sick days, a retirement bonus and other benefits.[259] According to State Rep. Glen Grell, a trustee of the Pennsylvania Public School Employees’ Retirement System Board, a 40-year educator can retire with a pension equal to 100 percent of their final salary.[260] In 2009 the teacher salary range is reported as $36,644 to $67,566.[261][262]
Administrative costs West Perry School District administrative costs per pupil were $652.85 in 2008. The lowest administrative cost per pupil in Pennsylvania was $398 per pupil.[263] In 2009, the district reported that the superintendent's salary was $101,000.[262]
Per pupil spending In 2008, the West Perry School District spent $11,499 per pupil which ranked 342nd out of Pennsylvania's 500 school districts.[264] In 2010, the per pupil spending had increased to $12,012.40 which ranked 372nd in the Commonwealth.[265] Among the states, Pennsylvania’s total per pupil revenue (including all sources) ranked 11th at $15,023 per student, in 2008-09.[266] In 2007, the Pennsylvania per pupil total expenditures was $12,759.[267]
Reserves In 2008, the administration reported that the school district has $6,006,651.[268] In 2010, the District had $6,796,104.00 in unreserved undesignated fund account and $300,000 in an unreserved designated account. In 2012, the West Perry School District reported having $9,283,197 in reserves, with $6,558,197 in unreserved funds. Pennsylvania public school district reserve funds are divided into two categories – designated and undesignated. The undesignated funds are not committed to any planned project. Designated funds and any other funds, such as capital reserves, are allocated to specific projects. School districts are required by state law to keep 5 percent of their annual spending in the undesignated reserve funds to preserve bond ratings. According to the Pennsylvania Department of Education, from 2003 to 2010, as a whole, Pennsylvania school districts amassed nearly $3 billion in reserved funds.[269] By 2013, reserves held by Pennsylvania public school districts, as a whole, had increased to over $3.8 billion.[270][271][272] In 2014, West Perry School Board reported the District had $10,001,141 in reserves.[273] By 2015 the District's reserves had risen to $11,197,371.[274] The District’s reserves are 31.72% of its budget exceeding state regulation limits of 8%.[275]
Audits In November 2010, the Pennsylvania Auditor General conducted a performance audit of the district. Findings were reported to the administration and school board.[276] In April 2013, the district was audited again. It was found that West Perry School District (WPSD) personnel were not able to provide all the documents necessary to verify the accuracy of pupil membership data reported to PDE for the 2009–10 and 2008-09 school years.
Tuition Students who live in the West Perry School District's attendance area may choose to attend one of Pennsylvania's 157 public charter schools. A student living in a neighboring public school district or a foreign exchange student may seek admission to West Perry School District. For these cases, the Pennsylvania Department of Education sets an annual tuition rate for each school district. It is the amount the public school district pays to a charter school for each resident student that attends the charter and it is the amount a nonresident student's parents must pay to attend the West Perry School District's schools. The 2012 tuition rates are Elementary School - $7,477.04, High School - $10,138.63.[277]
West Perry School District is funded by a combination of: a local earned income tax 1.70%,[278] a local real property tax, a real estate transfer tax 0.5%, and two per capita taxes $5 each, coupled with substantial funding from the Commonwealth of Pennsylvania and the federal government.[279] Grants provide an opportunity to supplement school funding without raising local taxes. In the Commonwealth of Pennsylvania, both pension income and Social Security income are exempted from state personal income tax and local earned income tax regardless of the individual's wealth.[280] The average Pennsylvania public school teacher pension in 2011 exceeds $60,000 a year plus they receive federal Social Security benefits: both are free of Pennsylvania state income tax and local income tax which funds local public schools.[281]
State basic education funding
According to a report from Representative Todd Stephens office, West Perry School District receives 45.5% of its annual revenue from the state.[282]
In December 2014, the Pennsylvania Education Funding Reform Commission conducted a hearing. The commission developed a new basic education funding formula which sets a new way to distribute state basic education dollars. It abolished the practice of "hold harmless" funding, which gave districts at least the same as they got the previous school year regardless of declining enrollment. The plan became law in June 2016 (House Bill 1552).[283][284][285]
For the 2017-18 school year, West Perry School District received $8,705,408 in Basic Education Funding from the Commonwealth of Pennsylvania. Pennsylvania again increased its public education spending to a record high of $5.995 billion. It was a $100 million increase, 1.7% increase over the 2016-17 state appropriation.[286] Additionally, the state continued to fund its Ready to Learn grants at $250 million and Special Education funding received a $25 million increase to $1,121 billion.[287] The state also paid $529,5 million to the school employee social security fund and another $2.304 billion to the teacher’s pension fund, an increase of 7.6% over the state’s 2016-17 payment.[288]
For the 2016-17 school year, West Perry School District received an increase to $8,622,911 in Basic Education Funding from the Commonwealth of Pennsylvania. This is a 2.1% increase over 2015-16 funding to the District. The highest percentage of BEF increase in Perry County was 2.2% awarded to both Greenwood School District and Newport School District, under the state’s Basic Education Funding formula. For the 2016-17 school year, Pennsylvania increased its public education spending to a record high of $5,895 billion. It was a $200 million increase, 3.51% increase over the 2015-16 appropriation.[289] The state also funded Ready to Learn grants at $250 million and Special Education funding received a $20 million increase.[290] The state also paid $492 million to the school employee social security fund and another $2.064 billion to the teacher’s pension fund.[291] Statewide Conestoga Valley School District received a 13.3% increase in state BEF funding. Five PA public school districts received an increase of 10% or greater in Basic Education funding over their 2015-16 funding. The District also received $394,553 in Ready To Learn funds and an increase in special education funding from the state.
For the 2015-16 school year, Governor Tom Wolf released a partial Basic Education Funding of $4,188,392 to West Perry School District, in January 2016.[292] This was part of $10.3 billion in school funding withheld from the public schools, by the Governor since the summer of 2015.[293] The dispersement did not follow the new Basic Education Fair Funding formula which had been established by the Pennsylvania General Assembly in June 2015.[294]
In compliance with a legislative mandate that was passed with veto proof majorities in the PA House and Senate,[295] the final BEF funding was determined for 2015-16, in April 2016. West Perry School District received $8,936,940 in Basic Education Funds for the 2015-16 school year. This was a 3.6% increase yielding a $136,579 increase over the previous school year funding. The District also received $310,655 in Ready to Learn funding from the state.[296]
For the 2014-15 school year, West Perry School District received $8,313,618 in State Basic Education funding. The District also received $154,147 in Accountability Block Grant funding and $155,755 in the new created Ready To Learn Block grant. The State’s enacted Education Budget includes $5,526,129,000 for the 2014-2015 Basic Education Funding.[297] The Education budget also includes Accountability Block Grant funding at $100 million and $241 million in new Ready to Learn funding for public schools that focus on student achievement and academic success. The State is paying $500.8 million to Social Security on the school employees behalf and another $1.16 billion to the state teachers pension system (PSERS). In total, Pennsylvania’s Education budget for K-12 public schools is $10 billion. This was a $305 million increase over 2013-2014 state spending and the greatest amount ever allotted by the Commonwealth for its public schools.[298]
In the 2013-14 school year, the West Perry School District received a 2% increase or $8,310,055 in Pennsylvania Basic Education Funding. This is $162,922 more than its 2012-2013 state BEF to the District. This was the highest percentage increase awarded to the public school district in Perry County. Additionally, West Perry School District received $154,147 in Accountability Block Grant funding to focus on academic achievement and level funding for special education services. The District has the option of applying for several other state and federal grants to increase revenues. The Commonwealth’s budget increased Basic Education Funding statewide by $123 million to over $5.5 billion. Most of Pennsylvania’s 500 public school districts received an increase of Basic Education Funding in a range of 0.9% to 4%. Eight public school districts received exceptionally high funding increases of 10% to 16%. The highest increase in state funding was awarded to Austin Area School District which received a 22.5% increase in Basic Education Funding.[299] The state funded the PSERS (Pennsylvania school employee pension fund) with $1,017,000,000 and Social Security payments for school employees of $495 million.[300]
For the 2012-13 school year, West Perry School District received $8,147,133.[301] The Governor's Executive Budget for 2012-2013 included $9.34 billion for kindergarten through 12th grade public education, including $5.4 billion in basic education funding, which was an increase of $49 million over the 2011-12 budget. In addition, the Commonwealth provided $100 million for the Accountability Block Grant (ABG) program. West Perry School District received $8,147,133. The state also provided a $544.4 million payment for School Employees’ Social Security and $856 million for School Employees’ Retirement fund called PSERS.[302] This amount was a $21,823,000 increase (0.34%) over the 2011-2012 appropriations for Basic Education Funding, School Employees' Social Security, Pupil Transportation, Nonpublic and Charter School Pupil Transportation. Since taking office, Corbett’s first two budgets have restored more than $918 million in support of public schools, compensating for the $1 billion in federal stimulus dollars lost at the end of the 2010-11 school year.
In the 2011-12 school year, West Perry School District received $8,153,693 in state Basic Education Funding.[303][304] Additionally, West Perry School District received $154,147 in Accountability Block Grant funding. The enacted Pennsylvania state Education budget includes $5,354,629,000 for the 2011-2012 Basic Education Funding appropriation. This amount is a $233,290,000 increase (4.6%) over the enacted State appropriation for 2010-2011. The highest increase in state basic education funding was awarded to Duquesne City School District, which got a 49% increase in state funding for 2011-12.[305] Districts experienced a reduction in funding, due to the loss of federal stimulus funding which ended in 2011.
For 2010–11 school year, the West Perry School District received a 5.14% increase in state Basic Education Funding for a total of $9,026,262. This was the highest increase given to the school districts in Perry County. One hundred and fifty Pennsylvania school district received the base 2% increase. The highest increase was given to Kennett Consolidated School District of Chester County which received a 23.655 increase in state funding.[306] This was the second year of Governor Rendell’s policy to fund some public school districts at a far greater rate than others. The amount of increase each Pennsylvania public school district received was determined by then Governor Edward G. Rendell and Secretary of Education Gerald Zahorchak, through the allocation set in the state budget proposal made in February each year.[307] In 2010, the District reported that 846 pupils received a free or reduced-price lunch due to the family meeting the federal poverty level.
In the 2009–2010 budget, the Commonwealth of Pennsylvania provided West Perry School District a 5.60% increase in Basic Education Funding (BEF) for a total of $8,622,711. This was a higher increase, in Basic Education Funding, than the two other school districts in Perry County received for 2009-2010. Susquenita School District got a 6.39% increase in BEF in 2009. Fifteen Pennsylvania public school districts received BEF increases that exceeded 10%. Muhlenberg School District in Berks County received the highest, a 22.31% increase, in Basic Education Funding from the state.[308]
The state Basic Education funding to the West Perry School District in 2008–09 was $8,165,782.58. According to the Pennsylvania Department of Education, 724 district students received free or reduced-price lunches due to low family income in the 2007–2008 school year.[309]
All Pennsylvania public school districts also receive additional funding from the state through several other funding allocations, including: Reimbursement of Charter School Expenditures; Special Education Funding; Secondary Career & Technical Education Subsidy; PA Accountability Grants; and low achieving schools were eligible for Educational Assistance Program Funding. Plus all Pennsylvania school districts receive federal dollars for various programs including: Special Education funding and Title I funding for children from low income families. In 2010, Pennsylvania spent over $24 billion for public education - local, state and federal dollars combined.[310]
Accountability Block Grants
Beginning in 2004-2005, the state launched the Accountability Block Grant school funding. This program has provided $1.5 billion to Pennsylvania’s school districts. The Accountability Block Grant program requires that its taxpayer dollars are focused on specific interventions that are most likely to increase student academic achievement. These interventions include: teacher training, all-day kindergarten, lower class size K-3rd grade, literacy and math coaching programs that provide teachers with individualized job-embedded professional development to improve their instruction, before or after school tutoring assistance to struggling students. For 2010-2011, West Perry School District applied for and received $418,383 in addition to all other state and federal funding. The West Perry School District used the funding to provide teacher training to improve instruction; to provide assistance to struggling students and to pay teachers to develop new curriculum offerings in science and technology.[311][312] In the 2014-15 school year the State shifted the program and grants to Ready to Learn.
Ready to Learn grant
Beginning in the 2014-2015 budget, the State funded a new Ready to Learn Grant for public schools. A total of $100 million is allocated through a formula to districts based on the number of students, level of poverty of community as calculated by its market value/personal income aid ratio (MV/PI AR) and the number of English language learners. Ready to Learn Block Grant funds may be used by the Districts for: school safety; Ready by 3 early childhood intervention programs; individualized learning programs; and science, technology, engineering and math (STEM) programs.[313]
In 2016-17, West Perry School District received $394,553 in Ready to Learn Grant dollars in addition to State Basic Education funding, Special Education funding, transportation reimbursement, reimbursement for Social Security payments for employees and other state grants which the district must apply for to receive.[314]
Education Assistance grant
The state's EAP funding provides for the continuing support of tutoring services and other programs to address the academic needs of eligible students. Funds are available to eligible school districts and full-time career and technology centers (CTC) in which one or more schools have failed to meet at least one academic performance target, as provided for in Section 1512-C of the Pennsylvania Public School Code. In 2010–11 the West Perry School District received $105,642.[315]
Classrooms for the Future grant
The Classroom for the Future state program provided districts with hundreds of thousands of extra state funding to buy laptop computers for each core curriculum high school class (English, Science, History, Math), along with other specialized equipment and provided funding for teacher training to optimize the use of the computers. The program was funded from 2006–2009. West Perry School District did not receive funding in 2006–07. It was approved for $305,953 in 2007–08. The District received $55,646 in 2008–09.[316] Among the public school districts in Perry County the highest CFF award was given to West Perry School District. The highest funding statewide was awarded to Philadelphia City School District in Philadelphia County - $9,409,073. The grant program was discontinued by Governor Edward Rendell as part of the 2009-10 state budget.
Literacy grant
West Perry School District was awarded a $756,516 competitive literacy grant. It is to be used to improve student reading skills birth through 12th grade. The district was required to develop a lengthy literacy plan, which included outreach into the community. The funds come from a Striving Readers Comprehensive Literacy grant, also referred to as the Keystones to Opportunity grant It is a five-year, competitive federal grant program designed to assist local education agencies in developing and implementing local comprehensive literacy plans. Of the 329 pre-applications by school districts reviewed by the Pennsylvania Department of Education, School District was one of only 148 entities that were invited to submit a full application. In Perry County, only one school district was awarded funding for one year.[317] The funds must be used for teacher training, student screening and assessment, targeted interventions for students reading below grade level and research-based methods of improving classroom instruction and practice. Districts must hire literacy coaches. The coaches work with classroom teachers to enhance their literacy teaching skills. Pennsylvania was among six other states, out of the 35 that applied, to be awarded funding. Pennsylvania received $38 million through the federal program. The Department of Education reserved 5% of the grant for administration costs at the state level. The top Pennsylvania grant recipient was Pittsburgh School District which was awarded $1,9983,014.
Ready to Learn grant
Beginning in the 2014-2015 budget, the State funded a new Ready to Learn Grant for public schools. A total of $100 million is allocated through a formula to districts based on the number of students, level of poverty of community as calculated by its market value/personal income aid ratio (MV/PI AR) and the number of English language learners. Ready to Learn Block Grant funds may be used by the Districts for: school safety; Ready by 3 early childhood intervention programs; individualized learning programs; and science, technology, engineering and math (STEM) programs.[318]
West Perry School District will receive $155,755 in Ready to Learn Grant dollars, in addition to State Basic Education funding, Special Education funding, Accountability Block Grant funding, PreK Counts funding, reimbursement for Social Security payments for employees and other state grants which the district must apply to receive.
Other grants
West Perry School District did not participate in: Pennsylvania Department of Environmental Protection's Environmental Education annual grants;[319] PA Science Its Elementary grants (discontinued effective with 2009-2010 budget by Governor Rendell);[320] 2012 and 2013 Pennsylvania Hybrid Learning Grants;[321] Project 720 High School Reform grants (discontinued effective with 2011-12 budget); nor the federal 21st Century Learning grants.
Federal Stimulus grant
West Perry School District received an extra $1,902,762 in ARRA – Federal Stimulus money to be used in specific programs like special education and meeting the academic needs of low-income students.[322] According to the Pennsylvania Department of Education, 724 students in the district received free or reduced meals due to low family income in 2008.[323] The funding was limited to the 2009–10 and 2010-2011 school years.[324] Due to the temporary nature of the funding, schools were repeatedly advised to use the funds for one-time expenditures like acquiring equipment, making repairs to buildings, training teachers to provide more effective instruction or purchasing books and software.
Race to the Top grant
West Perry School District officials did not apply for the Race to the Top federal grant which would have brought the district up to one million additional federal dollars for improving student academic achievement.[325] Participation required the administration, the school board and the local teachers' union to sign an agreement to prioritize improving student academic success.[326] In Pennsylvania, 120 public school districts and 56 charter schools agreed to participate.[327] Pennsylvania was not approved for the grant. According to then Governor Rendell, failure of districts to agree to participate was cited as one reason that Pennsylvania was not approved.[328]
Common Cents state initiative
The school board elected to not participate in the Pennsylvania Department of Education Common Cents program. The program called for the state to audit the district, at no cost to local taxpayers, to identify ways the district could save tax dollars.[329] After the review of the information, the district was not required to implement the recommended cost savings changes.
Enrollment
Since 2005, enrollment at West Perry School District has declined by more than 300 pupils.[330]
In February 2009, Governor Edward Rendell proposed that Pennsylvania consolidate its 500 schools districts to 100 districts. He argued that consolidation with adjacent school districts would achieve substantial cost savings. Consolidation of two central administrations into one would not require the closing of any schools. The proposal called for the savings to be redirected to improving lagging student academic achievement, to enriching the academic programs or to reducing residents' property taxes.[331] In March 2011, the Pennsylvania Institute of Certified Public Accountants Fiscal Responsibility Task Force released a report which found that consolidating school district administrations with one neighboring district would save the Commonwealth $1.2 billion without forcing the consolidation of any schools.[332]
Pennsylvania has one of the highest numbers of school districts in the nation. In Pennsylvania, 80% of the school districts serve student populations under 5,000, and 40% serve less than 2,000. Less than 95 of Pennsylvania's 501 school districts have enrollment below 1250 students, in 2007.[333] This results in excessive school administration bureaucracy and not enough course diversity.[334] In a survey of 88 superintendents of small districts, 42% of the respondents stated that they thought consolidation would save money without closing any schools.[335] A study of Pennsylvania public school spending, conducted by Standard and Poor's, examined the consolidation of small public school districts in Pennsylvania in 2007. The study found that consolidation of the administration with an adjacent school district would achieve substantial administrative cost savings which varied by district.[336] Pennsylvania had 2,361 public school districts in 1959. The state compelled mergers reducing the number to 505 by 1980. Mergers slowed through the 1980s after a 1981 court order desegregated and combined the Edgewood, General Braddock, Swissvale, Churchill and Turtle Creek districts into the Woodland Hills district.[337]
From 2000 through 2010, rural Pennsylvania public school district enrollment has decreased by 8 percent.[338] In 2010, there were 726,417 children in rural Pennsylvania, or 21 percent of the total rural population. From 2000 to 2010, the number of children in rural counties decreased 7 percent. The decline in the number of children impacted most rural counties with 42 of Pennsylvania’s 48 rural counties experiencing a decline. Cameron County, Elk County and Sullivan County experienced the greatest declines, with a decrease of more than 21 percent in all three counties. Perry County's live birth rate was 609 births in 1990. Perry County's live birth rate in 2000 declined to 511 births, while in 2011 the live birth rate was 555 babies.[339] Over the past 50 years (1960 to 2010), rural Pennsylvania saw a steady decline in both the number and proportion of residents under 18 years old. In 1960, 1.06 million rural residents, or 35 percent of the rural population, were children.
Real estate taxes
The West Perry School Board increased the property tax to 11.4300 mills for the 2016-17 budget year.[340] A mill is $1 of tax for every $1,000 of a property's assessed value. Property taxes, in the Commonwealth of Pennsylvania, apply only to real estate - land and buildings. The property tax is not levied on cars, business inventory, or other personal property. Certain types of property are exempt from property taxes, including: places of worship, places of burial, private social clubs, charitable and educational institutions and government property. Irregular property reassessments have become a serious issue in the commonwealth as it creates a significant disparity in taxation within a community and across a region. Additionally, service related, disabled US military veterans may seek an exemption from paying property taxes. Unlike other states, under Pennsylvania state tax policy, natural gas and oil pipelines are exempted from property taxes.[341][342]
Pennsylvania school district local revenues are dominated by two main sources: 1) Property tax collections, which account for the vast majority (between 75-85%) of local revenues; and 2) Act 511 tax collections, which are around 15% of revenues for school districts.[343] Irregular property reassessments have become a serious issue in the Commonwealth as it creates a significant disparity in taxation within a community and across a region. When a Pennsylvania public school district includes municipalities in two or more counties, each of which has different rates of property tax assessment, a state board equalizes the tax rates between the counties.[344] In 2010, miscalculations by the State Tax Equalization Board (STEB) were widespread in the Commonwealth and adversely impacted funding for many school districts, including those that did not cross county borders.[345]
|
|
According to a report prepared by the Pennsylvania Department of Education, the total real estate taxes collected by all school districts in Pennsylvania rose from $6,474,133,936 in 1999-00 to $10,438,463,356 in 2008-09 and to $11,153,412,490 in 2011.[356] Property taxes in Pennsylvania are relatively high on a national scale. According to the Tax Foundation, Pennsylvania ranked 11th in the U.S. in 2008 in terms of property taxes paid as a percentage of home value (1.34%) and 12th in the country in terms of property taxes as a percentage of income (3.55%).[357]
Act 1 Index
The Special Session Act 1 of 2006 Index regulates the rates at which each school district can raise property taxes in Pennsylvania. Districts are not permitted to raise taxes above that index unless they allow voters to vote by referendum, or they seek an exception from the state Department of Education. The base index for the 2011–2012 school year is 1.4 percent, but it can be adjusted higher on a per district basis by the Pennsylvania Department of Education, depending on a number of factors, such as local property values (Market Aid Ratio) and the personal income of district residents. Act 1 included 10 exceptions, including: increasing pension costs, increases in special education costs, a catastrophe like a fire or flood, increasing health care costs for contracts in effect in 2006 or dwindling tax bases. The base index is the average of the percentage increase in the statewide average weekly wage, as determined by the PA Department of Labor and Industry, for the preceding calendar year and the percentage increase in the Employment Cost Index for Elementary and Secondary Schools, as determined by the Bureau of Labor Statistics in the U.S. Department of Labor, for the previous 12-month period ending June 30. For a school district with a market value/personal income aid ratio (MV/PI AR) greater than 0.4000, its index equals the base index multiplied by the sum of .75 and its MV/PI AR for the current year.[358]
The School District Adjusted Index for the West Perry School District 2006–2007 through 2010–2011.[359]
|
|
For the 2016-17 budget year, West Perry School Board applied for two exceptions to exceed the District's Act 1 Index limit: rising special education costs and escalating teacher pension costs.[370] In 2016-17, all Pennsylvania school districts were required to make a 32% of payroll payment to the teacher’s pension fund (PSERS). Statewide 299 school districts adopted a resolution to not exceed their Act I index in 2016-17. In 2016-17, all Pennsylvania public school districts were required to make a 30.03% of payroll payment to the teacher’s pension fund (PSERS).[371] This was in addition to the 6.02% social security employer match payment.[372]
For the 2015-16 budget year, West Perry School Board did not apply for an exception to exceed their Act 1 Index limit. For the school budget 2015-16, 310 Pennsylvania public school districts adopted a resolution certifying that tax rates would not be increased above its Act 1 Index limit. Another 187 school districts adopted a preliminary budget leaving open the option of exceeding the Index limit. Regarding the pension costs exception, 172 school districts received approval to exceed the Index limit in full, while others received a partial approval of their request. For special education costs, 119 districts received approval to exceed their tax limit. No Pennsylvania public school districts received an approval for the grandfathered construction debts exception.[373]
For the 2014-15 budget year, West Perry School Board did not apply for exceptions to exceed their Act 1 Index limit. In 2014-15, all Pennsylvania school districts were required to make a 21.4% of payroll payment to the teacher’s pension fund (PSERS).[374] For the school budget 2014-15, 316 Pennsylvania public school districts adopted a resolution certifying that tax rates would not be increased above its Act 1 Index limit. Another 181 school districts adopted a preliminary budget leaving open the option of exceeding the Index limit. Districts may apply for multiple exceptions each year. For the pension costs exception, 163 school districts received approval to exceed the Index in full, while others received a partial approval of their request. For special education costs, 104 districts received approval to exceed their tax limit. Seven Pennsylvania public school districts received an approval for the grandfathered construction debts exception.[375]
For the 2013-14 budget year, West Perry School Board did not apply for exceptions to exceed their Act 1 Index limit. For the school budget year 2013-14, 311 Pennsylvania public school districts adopted a resolution certifying that tax rates would not be increased above their index. Another 171 school districts adopted a preliminary budget leaving open the option of exceeded the Index limit. For the exception for pension costs, 89 school districts received approval to exceed the Index in full while others received a partial approval of their request. For special education costs, 75 districts received approval to exceed their tax limit. For the pension costs exception, 169 school districts received approval to exceed the Index. Eleven Pennsylvania public school districts received an approval for grandfathered construction debts.[376]
For the 2012-13 budget year, West Perry School Board applied for 2 exceptions to exceed the Act 1 Index: special education and pension costs. For 2012-2013, 274 school districts adopted a resolution certifying that tax rates would not be increased above their index; 223 school districts adopted a preliminary budget leaving open the option of exceeded the Index limit. For the exception for pension costs, 194 school districts received approval to exceed the Index. For special education costs, 129 districts received approval to exceed the tax limit. For the exception for pension costs, 194 school districts received approval to exceed the Index. For special education costs, 129 districts received approval to exceed the tax limit.[377]
For the 2011-12 school year, the West Perry School Board did not apply for exceptions to exceed the Act 1 Index. Each year the West Perry School Board has the option of adopting either 1) a resolution in January certifying they will not increase taxes above their index or 2) a preliminary budget in February. A school district adopting the resolution may not apply for referendum exceptions or ask voters for a tax increase above the inflation index. A specific timeline for these decisions is publisher each year by the Pennsylvania Department of Education.[378]
According to a state report, for the 2011-12 school year budgets, 247 school districts adopted a resolution certifying that tax rates would not be increased above their index; 250 school districts adopted a preliminary budget. Of the 250 school districts that adopted a preliminary budget, 231 adopted real estate tax rates that exceeded their index. Tax rate increases in the other 19 school districts that adopted a preliminary budget did not exceed the school district’s index. Of the districts who sought exceptions 221 used the pension costs exemption and 171 sought a Special Education costs exemption. Only 1 school district sought an exemption for Nonacademic School Construction Project, while 1 sought an exception for Electoral debt for school construction.[379]
For the 2010-11 budget, West Perry School Board also did not apply for an exception to exceed the Act 1 index limit.[380] In the Spring of 2010, 135 Pennsylvania school boards asked to exceed their adjusted index. Approval was granted to 133 of them and 128 sought an exception for pension costs increases.[381]
Property tax relief
In 2016, West Perry School Board approved 5,383 homestead properties to receive $137 each in gaming tax relief.[382] The amount received by the District, from the State's Gaming Fund, must be divided equally among all approved residences.[383] The relief was subtracted from the total annual school property tax bill. Property owners apply for the relief through the county Treasurer's office. Farmers can qualify for a farmstead exemption on building used for agricultural purposes. The farm must be at least 10 contiguous acres and must be the primary residence of the owner. Farmers can qualify for both the homestead exemption and the farmstead exemption.
In 2013, West Perry School District approved 5,438 homestead properties to receive $136.[384] The decline in amount was related to more residents applying for tax relief and a decline in table games tax revenues.
In 2010, the Homestead/Farmstead Property Tax Relief from gambling for the West Perry School District was $137 per approved permanent primary residence. This was among the lowest amounts awarded in the Commonwealth of Pennsylvania. West Perry School District had 5,403 property owners apply for the tax relief.[385] In 2009, the tax relief was set at $143 for 5,196 property owners. In Perry County, 88% of eligible property owners applied for property tax relief in 2009.[386] Pennsylvania awarded the highest property tax relief to residents of the Chester-Upland School District in Delaware County at $632 per homestead and farmstead in 2010.[387] This was the second year they were the top recipient.
Additionally, the Pennsylvania Property Tax/Rent Rebate program is provided for low income West Perry School District residents aged 65 and older; widows and widowers aged 50 and older; and people with disabilities age 18 and older. The income limit is $35,000 for homeowners. The maximum rebate for both homeowners and renters is $650. Applicants can exclude one-half (1/2) of their Social Security income, so people who make substantially more than $35,000 may still qualify for a rebate. Individuals must apply annually for the rebate.
History
West Perry School District was formed in 1963 from the consolidation of several smaller school districts: Green Park Union, Blain Union, and Perry Joint. The official consolidation took place on July 1, 1964. West Perry High School previously served as Green Park Union High School. West Perry Middle School opened in 1967 as Green Park Elementary.
Blain Elementary School was constructed in 1927 as a grades 1 through 12 school. Carroll Elementary, constructed around 1954, is located in Carroll Township along state Route 34 between New Bloomfield and Shermans Dale. New Bloomfield Elementary, located in the borough of Bloomfield, was constructed in 1950 as Perry Joint High School. It later served as a middle school from the creation of West Perry School District until 2003, at which time the middle school and Green Park Elementary switched functions.
Green and white were selected as the school colors because at the time of the 1963 consolidation, Green Park Union (whose colors were green and white) had just purchased new band uniforms and the district did not want to replace them. Green Park Union's mascot was the Green Hornets. School colors for Perry Joint (located in New Bloomfield) were maroon and grey, with the mascot being the Bobcats.
Bullying Policy
The West Perry School District administration reported there were zero incidents of bullying in the District in 2013. Additionally, there were multiple incidents of assaults on students and staff. There were no sexual incidents involving students. The local law enforcement was involved in thirty-four incidents at the schools, with three arrests.[388] [389] Each year the school safety data is reported by the district to the Safe School Center which then publishes the compiled reports online. Nationally, nearly 20% of pupils report being bullied at school.[390]
In 2008–09, West Perry School District administration reported 14 cases of bullying in the district.[391] The Commonwealth provides annual school safety reports online for community review.[392]
The West Perry School Board prohibits bullying by district students. A policy approved in January 2009 defines bullying and cyberbullying. The Board directs that complaints of bullying shall be investigated promptly, and corrective action shall be taken when allegations are verified. No reprisals or retaliation shall occur as a result of good faith reports of bullying.[393] All Pennsylvania schools are required to have an anti-bullying policy incorporated into their Code of Student Conduct. The policy must identify disciplinary actions for bullying and designate a school staff person to receive complaints of bullying. The policy must be available on the school's website and posted in every classroom. All Pennsylvania public schools must provide a copy of its anti-bullying policy to the Office for Safe Schools every year, and shall review their policy every three years. Additionally, the district must conduct an annual review of that policy with students.[394] The Center for Schools and Communities works in partnership with the Pennsylvania Commission on Crime & Delinquency and the Pennsylvania Department of Education to assist schools and communities as they research, select and implement bullying prevention programs and initiatives.[395]
Education standards relating to student safety and anti-harassment programs are described in the 10.3. Safety and Injury Prevention in the Pennsylvania Academic Standards for Health, Safety and Physical Education.[396]
Extracurriculars
West Perry School District schools offer a wide variety of clubs, activities and an extensive, costly sports program.[397] Eligibility for participation is determined by school board policies.[398][399]
In December 2009, the school board awarded a $735,515 contract to Kinsley Construction of York to resurface the stadium field with synthetic turf and associated renovations to the middle school soccer field.[400] In May 2014, the Board awarded a $286,960 contract to ATT Sports to resurface the high school track.[401]
By Pennsylvania law, all K-12 students in the district, including those who attend a private nonpublic school, cyber charter school, charter school and those homeschooled, are eligible to participate in the extracurricular programs, including all athletics. They must meet the same eligibility rules as the students enrolled in the district's schools.[402][403][404]
According to PA Child Abuse Recognition and Reporting Act 126 of 2014, all volunteer coaches and all those who assist in student activities, must have criminal background checks. Like all school district employees, they must also attend an anti child abuse training once every three years.[405][406][407]
Athletics
West Perry's 1989 football team was the last undefeated team in Pennsylvania not to make the state playoffs, a distinction that the school may hold forever since the playoff format has been massively expanded since. Ten years later the football team, led by future University of Georgia and Baltimore Ravens running back Musa Smith, became the first squad in school history to make the post-season. The team faced the Central York Panthers in the first round of the playoffs, winning by a score of 42–0, making the Panthers the eighth team that season the Mustangs had forced the "mercy rule" upon. In the second game, the district finals, the Mustangs faced the Manheim Central Barons (winners of the 10 previous District 3 AAA championships) and were not so fortunate, losing 28–21 with the game ending as West Perry reached the opponent's 1-yard line.
The West Perry baseball team won consecutive state AA titles in 1979 and 1980. The West Perry boys basketball team reached the state AAA semi-finals in 2006.
West Perry School District coaches receive compensation as outlined in the teachers' union contract. When athletic competition exceeds the regular season, additional compensation is paid. Compensation for extracurriculars is outlined in the teacher union contract.[408] West Perry School District provides its athletics disclosure form on its web site.[409] Article XVI-C of the Public School Code requires the disclosure of interscholastic athletic opportunities for all public secondary school entities in Pennsylvania. All school entities with grades 7-12 are required to annually collect data concerning team and financial information for all male and female athletes beginning with the 2012-13 school year and submit the information to the Pennsylvania Department of Education. Beginning with the 2013-14 school year, all non-school (booster club and alumni) contributions and purchases must also be reported to PDE.[410]
According to Pennsylvania’s Safety in Youth Sports Act, all sports coaches, paid and volunteer, are required to annually complete the Concussion Management Certification Training and present the certification before coaching.[411][412]
The District funds:
|
|
- Middle School Sports
|
|
According to PIAA directory July 2014[413] The Schools are in PIAA District 3.
References
- ↑ Luke Roman (May 24, 2014). "West Perry to receive new superintendent, track top". Perry County Times.
- ↑ PDE, ED Names and Addresses, 2014
- ↑ Luke Roman (October 25, 2014). "West Perry reorganizes administration". Perry County Times.
- ↑ National Center for Education Statistics, Common Core of Data - West Perry School District 2013-14, 2017
- ↑ National Center for Education Statistics, Common Core of Data - West Perry School District, 2010
- ↑ National Center for Education Statistics, Common Core of Data West Perry School District 2013-14, 2017
- ↑ National Center for Education Statistics, Common Core of Data West Perry School District, 2010
- ↑ Pennsylvania Department of Education (2016). "West Perry School District Fast Facts 2016".
- ↑ Pennsylvania Department of Education (December 4, 2015). "West Perry School District Fast Facts 2015".
- ↑ Pennsylvania Department of Education, West Perry School District Fast Facts 2014, November 6, 2014
- ↑ Pennsylvania Department of Education, West Perry School District Fast Facts 2013, October 4, 2013
- ↑ Pennsylvania Department of Education, Enrollment and Projections by LEA, July 20, 2010
- ↑ Pennsylvania Department of Education, Enrollment Projections by LEA, July 2011
- ↑ Pennsylvania Department of Education, Enrollment by LEA and School 2015-16, 2016
- ↑ Pennsylvania Department of Education, Enrollment by LEA and School 2013, 2013
- ↑ Pennsylvania Department of Education, Enrollment and Projections by school district, January 2009
- ↑ Julianne Mattera (June 13, 2016). "14 teachers laid off, high school Ag program preserved in West Perry budget". PennLive.com.
- ↑ West Perry School Board, West Perry School District Budget 2015-16, May 2015
- ↑ West Perry School Board Secretary (June 16, 2014). "West Perry School Board Meeting Minutes" (PDF).
- ↑ West Perry School Board Secretary, West Perry School Board Meeting agenda, June 24, 2013
- ↑ PDE, Financial Elements Selected Data 2015-16, 2017
- ↑ US Census Bureau, 2010 Census Poverty Data by Local Education Agency, 2011
- ↑ proximityone (2014). "School District Comparative Analysis Profiles".
- ↑ Pennsylvania Budget and Policy Center, Education Facts Student Poverty Concentration by LEA, 2012
- ↑ Collin Deppen (January 2015). "How many children are homeless in your school district?" (PDF). Pennsylvania Department of Education.
- ↑ American Fact Finder, US Census Bureau, 2009
- ↑ US Census Bureau (2014). "Pennsylvania Median household income, 2006-2010 by County".
- ↑ US Census Bureau (2010). "American Fact Finder, State and County quick facts".
- ↑ US Census Bureau (September 2011). "Income, Poverty, and Health Insurance Coverage in the United States: 2010" (PDF).
- ↑ Jeff Guo (September 15, 2015). "Lower wages for whites, higher wages for immigrants, and inequality for all". Washington Post.
- ↑ PA Auditor General Office, West Perry School District Performance Audit, December 2015
- ↑ New York Times. "Diversity in the Classroom – West Perry School District". The New York Times. Retrieved April 16, 2011.
- ↑ CAIU15 (2015). "Capital Area Online Learning Association".
- ↑ Pennsylvania Public School Code Governance 2010
- ↑ US Department of Education (2015). "Every Student Succeeds Act".
- ↑ Pennsylvania General Assembly (2012). "Act of Jul. 12, 2012, P.L. 1142, No. 141 Section 921-A".
- ↑ West Perry School District Administrator (April 12, 2016). "West Perry School District Budgets".
- 1 2 Pennsylvania General Assembly, Pennsylvania School Code, 2013
- ↑ Pennsylvania General Assembly (2012). "Act of Jul. 12, 2012, P.L. 1142, No. 141".
- ↑ The Commonwealth Foundation for Public Policy Alternatives. "The Pennsylvania Project". Archived from the original on July 16, 2011. Retrieved May 20, 2010.
- ↑ Pittsburgh Business Times (April 12, 2016). "Chester County district leads statewide Honor Roll 2016".
- ↑ Pittsburgh Business Times (April 11, 2014). "What makes up a district's School Performance Profile score?".
- ↑ Pittsburgh Business Times (April 10, 2015). "Guide to Pennsylvania Schools Statewide School District Ranking 2015".
- ↑ Pittsburgh Business Times, Guide to Pennsylvania Schools Statewide School District Ranking 2014, April 11, 2014
- ↑ Pittsburgh Business Times, 2013 Guide to Pennsylvania School District Rankings, April 4, 2013
- ↑ Pittsburgh Business Times, Statewide Honor Roll Rankings 2012, April 4, 2012
- ↑ Pittsburgh Business Times, Statewide Honor Roll Rankings 2011, April 4, 2011
- ↑ Pittsburgh Business Times, Pennsylvania School District Rankings, May 1, 2010
- ↑ Pittsburgh Business Times (May 23, 2007). "Three of top school districts in state hail from Allegheny County". Archived from the original on March 28, 2010.
- 1 2 "Overachiever statewide ranking,". Pittsburgh Business Times. May 6, 2010.
- ↑ Pennsylvania Department of Education, Opportunity Scholarship Tax Credit Program Lowest Achieving Schools List for 2010-2011, July 2012
- 1 2 Pennsylvania Department of Education (April 21, 2014). "Opportunity Scholarship Tax Credit Program".
- ↑ Pennsylvania Department of Community and Economic Development (April 2014). "Opportunity Scholarship Tax Credit Program FAQ".
- ↑ Pennsylvania Department of Education (May 2012). "Tuition rate Fiscal Year 2011-2012".
- ↑ Olsen, Laura, State list of failing schools has 53 in county, Pittsburgh Post Gazette, July 26, 2012
- ↑ PDE, Opportunity Scholarship Schools List, 2016
- ↑ The Morning Call, 2009 PSSA RESULTS West Perry School District, 2009
- ↑ Pennsylvania Department of Education, West Perry School District AYP status Overview 2012, September 21, 2012
- ↑ Pennsylvania Department of Education, Pennsylvania Public School District AYP History, 2011
- ↑ PDE, West Perry School District Academic Report Card 2004, 2004
- ↑ Pennsylvania Department of Education, Pennsylvania District AYP History 2003-2010, 2011
- ↑ Pennsylvania Department of Education (November 4, 2016). "West Perry Senior High School - School Performance Profile 2016".
- ↑ Pennsylvania Department of Education (December 4, 2015). "West Perry Senior High School - School Performance Profile 2015".
- ↑ Pennsylvania Department of Education (November 6, 2014). "West Perry Senior High School - School Performance Profile 2014".
- ↑ Pennsylvania Department of Education, West Perry Senior High School School Performance Profile 2013, October 4, 2013
- ↑ Pennsylvania Department of Education (September 21, 2012). "West Perry School District AYP Data Table 2012".
- ↑ Pennsylvania Department of Education, West Perry School District - School AYP Data Table 2011, September 29, 2011
- ↑ Pennsylvania Department of Education (March 15, 2011). "New 4-year Cohort Graduation Rate Calculation Now Being Implemented".
- ↑ Pennsylvania Department of Education, West Perry School District Academic Achievement Report Card 2010 data table, March 2011
- ↑ Pennsylvania Department of Education, West Perry School District Academic Achievement Report Card 2009, April 2010
- ↑ Pennsylvania Department of Education, West Perry Senior High School Report Card 2008, August 2008
- ↑ Pennsylvania Partnerships for Children – Pennsylvania High School Graduation Rates 2007
- ↑ Pennsylvania Department of Education (November 4, 2016). "West Perry High School - School Fast Facts 2016".
- ↑ Pennsylvania Department of Education (November 6, 2014). "West Perry High School - School Fast Facts 2014".
- ↑ Pennsylvania Department of Education (October 4, 2013). "West Perry High School - School Fast Facts 2013".
- ↑ US News & World Report (2013). "Best High Schools - West Perry High School".
- ↑ National Center for Education Statistics, Common Core of Data - West Perry Senior High School, 2010
- ↑ Pennsylvania Department of Education (September 29, 2016). "2016 PSSA AND KEYSTONE Results".
- ↑ Pennsylvania Department of Education (August 2016). "Findings and Recommendations Pursuant to Act 1 of 2016" (PDF).
- ↑ Jan Murphy (October 16, 2016). "How District schools fared overall".
- ↑ Pennsylvania Department of Education (November 4, 2015). "High School School Performance Profile 2015".
- ↑ Jan Murphy (November 4, 2015). "Report card for state's high schools show overall decline". Pennlive.com.
- ↑ Pennsylvania Department of Education (November 4, 2015). "2015 Keystone Exam School Level Data".
- ↑ Pennsylvania Department of Education (November 6, 2014). "High School Academic Performance Data 2014".
- ↑ Evamarie Socha (November 6, 2014). "Half of Valley districts see state test scores decline". The Daily Item.
- ↑ Eleanor Chute (November 21, 2014). "Pennsylvania student scores declined with reduced funding, test results show". Pittsburgh Post-Gazette.
- ↑ Pennsylvania Department of Education, West Perry High School Academic Performance Data 2013, October 4, 2013
- ↑ Eleanor Chute & Mary Niederberger (December 11, 2013). "New assessment shows fuller picture of Pa. schools". Pittsburgh Post-Gazette.
- ↑ Pennsylvania Department of Education (September 29, 2011). "WEST PERRY Senior High School - School AYP Overview".
- 1 2 Pennsylvania Department of Education (2014). "State Academic Standards".
- ↑ Pennsylvania Department of Education (2014). "State Assessment System".
- ↑ Pennsylvania Department of Education (September 29, 2012). "2011-2012 PSSA and AYP Results".
- ↑ Pennsylvania Department of Education (September 29, 2011). "2010-2011 PSSA and AYP Results".
- ↑ Pennsylvania Department of Education (2007). "Pennsylvania Department of Education Math and Reading PSSA 2007 results by school and grade".
- ↑ Pennsylvania Department of Education, West Perry Senior High School Academic Achievement Report Card 2006, 2006
- ↑ Pennsylvania Department of Education (September 15, 2010). "PSSA and AYP Results".
- ↑ Pennsylvania Department of Education (September 21, 2012). "West Perry Senior High School Academic Achievement Report Card 2012" (PDF).
- ↑ |Pennsylvania Department of Education. "School Level Science PSSA Results".
- ↑ "Grading Our Schools Science PSSAs 2009,". The Times-Tribune. 2009.
- ↑ Pennsylvania Department of Education (August 2008). "Science PSSA Results by school and grade 2008".
- ↑ The Pennsylvania Basic Education/Higher Education Science and Technology Partnership, Science in Motion annual report, 2012
- ↑ Pennsylvania College Remediation Report January 2009
- ↑ National Center for Education Statistics
- ↑ West Perry School District Administration, West Perry School 9th grade planning parent presentation |author=West Perry School District Administration, April 2011
- ↑ "Pennsylvania Code §4.24 (a) High school graduation requirements".
- ↑ Pennsylvania State Board of Education, Proposed changes to Chapter 4, May 10, 2012
- ↑ Jan Murphy (February 3, 2016). "Wolf signs bill to suspend use of Keystone Exams as a graduation requirement". Pennlive.com.
- ↑ Pennsylvania Department of Education (2010). "Keystone Exam Overview" (PDF).
- ↑ Pennsylvania Department of Education (September 2011). "Pennsylvania Keystone Exams Overview". Archived from the original on March 17, 2012.
- 1 2 Pennsylvania State Board of Education (2010). "Rules and Regulation Title 22 PA School Code CH. 4".
- ↑ PA General Assembly, Act 6 of 2017, June 21, 2017
- ↑ Pennsylvania Department of Education, State Board of Education Finalizes Adoption of Pennsylvania Common Core State Academic Standards and High School Graduation Requirements, March 14, 2013
- ↑ Pennsylvania Department of Education (2011). "Keystone Exams".
- ↑ Pennsylvania Department of Education (September 2011). "Pennsylvania Keystone Exams Overview".
- ↑ Representative Mike Turzai (2017). "House Bill 202 of 2017".
- ↑ Natosha Lindstrom (June 13, 2017). "Wolf to sign law granting career-track students alternatives to Keystone exit exams". TribLive.
- ↑ Karen Langley (June 22, 2017). "New law would allow some Pennsylvania students to finish high school without Keystone exams". Pittsburgh Post-Gazette.
- ↑ Pennsylvania Department of Education (2011). "2010-2011 Dual Enrollment Guidelines".
- ↑ Commonwealth of Pennsylvania (March 2010). "Pennsylvania Transfer and Articulation Agreement".
- ↑ Pennsylvania Department of Education (2016). "SAT and AP Scores 2016".
- ↑ College Board, (2017). "SAT 2016 Total Group report Pennsylvania". Archived from the original on August 2, 2017.
- ↑ Pennsylvania Department of Education (2015). "SAT and AP Scores 2015".
- ↑ College Board, SAT 2015 Total Group report Pennsylvania, 2016
- ↑ PDE, School Performance profile West Perry High School 2014, November 6, 2014
- ↑ College Board (2014). "2014 College-Bound Seniors State Profile Report" (PDF).
- ↑ College Board (2013). "The 2013 SAT Report on College & Career Readiness".
- ↑ Pennsylvania Department of Education (2011). "Public School SAT Scores 2011". Archived from the original on October 15, 2011.
- ↑ College Board (September 2011). "SAT Scores State By State - Pennsylvania".
- ↑ "While U.S. SAT scores dip across the board, N.J. test-takers hold steady". NJ.com. September 2011.
- ↑ The Center for Rural Pennsylvania (August 2006). "SAT Scores and Other School Data".
- ↑ College Board (2014). "Exam Fees and Reductions: 2015".
- ↑ PDE, School Performance Profile - Academic Performance Data - West Perry High School, December 2014
- ↑ PDE, West Perry School District Fast facts 2015, 2015
- ↑ PDE, West Perry School District Fast Facts 2016, 2016
- ↑ Pennsylvania Department of Education (October 14, 2016). "West Perry Middle School Fast Facts 2016".
- ↑ Pennsylvania Department of Education (October 4, 2013). "West Perry Middle School School Fast Facts 2013".
- ↑ Pennsylvania Department of Education, Professional Qualifications of Teachers West Perry Middle School, October 4, 2013
- ↑ National Center for Education Statistics, Common Core of Data - West Perry Middle School, 2010
- ↑ Pennsylvania Middle School Rankings 7th, 8th Grades Combined PSSA Math and PSSA Reading 2008–2009 at SchoolDigger.com
- ↑ Pennsylvania Department of Education (September 29, 2016). "2016 PSSA AND KEYSTONE Results".
- ↑ Pennsylvania Department of Education (October 1, 2015). "2015 PSSA School Level Data".
- ↑ Pennsylvania Department of Education (October 1, 2015). "2015 PSSA State Level Data".
- ↑ Pennsylvania Department of Education (November 6, 2014). "West Perry Middle School Academic Performance Data 2014".
- ↑ Pennsylvania Department of Education (October 4, 2013). "West Perry Middle School Academic Performance Data 2013,".
- ↑ Pennsylvania Department of Education, West Perry School District Report Card 2012, September 21, 2012
- ↑ Pennsylvania Department of Education, West Perry School District Report Card 2011, September 29, 2011
- ↑ Pennsylvania Department of Education, West Perry Elementary School - School AYP Data Table 2011, September 29, 2011
- ↑ Pennsylvania Department of Education, West Perry Middle School AYP Overview 2010, March 2011
- ↑ Pennsylvania Department of Education, West Perry School District Report Card 2009, September 14, 2009
- ↑ Pennsylvania Department of Education, West Perry School District Report Card 2008, August 15, 2008
- ↑ Pennsylvania Department of Education, West Perry School District Report Card 2007, 2007
- ↑ Pennsylvania Department of Education. "IU16-PSSA 95-96 Results by School". Retrieved May 11, 2014.
- ↑ Pennsylvania Department of Education (2014). "Standards Aligned Systems".
- ↑ Pennsylvania Department of Education (2014). "State Academic Standards Mathematics".
- 1 2 3 Pittsburgh Post Gazette (October 15, 2012). "How is your school doing?".
- ↑ Pennsylvania Department of Education, West Perry Middle School Academic Achievement Report Card 2010, March 2011
- ↑ Pennsylvania Department of Education, West Perry Middle School Academic Achievement Report Card 2009, 2009
- ↑ Pennsylvania Department of Education, West Perry Middle School Academic Achievement Report Card 2008, August 15, 2008
- ↑ Pennsylvania Department of Education, West Perry Middle School Academic Achievement Report Card 2007, 2007
- ↑ Pennsylvania Department of Education, West Perry Middle School Academic Achievement Report Card 2012, September 21, 2012
- ↑ Pennsylvania Department of Education (2008). "2008-09 PSSAs: Reading, Math, Writing and Science Results".
- ↑ Pennsylvania Department of Education (August 15, 2008). "The 2008 PSSA Science State Level Proficiency Results by Grade and State Total (Full Academic Year)".
- ↑ The Philadelphia Inquirer Philly.com, PENNSYLVANIA SYSTEM OF SCHOOL ASSESSMENT RESULTS database, 2010
- ↑ Office of First Lady (September 2, 2014). "Pennsylvania First Lady and Acting Secretary of Education Announce 35 Schools Statewide Implementing Dropout Program".
- ↑ Pennsylvania Department of Education, The Early Warning System, 2014
- ↑ Pennsylvania Department of Education (October 14, 2016). "Blain Elementary School Fast Facts 2016".
- ↑ Pennsylvania Department of Education, School Performance Profile, Blain Elementary School Fast Facts, 2016
- ↑ Pennsylvania Department of Education, School Performance Profile, Blain Elementary School Fast Facts, 2014
- ↑ Pennsylvania Department of Education (October 4, 2013). "Blain Elementary School Fast Facts 2013".
- ↑ Pennsylvania Department of Education, School Performance Profile, Blain Elementary School Fast Facts 2013, October 2013
- ↑ Pennsylvania Partnership for Children, Full-Day Kindergarten Enrollment, 2010
- ↑ National Center for Education Statistics, Common Core of Data - Blain Elementary School, 2010
- 1 2 3 Pennsylvania Department of Education, 2016 PSSA AND KEYSTONE Results, September 29, 2016
- 1 2 3 Jan Murphy (September 29, 2016). "Standardized test scores show Pa. schools have more work to do". Pennlive.com.
- ↑ Pennsylvania Department of Education (October 1, 2015). "2015 PSSA School Level Data".
- ↑ Pennsylvania Department of Education (October 1, 2015). "2015 PSSA State Level Data".
- ↑ Pennsylvania Department of Education (November 6, 2014). "Blain Elementary School Academic Performance Data 2014".
- ↑ Pennsylvania Department of Education (October 4, 2013). "Blain Elementary School Academic Performance Data 2013".
- ↑ Pennsylvania Department of Education, Blain Elementary School School AYP Data Table 2012, September 21, 2012
- ↑ Pennsylvania Department of Education, Blain Elementary School School AYP Data Table 2010, March 2011
- ↑ Pennsylvania State Board of Education (2003). "PSSA results 2003".
- ↑ New America Foundation (2003). "No Child Left Behind Overview".
- ↑ The Goals of No Child Left Behind (Jul 20, 2010). "The Goals of No Child Left Behind".
- ↑ Learning Point Associates (220). "Understanding the No Child Left Behind Act" (PDF).
- ↑ Pennsylvania State Board of Education (January 11, 2003). "Pennsylvania Academic Standards Science and Technology, Ecology and Environment".
- ↑ Pennsylvania Department of Education, Blain Elementary School School Academic Achievement Report Card 2012, September 21, 2012
- ↑ Pennsylvania Department of Education, Blain Elementary School School Academic Achievement Report Card 2011, September 29, 2011
- ↑ Pennsylvania Department of Education, Blain Elementary School School Academic Achievement Report Card 2009 & 2010, March 2011
- ↑ Pennsylvania Department of Education, Blain Elementary School Academic Achievement Report Card 2008 & 2009, September 14, 2009
- ↑ Pennsylvania Department of Education, Blain Elementary School Report Card 2006, September 2006
- ↑ Pennsylvania Department of Education (October 14, 2016). "Carroll Elementary School Fast Facts 2016".
- ↑ Pennsylvania Department of Education (November 6, 2014). "Carroll Elementary School Fast Facts 2014".
- ↑ Pennsylvania Department of Education (October 4, 2013). "Carroll Elementary School Fast Facts 2013".
- ↑ Pennsylvania Department of Education, School Performance Profile, Carroll Elementary School Fast Facts, 2013
- ↑ National Center for Education Statistics, Common Core of Data - Carroll Elementary School, 2010
- ↑ Pennsylvania Department of Education, Professional Qualifications of Teachers Carroll Elementary School, September 21, 2012
- ↑ PDE, Full Day Kindergarten report 2010-11, 2010
- 1 2 Malia Villegas, Early Education Policy Brief, WestEd Center on Policy, April 2005
- ↑ Pennsylvania Department of Education, M School District academic report card 2012, 2012
- ↑ Pennsylvania Department of Education (October 1, 2015). "2015 PSSA School Level Data".
- ↑ Pennsylvania Department of Education (October 1, 2015). "2015 PSSA State Level Data".
- ↑ Pennsylvania Department of Education (November 6, 2014). "Carroll Elementary School Academic Performance Data 2014".
- ↑ Pennsylvania Department of Education (October 4, 2013). "Carroll Elementary School Academic Performance Data 2013".
- ↑ Pennsylvania Department of Education, CARROLL Elementary School AYP Overview 2012, September 21, 2012
- ↑ Pennsylvania Department of Education, Carroll Elementary School School AYP Data Table2011, March 2011
- ↑ Pennsylvania Department of Education, Carroll Elementary School School AYP Data Table 2011, September 29, 2011
- ↑ Pennsylvania Department of Education, Carroll Elementary School School Academic Achievement Report Card 2012, September 21, 2012
- ↑ Pennsylvania Department of Education, Carroll Elementary School School Academic Achievement Report Card 2011, September 29, 2011
- ↑ Pennsylvania Department of Education, Carroll Elementary School School Academic Achievement Report Card 2010, March 20, 2011
- ↑ Pennsylvania Department of Education, Carroll Elementary School School Academic Achievement Report Card 2009, September 15, 2009
- ↑ Pennsylvania Department of Education, Carroll Elementary School Academic Achievement Report Card 2008, August 15, 2008
- ↑ Pennsylvania Department of Education, Carroll Elementary School Academic Achievement Report Card 2006, 2006
- ↑ Pennsylvania Department of Education (October 14, 2016). "New Bloomfield Elementary School Fast Facts 2016".
- ↑ Pennsylvania Department of Education (November 6, 2014). "New Bloomfield Elementary School Fast Facts 2014".
- ↑ Pennsylvania Department of Education, New Bloomfield Elementary School Fast Facts 2013, October 4, 2013
- ↑ Pennsylvania Department of Education, School Performance Profile, New Bloomfield Elementary School Fast Facts 2013, October 4, 2013
- ↑ National Center for Education Statistics, Common Core of Data - New Bloomfield Elementary School, 2010
- ↑ Pennsylvania Department of Education, Professional Qualifications of Teachers New Bloomfield Elementary School, September 21, 2012
- ↑ Pennsylvania Department of Education (October 1, 2015). "2015 PSSA School Level Data".
- ↑ Pennsylvania Department of Education (October 1, 2015). "2015 PSSA State Level Data".
- ↑ Pennsylvania Department of Education (November 6, 2014). "New Bloomfield Elementary School Academic Performance Data 2014".
- ↑ Pennsylvania Department of Education (October 4, 2013). "New Bloomfield Elementary School Academic Performance Data 2013".
- ↑ Pennsylvania Department of Education, New Bloomfield Elementary School AYP Overview 2012, September 21, 2012
- ↑ Pennsylvania Department of Education, New Bloomfield Elementary School AYP Overview, September 29, 2011
- ↑ Pennsylvania Department of Education, New Bloomfield Elementary School School AYP Data Table 2009, 2009
- ↑ Pennsylvania Department of Education, New Bloomfield Elementary School Academic Achievement Report Card 2011, September 21, 2012
- ↑ Pennsylvania Department of Education, New Bloomfield Elementary School Academic Achievement Report Card 2011, September 29, 2011
- ↑ {Pennsylvania Department of Education, New Bloomfield Elementary School Academic Achievement Report Card 2010, March 2011
- ↑ Pennsylvania Department of Education, New Bloomfield Elementary School Academic Achievement Report Card 2009, March 2010
- ↑ Pennsylvania Department of Education, PSSA Results Math and Reading 2005-2006, 2006
- ↑ Pennsylvania Department of Education, New Bloomfield Elementary School Academic Achievement Report Card 2006, 2006
- ↑ Pennsylvania Bureau of Special Education (December 1, 2015). "West Perry School District Special Education Report Card 2015" (PDF).
- ↑ Pennsylvania Bureau of Special Education (December 1, 2012). "West Perry School District Special Education Report Card 2012-2013" (PDF).
- ↑ Pennsylvania Bureau of Special Education (January 31, 2011). "West Perry School District Special Education Data Report LEA Performance on State Performance Plan (SPP) Targets School Year 2008–2009" (PDF).
- ↑ PDE, Full Day Kindergarten report 2010-11. 2010
- ↑ Pennsylvania Department of Education, West Perry School District Academic Report Card 2012, 2012
- ↑ West Perry School District Administration (Sep 12, 2008). "West Perry School District Special Education Department – Annual Public Notice of Special Education Services".
- ↑ Pennsylvania Department of Education. "Pennsylvania Special Education Funding".
- ↑ Browne, Patrick., Senate Education Committee Hearing on Special Education Funding & Accountability testimony, November 1, 2011
- ↑ Kintisch, Baruch., Public Hearing: Special Education Funding & Accountability Testimony, Education Law Center, November 11, 2011
- ↑ Amy Morton, Executive Deputy Secretary, Public Hearing: Special Education Funding & Accountability Testimony, Pennsylvania Department of Education, November 11, 2011
- ↑ US Department of Education, U.S. Department of Education Clarifies Schools' Obligation to Provide Equal Opportunity to Students with Disabilities to Participate in Extracurricular Athletics, January 25, 2013
- ↑ Pennsylvania Department of Education (July 2010). "Special Education Funding from Pennsylvania State_2010-2011".
- ↑ Pennsylvania Department of Education (2011). "Special Education Funding 2011-2012 Fiscal Year".
- ↑ Pennsylvania Department of Education, (April 2012). "Investing in PA kids,".
- ↑ Pennsylvania Department of Education, Special Education funding report by LEA, July 2014
- ↑ Pennsylvania Department of Education (July 2010). "Gifted Students as Percentage of Total Enrollment by School District/Charter School" (PDF). Archived from the original (PDF) on March 4, 2016.
- ↑ Pennsylvania Department of Education and Pennsylvania School Board. "CHAPTER 16. Special Education For Gifted Students". Retrieved February 4, 2011.
- ↑ Pennsylvania General Assembly, Taxpayer Relief Act, Act 1 of the Special Session of 2006, June 27, 2006
- ↑ Julianne Mattera, West Perry School District Budget 2016-17, June 2016
- ↑ Pennsylvania Department of Education (2013). "Investing in Pennsylvania Students".
- ↑ OpenPAGov.org, West Perry School District Payroll Report 2013, 2014
- ↑ Pennsylvania School Employees Retirement System (2014). "Your PSERS Benefits & Leaving Employment".
- ↑ American Enterprise Institute, (2011). "Assessing the Compensation of Public School Teachers". Archived from the original on January 3, 2013.
- ↑ Pennsylvania Department of Education, Investing in Pennsylvania Students, 2012
- ↑ OpenPAGov.org (2012). "West Perry School District Payroll Report 2010-2011".
- ↑ Fenton, Jacob, (April 2010). "Average classroom teacher salary in Perry County, 2006–07". The Morning Call.
- ↑ Teachers need to know enough is enough, PaDelcoTimes, April 20, 2010.
- ↑ West Perry School Board (2010). "West Perry School district Teachers' Union Employment Contract 2010-13" (PDF).
- ↑ Legislature must act on educators' pension hole. The Patriot News. February 21, 2010
- ↑ "IU 15 Schools Salary Comparison 1". 2010. Archived from the original on October 22, 2013.
- 1 2 Pa. Public School Salaries, 2009 Asbury Park Press
- ↑ Fenton, Jacob. (February 2009). "Pennsylvania School District Data: Will School Consolidation Save Money?,". The Morning Call. Archived from the original on July 23, 2011.
- ↑ "Central Pennsylvania School Districts Spending Versus Academic Results". 2009. Archived from the original on October 8, 2014.
- ↑ Pennsylvania Department of Education (2010). "2009-10 Selected Data - 2009-10 Total Expenditures per ADM".
- ↑ United States Census Bureau (2009). "States Ranked According to Per Pupil Elementary-Secondary Public School System Finance Amounts: 2008-09" (PDF).
- ↑ US Census Bureau (2009). "Total and current expenditures per pupil in fall enrollment in public elementary and secondary education, by function and state or jurisdiction: 2006-07".
- ↑ Pennsylvania Department of Education, (2008). "General Reserved Fund Balance by School District 1996-2008,".
- ↑ Murphy, Jan., Pennsylvania's public schools boost reserves, CentreDaily Times, September 22, 2010
- ↑ Melissa Daniels (June 1, 2013). "PA school districts look to cash stash to balance budgets". PA Independent. Archived from the original on August 26, 2013.
- ↑ Jan Murphy (August 18, 2014). "School district reserves rise despite $1 billion cut in state aid". Pennlive.com.
- ↑ Commonwealth Foundation (May 17, 2012). "Chart: School District Fund Balances Nearly Tripled in 14 Years".
- ↑ PDE, Investing in Pennsylvania Students, July 2014
- ↑ Jan Murphy (June 15, 2016). "Search the database: How much is in your school district's fund balance?".
- ↑ James Paul (June 15, 2016). "School Districts Amass Record Reserve Funds". Commonwealth Foundation.
- ↑ "WEST PERRY SCHOOL DISTRICT PERRY COUNTY, PENNSYLVANIA PERFORMANCE AUDIT REPORT". November 2010.
- ↑ Pennsylvania Department of Education (May 2012). "Pennsylvania Public School District Tuition Rates".
- ↑ Pennsylvania Department of Community Economic Development (2012). "Earned Income Tax". Archived from the original on September 30, 2013.
- ↑ Penn State Cooperative Extension (2010). "What are the Local Taxes in Pennsylvania?, Local Tax Reform Education Project" (PDF).
- ↑ Pennsylvania Department of Revenue (July 14, 2014). "Personal Income Tax information 2010".
- ↑ John Finnerty (2013). "PA teachers pensions". CNHI Harrisburg Bureau.
- ↑ Pennsylvania Representative Todd Stephens (January 23, 2014). "LEEF Funding Chart 2014".
- ↑ Basic Education Funding Commission, Commission minutes, 2016
- ↑ York Dispatch, Governor Wolf Signs Fair Funding Formula, June 2016
- ↑ Pennsylvania General Assembly (June 2016). "House Bill 1552, Act 35 of 2016".
- ↑ Pennsylvania Department of Education, Education Budget 2017-18, July 2017
- ↑ PDE, Special Education Funding fiscal year 2017-18, July 2017
- ↑ PA Office of Budget (July 2016). "Commonwealth 2016-17 Enacted Budget Line-Item Appropriations" (PDF).
- ↑ Pennsylvania Department of Education, Education Budget 2016-17, July 2016
- ↑ PDE, Special Education Funding fiscal year 2016-17, July 2017
- ↑ PA Office of Budget, Commonwealth 2016-17 Enacted Budget Line-Item Appropriations, July 2016
- ↑ Jan Murphey (January 4, 2016). "Here's the payout your school district gets from the partial 2015-16 state budget". Pennlive.com.
- ↑ Jennifer Wakeman (January 4, 2016). "Harrisburg releases $3.3 billion in delayed funds".
- ↑ Pennsylvania General Assembly (June 26, 2015). "Basic Education Funding Commission".
- ↑ Jan Murphy (April 15, 2016). "House, Senate cast veto-proof majority votes on school funding bill". Pennlive.com.
- ↑ PDE, Ed Budget 2015-16, May 2016
- ↑ PDE, Enacted Education Budget 2014-2015, July 7, 2014
- ↑ Pennsylvania Department of Education, 2014-15 Enacted Education Budget Fast Facts, July 14, 2014
- ↑ Democrat Appropriations Committee, Report on Education funding by LEA, July 2, 2013
- ↑ Pennsylvania Office of the Budget, 2013-14 State Budget Highlights, 2013
- ↑ Senator Jake Corman (June 28, 2012). "Pennsylvania Education funding by Local School District" (PDF). Archived from the original (PDF) on July 30, 2012.
- ↑ Pennsylvania General Assembly Sen Jake Corman (June 29, 2012). "SB1466 of 2012 General Fund Appropriation".
- ↑ Pennsylvania Department of Education (July 2011). "Pennsylvania 2011-2012 Estimated Basic Education Funding".
- ↑ PA Senate Appropriations Committee, School District 2011-12 funding Report, June 28, 2011
- ↑ Pennsylvania Department of Education, Basic Education Funding 2011-2012 Fiscal Year, June 30, 2011
- ↑ Pennsylvania House Appropriations Committee, PA Basic Education Funding-Printout2 2010–2011, July 30, 2010
- ↑ Office of the Budget, (February 2010). "Pennsylvania Budget Proposal 2010".
- ↑ Pennsylvania Department of Education, Basic Education Funding by District 2009–10, October 2009
- ↑ Pennsylvania Department of Education, Funding Report by LEA, 2009
- ↑ Governor's Budget Office (2014). "Past Budgets 2013-14 to 2006-07".
- ↑ Pennsylvania Department of Education, Accountability Block Grant report 2010, Grantee list 2010, July 2010
- ↑ Pennsylvania Department of Education (2008). "Accountability Block Grant Mid Year report".
- ↑ Pennsylvania Department of Education (2013). "Passport for Learning Block Grant".
- ↑ PDE, BED Funding 2016-17 breakdown, July 2016
- ↑ Pennsylvania Department of Education (2010). "Educational Assistance Program Funding 2010–2011 Fiscal Year".
- ↑ Pennsylvania Auditor General (December 22, 2008). "Classrooms For the Future grants audit" (PDF).
- ↑ Pennsylvania Department of Education (May 23, 2012). "Pennsylvania Awards $36.1 Million to Strengthen Literacy Programs".
- ↑ Pennsylvania Department of Education (2013). "Passport for Learning Block Grant".
- ↑ Department of Environmental Protection (2014). "Environmental Education Grants".
- ↑ Pennsylvania Department of Education, Science: It’s Elementary Grantees Students in 143 Schools Benefit from Intensive Science Curriculum, July 22, 2008
- ↑ Pennsylvania Department of Education Press Office (October 17, 2013). "Acting Secretary of Education Says Hybrid Learning Benefits Students; Highlights Success of First-Year Pilot Program".
- ↑ Commonwealth of Pennsylvania (April 2010). "West Perry School District ARRA FUNDING Report 2010".
- ↑ Pennsylvania Department of Education School District Funding Report. October 2009.
- ↑ Pittsburgh Post-Gazette, School stimulus money, March 12, 2009
- ↑ Governor's news office. (January 20, 2010). "Pennsylvania's 'Race to the Top' Fueled by Effective Reforms, Strong Local Support,".
- ↑ Pennsylvania Department of Education Secretary Gerald Zahorchek (December 2009). "Pennsylvania Race to the Top Letter to Superintendents". Archived from the original on October 15, 2013.
- ↑ Governor's Press Office. (January 20, 2010). "Pennsylvania's 'Race to the Top' Fueled by Effective Reforms, Strong Local Support,".
- ↑ U.S. Department of Education (March 29, 2010). "Race to the Top Fund".
- ↑ Common Cents program – Making Every Dollar Count
- ↑ PDE, Enrollment and Projections 2005 - 2014, July 2014
- ↑ 2009–10 Executive Budget Facts Pennsylvania School District Consolidation, Edward Rendell, Governor and Mary Soderberg, Secretary of the Budget. February 2009
- ↑ "Report of the Fiscal Responsibility Task Force". April 2011.
- ↑ Pennsylvania Legislative Budget and Finance Committee, Study of the Cost Effectiveness of Consolidating Pennsylvania School Districts, 2007
- ↑ Rendell, E. & Soderberg, M. (2009). "Pennsylvania school district consolidation. 2009–10 Executive Budget Fast Facts, Pennsylvania Office of the Governor" (PDF).
- ↑ Study of the cost-effectiveness of consolidating Pennsylvania districts. New York: Standard & Poor’s School Evaluation Services. 2007, p. 6.
- ↑ Pennsylvania Legislative Budget Finance Committee (2007). "Study of the Cost-Effectiveness of Consolidating Pennsylvania School Districts". Archived from the original on October 19, 2014.
- ↑ Adam Smeltz & Richard Gazarik (December 28, 2013). "Distrust of government keeps school district consolidations at bay". Triblive.
- ↑ The Center for Rural Pennsylvania. (October 2009). "Research Analyzes Rural School District Enrollment and Building Capacity" (PDF).
- ↑ Pennsylvania Department of Health, Birth Age County Reports 1990 and 2011, 2011
- ↑ PDE (October 2016). "Finances RE Tax Rates 2016-17".
- ↑ Katie Colaneri (June 11, 2015). "New pipeline could mean tax bonanza for NJ towns, but for Pa.? Not so much". State Impact NPR.org.
- ↑ Penn State Extension (2012). "Marcellus Shale Gas Development: What Does It Mean for Pennsylvania Schools?".
- ↑ Pennsylvania Department of Education (2004). "Act 511 Tax Report".
- ↑ State Tax Equalization Board (2011). "State Tax Equalization Board About US". Archived from the original on November 14, 2012.
- ↑ Pennsylvania Auditor General office - Bureau of Audits (February 2011). "A Special Performance Audit of the Pennsylvania State Tax Equalization Boards" (PDF). Archived from the original (PDF) on January 28, 2016.
- ↑ PDE (October 2015). "Finances RE Tax Rates 2015-16".
- ↑ Pennsylvania Department of Education, Finances_Real Estate Tax Rates 2013-14, 2013
- ↑ Pennsylvania Department of Education, Finances_Real Estate Tax Rates 2012,13, 2012
- ↑ Pennsylvania Department of Education, Finances_Real Estate Tax Rates 2011–12, 2011
- ↑ Pennsylvania Department of Education, Finances_Real Estate Tax Rates 2010–11, 2010
- ↑ Pennsylvania Department of Education, Pennsylvania School District Finances_Real Estate Tax Rates_0910, 2009
- ↑ Pennsylvania Department of Education, Pennsylvania School District Real Estate Tax Rates 2008-09, 2008
- ↑ Pennsylvania Department of Education, Real Estate Tax Millage by School District, 2007
- ↑ Pennsylvania Department of Education, Real Estate Tax Millage by School District, 2006
- ↑ Pennsylvania Department of Education, Real Estate Tax Millage by School District, 2005
- ↑ Pennsylvania Department of Education, Pennsylvania School Finances - Summaries of Annual Financial Report Data 2010-11, 2011
- ↑ New Census Data on Property Taxes on Homeowners, Tax Foundation, September 22, 2009.
- ↑ Pennsylvania Department of Education 2010–11 Act 1 of 2006 Referendum Exception Guidelines.
- ↑ Pennsylvania Department of Education, (May 2010). "Special Session Act 1 of 2006 School District Adjusted Index for 2006–2007 through 2011–2012,". Archived from the original on October 2, 2013.
- ↑ Pennsylvania Department of Education, Special Session Act 1 of 2006 School District Adjusted Index for 2006-2007 through 2011-2012, May 2011
- ↑ Pennsylvania Department of Education, 2011-2012 School District Adjusted Index, September 2010
- ↑ Pennsylvania Department of Education, 2012-2013 School District Adjusted Index, May 2011
- ↑ Pennsylvania Department of Education, 2013-2014 School District Adjusted Index, May 2012
- ↑ Pennsylvania Department of Education, 2014-2015 School District Adjusted Index, September 2013
- ↑ Pennsylvania Department of Education, 2015-2016 School District Adjusted Index, September 2014
- ↑ Pennsylvania Department of Education (September 5, 2015). "2016-2017 School District Adjusted Index,".
- ↑ Pennsylvania Department of Education (2015). "Property Tax Relief".
- ↑ PA Department of Education (September 10, 2016). "Index Calculation Required by Special Session Act 1 of 2006".
- ↑ Pennsylvania Department of Education (2016). "2017-18 School District Adjusted Index Listing".
- ↑ Pennsylvania Department of Education (April 2016). "Report on Referendum Exceptions For School Year 2016-2017".
- ↑ PSERS (December 10, 2015). "Fiscal Year 2016/2017 Employer Contribution Rate" (PDF).
- ↑ USA IRS (December 14, 2016). "Understanding Employment Taxes".
- ↑ Pennsylvania Department of Education (April 2015). "Taxpayer Relief Act Special Session Act 1 of 2006 Report on Referendum Exceptions For School Year 2015-2016".
- ↑ Pennsylvania School Employees, Retirement System, PSERS Chart showing payment mandates 2007-2020, 2014
- ↑ Pennsylvania Department of Education (April 30, 2014). "Report on Referendum Exceptions For School Year 2014-2015".
- ↑ Pennsylvania Department of Education, Report on Referendum Exceptions For School Year 2013-2014, April 2013
- ↑ Pennsylvania Department of Education, Report on Referendum Exceptions For School Year 2012-2013, March 30, 2012
- ↑ Pennsylvania Department of Education, Special Session Act 1 of 2006 the Taxpayer Relief Act information, 2011
- ↑ Pennsylvania Department of Education, Report on Exceptions, April 2011
- ↑ Pennsylvania Department of Education, Pennsylvania SSAct1_Act1 Exceptions Report 2010-2011, April 2010
- ↑ Scarcella, Frank & Pursell, Tricia (May 25, 2010). "Local school tax assessments exceed state averages". The Daily Item.
- ↑ Pennsylvania Department of Education (May 1, 2016). "2016-17 Estimated State Property Tax Relief per Homestead".
- ↑ Pennsylvania Gaming Control Board (2014). "Gaming Benefits for Pennsylvanians".
- ↑ Pennsylvania Department of Education (May 1, 2013). "2013-2014 Estimated State Property Tax Relief per Homestead".
- ↑ Tax Relief per Homestead, Pennsylvania Department of Education, May 1, 2010
- ↑ Pennsylvania Auditor General Office (February 23, 2010). "Special Report Pennsylvania Property Tax Relief,".
- ↑ Pennsylvania Department of Education (May 2010). "Tax Relief per Homestead 5–1–10. Report".
- ↑ Center for Safe Schools (2013). "West Perry School District School Safety Report 2013" (PDF).
- ↑ Commonwealth of Pennsylvania Safe School Center (2012). "Pennsylvania Safe Schools Online Reports".
- ↑ Safe & Responsive Schools Project (June 20, 2011). "Area high school students create anti-bullying mural". Williamsport Sun Gazette.
- ↑ Safe Schools online. "West Perry School Safety Report 2009" (PDF).
- ↑ Commonwealth of Pennsylvania. "School Safety Reports Online".
- ↑ West Perry School Board (March 7, 2011). "West Perry School Board Bullying/Cyberbullying Policy 249" (PDF).
- ↑ "Regular Session 2007–2008 House Bill 1067, Act 61 Section 6 page 8".
- ↑ Center for Safe Schools of Pennsylvania,. "Bullying Prevention advisory".
- ↑ Pennsylvania Department of Education. "Pennsylvania Academic Standards".
- ↑ West Perry School District Administration, 2015-16 General Fund Budget, May 2015
- ↑ West Perry School Board (April 2011). "West Perry School District Extracurricular Activities Policy 122".
- ↑ West Perry School Board (February 2011). "West Perry School District Interscholastic Athletics Policy 122".
- ↑ Shinskie, John. West Perry School Board cultivates synthetic turf on the stadium field. Perry County Times December 23, 2009
- ↑ Luke Roman., West Perry to receive new superintendent, track top, Perry County Times, May 24, 2014
- ↑ Pennsylvania Office of the Governor Press Release, (November 10, 2005). "Home-Schooled, Charter School Children Can Participate in School District Extracurricular Activities,". Archived from the original on October 23, 2014.
- ↑ West Perry School Board (February 2011). "West Perry School District Extracurricular Participation by Charter/Cyber Charter Students Policy 140.1".
- ↑ West Perry School Board (February 2011). "West Perry School District Extracurricular Participation by Home Education Students Policy 137.1".
- ↑ Eleanor Chute., New Pa. law expands clearance requirements for school volunteers, employees, Pittsburgh Post-Gazette, December 15, 2014
- ↑ Pennsylvania General Assembly (2014). "ACT 126 – Child Abuse Recognition and Reporting Act".
- ↑ Ali Stevens., Child Protective Services Law impacts schools, WKOK.com 1070AM, January 6, 2015
- ↑ West Perry School Board, West Perry School District Teacher Union Contract, 2014
- ↑ Area School District Administration (2014). "West Perry School District Athletics".
- ↑ Pennsylvania Department of Education (2013). "Interscholastic Athletic Opportunities Disclosure Form" (PDF).
- ↑ PA General Assembly (July 1, 2012). "Senate Bill 200 of Session 2011 Safety in Youth Sports Act".
- ↑ UMPC Sports Medicine (2014). "Managing Concussions in Student Athletes: The Safety in Youth Sports Act".
- ↑ Pennsylvania Interscholastic Athletics Association (2014). "PIAA School Directory".
Perry County, Pennsylvania Schools | |||||||||||||
|---|---|---|---|---|---|---|---|---|---|---|---|---|---|
| |||||||||||||
| |||||||||||||
Coordinates: 40°22′52″N 77°19′53″W / 40.38107°N 77.33139°W