Newport School District (Pennsylvania)
| Newport School District | |
|---|---|
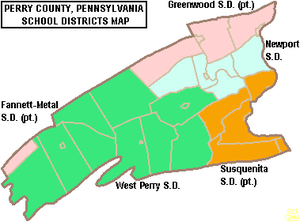 Newport School District shown in pale blue | |
| Address | |
|
420 Fickes Lane Newport, Perry County, Pennsylvania 17074-0009 United States | |
| Information | |
| Type | Public |
| School board | 9 locally elected members |
| Superintendent | Ryan Neuhard (July 1, 2014 5 year contract)[1] |
| Administrator |
Mrs. MaryKay Hunter, Sup. of Special Services |
| Principal | Elementary - Mr. Michael Smith |
| Principal | Middle School - Bryan E Rehmeyer (2017)[2] |
| Principal | High School - Mr. Scott McGrady, (2014), $92,000[3] |
| Staff | 56 non teaching staff members (2016), 66 staff members in 2010 |
| Faculty |
88 teachers (2016)[4] 87 teachers (2010)[5] |
| Grades | Preschool-12th |
| Age | 4 years old - PreK to 21 years old special education |
| Number of pupils |
1,044 pupils (2016)[6] |
| • Kindergarten | 65 (2015),[10] 88 (2012), 125 (2010) |
| • Grade 1 | 86 (2015), 84 (2012), 69 |
| • Grade 2 | 77 (2015), 80 (2012), 69 |
| • Grade 3 | 83 (2015), 93 (2012), 95 |
| • Grade 4 | 86 (2015), 100 (2012), 85 |
| • Grade 5 | 80 (2015), 68 (2012), 91 |
| • Grade 6 | 93 (2015), 99 (2012), 71 |
| • Grade 7 | 100 (2015), 84 (2012), 91 |
| • Grade 8 | 61 (2015), 80 (2012), 69 |
| • Grade 9 | 103 (2015), 87 (2012), 107 |
| • Grade 10 | 83 (2015), 86 (2012), 81 |
| • Grade 11 | 67 (2015), 79 (2012), 84 |
| • Grade 12 | 60 (2015), 82 (2012), 68 (2010) |
| • Other | Enrollment projected to remain 1,100 through 2019[11] |
| Color(s) | Blue and White |
| Mascot | Buffalo |
| Newspaper | Blue & White |
| Yearbook | Blunita |
| Budget |
$18,076,885 (2015-16)[12] |
| Per pupil Spending | $12,622 (2008) |
| Website | http://www.newportsd.org/ |
Newport School District is a small, rural, public school district which is situated in the town of Newport, Pennsylvania, located in the eastern section of Perry County along the Juniata River 23 miles (37 km) northwest of Harrisburg, the Capital. The District encompasses about 73 square miles (190 km2). The District serves several small communities including: the borough of Newport, Buffalo Township, Howe Township, Juniata Township, Miller Township, and Oliver Township. According to the US Census Bureau, in 2010, Newport School District served a resident population of 7,451 people. According to 2000 federal census data it served a resident population of 7,500 people. The educational attainment levels for the population 25 and over were 85.2% high school graduates and 14.7% college graduates.[15] The District is one of the 500 public school districts of Pennsylvania.
According to the Pennsylvania Budget and Policy Center, 45.1% of the District’s pupils lived at 185% or below the Federal Poverty Level as shown by their eligibility for the federal free or reduced price school meal programs in 2012.[16] In 2013, the Pennsylvania Department of Education, reported that 13 students in Newport School District were homeless.[17] In 2009, the District residents’ per capita income was $18,684, while the median family income was $46,240.[18] In Perry County, the median household income was $57,375.[19] In the Commonwealth, the median family income was $49,501 [20] and the United States median family income was $49,445, in 2010.[21] In 2014, the median household income in the USA was $53,700.[22]
According to District officials, in school year 2009-10 the Newport School District provided basic educational services to 1,173 pupils. The District employed: 110 teachers, 52 full-time and part-time support personnel, and 9 administrators. Newport School District received more than $8.2 million in state funding in school year 2009-10. In 2013-14, Newport School District provided basic educational services to 1,080 pupils. It employed: 94 teachers, 44 full-time and part-time support personnel, and 6 administrators. Newport School District received more than $8,625,413 in state funding in school year 2013-14.[23]
Newport School District operates two schools: one PreK-5 elementary school, one 6-12 middle/high school, and the District administrative office. Newport High School students may choose to attend Cumberland Perry Area Vocational Technical School for training in several vocations including: allied health careers, mechanical trades, building trades and culinary arts. Newport School District is served by the Capital Area Intermediate Unit IU15 which offers a variety of services, including a completely developed K-12 curriculum that is mapped and aligned with the Pennsylvania Academic Standards (available online), shared services, a group purchasing program and a wide variety of special education and special needs services.
Governance
Newport School District is governed by 9 individually elected board members (serve four-year terms), the Pennsylvania State Board of Education, the Pennsylvania Department of Education and the Pennsylvania General Assembly.[24] The federal government controls programs it funds like Title I funding for low-income children in the Elementary and Secondary Education Act and the No Child Left Behind Act, (renamed Every Student Succeeds Act (ESSA) in December 2015) which mandates the district focus its resources on student success in acquiring reading and math skills.[25] The school board is required by state law to post a financial report on the district in its website by March of each school year.[26]
The Superintendent and Business Manager are appointed by the school board. The Business Manager is responsible for budget and financial operations. Neither of these District officials are voting members of the School Board. The School Board enters into individual employment contracts for these positions. In Pennsylvania, public school districts are required to give 150 days notice to the Superintendent regarding renewal of the employment contract.[27] The School Board enters into individual employment contracts for these positions. These contracts must be in writing and are subject to public disclosure under the state’s Right to Know Act. In Pennsylvania, public school districts are required to give 150 days notice to the Superintendent and Business Manager regarding renewal of their employment contracts.[28] Pursuant to Act 141 of 2012 which amended the Pennsylvania School Code, all school districts that have hired superintendents on/after the fall of 2012 are required to develop objective performance standards and post them on the district’s website.[29]
The Commonwealth Foundation for Public Policy Alternatives Sunshine Review gave the Newport School Board and Newport School District Administration a "D-" for transparency based on a review of "What information can people find on their school district's website". It examined the school district's website for information regarding; taxes, the current budget, meetings, school board members names and terms, contracts, audits, public records information and more.[30]
Schools
All three schools maintain a full-time student assistance program and extra instructional support for all students. An alternative education program is offered on-site after-school. The Zone after-school program provides after-school activities for students at the elementary and middle level. Art and music departments offer students instruction in instrumental music, voice, music theory, drawing & painting, ceramics, design, and glasswork. Students may participate in marching band, orchestral band, jazz band, chorus, and Innovations, our premier singing ensemble. The high school also has journalism classes and produces a high school newspaper, the Blue & White several times during the school year. In addition, students may participate in audio-visual activities at our television studios at both buildings where several students have produced quality news and human interest reports. The district offers a gifted acceleration program.
Academic achievement
In 2016, Newport School District ranked 287th out of 493 Pennsylvania public school districts, by the Pittsburgh Business Times.[31] The ranking is based on the last 3 years of student academic achievement as demonstrated by PSSAs results in: reading, writing, math and science and the three Keystone Exams (literature, Algebra 1, Biology I) in high school.[32] Three school districts were excluded because they do not operate high schools (Saint Clair Area School District, Midland Borough School District, Duquesne City School District). The PSSAs are given to all children in grades 3rd through 8th. Adapted PSSA examinations are given to children in the special education programs. Writing exams were given to children in 5th and 8th grades.
|
|
|
- Overachievers Ranking
In April 2013, the Pittsburgh Business Times reported an Overachievers Ranking for 498 Pennsylvania school districts. Newport School District ranked 398th. The paper describes the ranking as: "the ranking answers the question - which school districts do better than expectations based upon economics? This rank takes the Honor Roll rank and adds the percentage of students in the district eligible for free and reduced-price lunch into the formula. A district finishing high on this rank is smashing expectations, and any district above the median point is exceeding expectations." [40]
- 2012 - 421st
- 2011 - 449th
- 2010 - 464th [41]
- 2009 - 478th
In January 2011, the Pennsylvania Department of Education identified Newport School District as in the bottom 5% of the state's school districts, for student academic achievement.[42] This mean the students were qualified for Education Opportunity Scholarships to attend another school: public charter, private, parochial or public cyber charter school. In 2009, the student achievement of the district fell in the 11th percentile among the 500 school districts in Pennsylvania. (0-99; 100 is state best)[43]
District AYP status history
In 2012, Newport School District achieved AYP status In 2011, Newport School District achieved Adequate Yearly Progress (AYP). In 2011, 94 percent of the 500 Pennsylvania public school districts achieved the No Child Left Behind Act progress level of 72% of students reading on grade level and 67% of students demonstrating on grade level math. In 2011, 46.9 percent of Pennsylvania school districts achieved Adequate Yearly Progress (AYP) based on student performance. An additional 37.8 percent of school districts made AYP based on a calculated method called safe harbor, 8.2 percent on the growth model and 0.8 percent on a two-year average performance.[44] Newport School District achieved AYP status each year from 2004 to 2010, while in 2003 the District was in Warning AYP status due to lagging student achievement.[45]
Graduation rate
In 2016, the District’s graduation rate increased to 94.44%.[46]
- 2015 - 92.91%.[47]
- 2014 - 91.76%.[48]
- 2013 - 90%.[49]
- 2012 - 80%. The graduation rate for males was 70%, while the graduation rate for females was 90%.[50]
- 2011 - 82%.[51] In 2010, the Pennsylvania Department of Education issued a new, 4-year cohort graduation rate.
- 2010 - 82% new four year rate[52]
- Former calculation graduation rate
High school
Newport High School is located at 500 Caroline Street, Newport. In 2016, enrollment continued to decline with just 311 pupils in 9th through 12th grades, with 47% of pupils eligible for a free lunch due to the family meeting the federal federal poverty level. Additionally, 22% of pupils received special education services, while 2.89% of pupils were identified as gifted.[57] The school employed teachers.[58] Per the PA Department of Education, 100% of the teachers were rated "Highly Qualified" under the federal No Child Left Behind Act.[59]
In 2013, enrollment was reported as 333 pupils in 9th through 12th grades, with 33% of pupils eligible for a free lunch due to family poverty. Additionally, 22% of pupils received special education services, while 3% of pupils were identified as gifted. The school employed 27 teachers.[60] Per the PA Department of Education 100% of the teachers were rated "Highly Qualified" under the federal No Child Left Behind Act. According to the National Center for Education Statistics, in 2010, Newport High School had 370 pupils, in grades 9th through 12th, with 130 students receiving a federal free or reduced-price lunch due to family poverty. The school employed 29 teachers, yielding a student–teacher ratio of 12:1.[61]
- 2016 School Performance Profile
SPP declined to 62.6 out of 100 points. Newport High School Keystone Exams mandated testing results were: 80% of students were on grade level in reading.literature and 67% of students demonstrated on grade level in Algebra I. In Biology I, 67% of pupils demonstrated on grade level science understanding at the end of the Biology course.[62] The requirement that pupils pass the Keystone Exams in reading, algebra I and bIology I in order to graduate was postponed until 2019 by the Pennsylvania General Assembly because less than 60% of 12 grade pupils statewide would have been eligible for graduation from high school due to failing one or more Keystone Exams.[63] Fifty-four percent of the 2,676 public schools in Pennsylvania achieved a passing score of 70 or better.[64]
- 2015 School Performance Profile
Newport High School achieved 63.2 out of 100. Reflects on grade level reading, mathematics and science achievement. The PDE reported that 78% of the High School’s students were on grade level in reading/literature. In Algebra 1, 71% of students showed on grade level skills at the end of the course. In Biology I, 70% demonstrated on grade level science understanding at the end of the course.[65] Statewide, 53 percent of schools with an eleventh grade achieved an academic score of 70 or better. Five percent of the 2,033 schools with 11th grade were scored at 90 and above; 20 percent were scored between 80 and 89; 28 percent between 70 and 79; 25 percent between 60 and 69 and 22 percent below 60. The Keystone Exam results showed: 73 percent of students statewide scored at grade-level in English, 64 percent in Algebra I and 59 percent in biology.[66][67]
- 2014 School Performance Profile
Newport High School achieved 76.8 of 100. Reflects on grade level reading, mathematics and science achievement. In reading/literature - 82.8% were on grade level. In Algebra 1, 67.5% showed on grade level skills. In Biology, 57.69% demonstrated on grade level science understanding at the end of the course.[68][69] Statewide, the percentage of high school students who scored proficient and advanced in Algebra I increased to 39.7% to 40.1%. The percentage of high school students who scored proficient and advanced in reading/literature declined to 52.5%. The percentage of high school students who scored proficient and advanced in biology improved from 39.7% to 41.4%.[70]
- 2013 School Performance Profile
Newport High School achieved 86.2 out of 100. Reflects on grade level reading, mathematics and science achievement. In reading/literature - 81% were on grade level. In Algebra 1, 76% showed on grade level skills. In Biology, 60% showed on grade level science understanding.[71] According to the Pennsylvania Department of Education, 2,181 public schools (less than 73 percent of Pennsylvania public schools), achieved an academic score of 70 or higher. Pennsylvania 11th grade students no longer take the PSSAs. Instead, beginning in 2012, they take the Keystone Exams at the end of the associated course.[72]
The Newport High School was an inaugural participant in Project720. It was a participant in Project540 through the University of Pennsylvania. The high school offers an academy system which allows students to specialize in one of two areas; Arts & Humanities or Science & Industry. AP courses are offered in all core subject areas and full-range agricultural education, business education and technology education programs are available for all students. Approximately 50 students attend Cumberland Perry Career and Technical School annually.
- AYP history
In 2012, Newport High School achieved AYP status even though it missed all measured metrics and the graduation rate. In 2011, the school was in Making Progress: in School Improvement I AYP status. Newport High School is in School Improvement Level 1 status due to chronically low academic achievement through 2010.[73] The school is eligible for School improvement grants to raise student academic achievement.
In August 2010, the high school was required by the No Child Left Behind law to notify students that they could transfer out of the Newport High School to another high school within the district due to Newport High School's chronic low achievement in reading and mathematics.[74]
In a November 2010 report by The 21st Century Partnership for STEM Education, Newport High School was cited as the most regressed district in Pennsylvania on the 11th Grade Math PSSA from 2004 to 2010. The study found the 11th grade math average dropped almost 30 percentage points on the test.[75]
In a February 2011, Newport School District Strategic Plan Report to the Pennsylvania Department of Education, the school administration acknowledged it had not revised the curriculum, nor implemented other academic achievement improvement strategies that had been stated in its 2008 strategic plan.[76]
- PSSA Results:
Pennsylvania System of School Assessments, commonly called PSSAs are No Child Left Behind Act related examinations which were administered from 2003 through 2012, in all Pennsylvania public high schools. The exams were administered in the Spring of each school year. The goal was for 100% of students to be on grade level or better in reading and mathematics, by the Spring of 2014. The tests focused on the state's Academic Standards for reading, writing, mathematics and science. The Science exam included content in science, technology, ecology and the environmental studies. The mathematics exam included: algebra I, algebra II, geometry and trigonometry. The standards were first published in 1998 and are mandated by the Pennsylvania State Board of Education.[77]
In 2013, the Commonwealth of Pennsylvania changed its high school assessments to the Keystone Exams in Algebra 1, Reading/literature and Biology1. The exams are given at the end of the course, rather than all in the spring of the student's 11th grade year.[78]
- 11th Grade Reading
- 2012 - 63% on grade level, (19% below basic). State - 67% of 11th graders are on grade level.[79]
- 2011 - 61% (15% below basic). State - 69.1% [80]
- 2010 - 53%, State - 67% [81]
- 2009 - 58.7%, State - 65%
- 2008 - 58%, State - 65%
- 2007 - 59%, State - 65%
- 2006 - 52%, State - 65%
- 11th Grade Math:
- 2012 - 49%, on grade level (28% below basic). In Pennsylvania, 59% of 11th graders are on grade level.[82]
- 2011 - 45%, (29% below basic). State - 60.3%
- 2010 - 25%, State - 59% [83]
- 2009 - 41%, State - 56% [84]
- 2008 - 49%, State - 56%
- 2007 - 44%, State - 53% [85]
- 2006 - 49%, State - 52% [86]
- 11th Grade Science:
- 2012 - 36% on grade level (10% below basic). State - 42% of 11th graders were on grade level.
- 2011 - 44% (16% below basic). State - 40% [87]
- 2010 - 29%, State - 30%
- 2009 - 26%, State - 40%
- 2008 - 34%, State - 39% [88]
Science in Motion Newport High School did not take advantage of a state program called Science in Motion which brought college professors and sophisticated science equipment to the school to raise science awareness and to provide inquiry-based experiences for the students. The Science in Motion program was funded by a state appropriation and cost the school nothing to participate.[89] Elizabethtown College provides the experiences to schools in the region.
College remediation
According to a Pennsylvania Department of Education study released in January 2009, 44% of Newport School District graduates required remediation in mathematics and or reading before they were prepared to take college level courses in the Pennsylvania State System of Higher Education or community colleges.[90] Less than 66% of Pennsylvania high school graduates, who enroll in a four-year college in Pennsylvania, will earn a bachelor's degree within six years. Among Pennsylvania high school graduates pursuing an associate degree, only one in three graduate in three years.[91] Per the Pennsylvania Department of Education, one in three recent high school graduates who attend Pennsylvania's public universities and community colleges takes at least one remedial course in math, reading or English.
SAT scores
In 2016, 24 Newport School District students took the SAT exams. The District's Verbal Average Score was 524. The Math average score was 535. The Writing average score was 493.[92] The College Board also reported that statewide 92,569 pupils took the exams with average scores declining again in all three measurers to: 494 in reading, 508 in math and 482 in writing.[93] Among the 12 high schools in the CSIU16 region, Area High School ranked th which was above the state average.[94] Nationally, 1,681,134 students took the SATs.[95]
In 2015, 39 Newport School District students took the SAT exams. The District's Verbal Average Score was 473. The Math average score was 483. The Writing average score was 457.[96] The College Board also reported that statewide 96,826 pupils took the exams with average scores declining in all three measurers to: 495 in reading, 511 in math and 484 in writing.[97]
In 2014, 42 Newport School District students took the SAT exams. The District's Verbal Average Score was 495. The Math average score was 489. The Writing average score was 470.[98][99] Statewide in Pennsylvania, Verbal Average Score was 497. The Math average score was 504. The Writing average score was 480. The College Board also reported that nationwide scores were: 497 in reading, 513 in math and 487 in writing.[100] In 2014, 1,672,395 students took the SATs in the United States.
In 2013, 37 Newport School District students took the SAT exams. The District's Verbal Average Score was 481. The Math average score was 473. The Writing average score was 455. The College Board reported that statewide scores were: 494 in reading, 504 in math and 482 in writing. The nationwide SAT results were the same as in 2012.[101]
In 2012, 37 Newport School District students took the SAT exams. The District's Verbal Average Score was 513. The Math average score was 491. The Writing average score was 496. The statewide Verbal SAT exams results were: Verbal 491, Math 501, Writing 480. In the USA, 1.65 million students took the exams achieving scores: Verbal 496, Math 514, Writing 488. According to the College Board the maximum score on each section was 800, and 360 students nationwide scored a perfect 2,400.
In 2011, 28 students took the SAT exams. The district's Verbal Average Score was 460. The Math average score was 476. The Writing average score was 442.[102] Pennsylvania ranked 40th among state with SAT scores: Verbal - 493, Math - 501, Writing - 479.[103] In the United States 1.65 million students took the exam in 2011. They averaged 497 (out of 800) verbal, 514 math and 489 in writing.[104]
The Pennsylvania Department of Education compared the SAT data of students in rural areas of Pennsylvania to students in urban areas. From 2003 to 2005, the average total SAT score for students in rural Pennsylvania was 992, while urban students averaged 1,006. During the same period, 28 percent of 11th and 12th graders in rural school districts took the exam, compared to 32 percent of urban students in the same grades. The average math and verbal scores were 495 and 497, respectively, for rural students, while urban test-takers averaged 499 and 507, respectively. Pennsylvania’s SAT composite score ranked low on the national scale in 2004. The composite SAT score of 1,003 left Pennsylvania ranking 44 out of the 50 states and Washington, DC.[105]
Dual enrollment
Newport High School offers a dual enrollment program. This state program permits high school students to take courses, at local higher education institutions, to earn college credits. Students remain enrolled at their high school. The courses count towards high school graduation requirements and towards earning a college degree. The students continue to have full access to activities at their high school. The college credits are offered at a deeply discounted rate. The state offers a small grant to assist students in costs for tuition, fees and books.[106] Under the Pennsylvania Transfer and Articulation Agreement, many Pennsylvania colleges and universities accept these credits for students who transfer to their institutions.[107] For the 2009-10 funding year, the school district received a state grant of $5,008 for the program.
Graduation requirements
The Newport School Board requires that each candidate for graduation earn twenty-four (24) credits.[108]
By Pennsylvania School Board regulations, beginning with the class of 2017, public school students must demonstrate successful completion of secondary level course work in Algebra I, Biology, and English Literature by passing the Keystone Exams.[109] The exam is given at the end of the course. Keystone Exams replace the PSSAs for 11th grade.[110]
Students have several opportunities to pass the exam. Schools are mandated to provide targeted assistance to help the student be successful. Those who do not pass after several attempts can perform a project in order to graduate.[111][112] For the class of 2019, a Composition exam will be added. For the class of 2020, passing a civics and government exam will be added to the graduation requirements.[113] In 2011, Pennsylvania high school students field tested the Algebra 1, Biology and English Lit exams. The statewide results were: Algebra 1 38% on grade level, Biology 35% on grade level and English Lit - 49% on grade level.[114] Individual student, school or district reports were not made public, although they were reported to district officials by the Pennsylvania Department of Education. Students identified as having special needs and qualifying for an Individual Educational Program (IEP) may graduate by meeting the requirements of their IEP.
AP Courses
In 2013, Newport High School offered 4 Advanced Placement (AP) courses at a higher cost than regular courses. The student pays the fee for the exam which was $89 per test per pupil in 2012. The fee for each AP Exam was $93 (2016).[115] Students have the option of taking College Board approved courses and then taking the College Board's examination in the Spring. Students, who achieve a 3 or better on the exam, may be awarded college credits at US universities and colleges. Each higher education institution sets its own standards about what level of credits are awarded to a student based on their AP exam score. Most higher education give credits for scores of 4 or 5. Some schools also give credits for scores of 3. High schools give credits towards graduation to students who take the school's AP class. At Newport High School 64% of students who took an AP course earned a 3 or better on the exam.[116]
- 2014 - Newport High School offered 5 AP courses, with 42.7% of pupils who took the course earning a 3 or better on the AP exam.[117]
- 2015 - just 18% of pupils at Newport High School, who took the AP course, earned a 3 or better on the AP exam.[118]
- 2016 - Newport High School offered 7 courses, with a 37.5% of pupils who took the course, earning a 3 or better on the AP exam.[119]
Middle school
Newport Middle School is housed on the third floor of the middle/high school building. In 2016, enrollment was 254 pupils, in grades 6th through 8th, with 53% of pupils eligible for a free lunch due to family poverty. Additionally, 19.6% of pupils received special education services, while less than 1% of pupils were identified as gifted.[120] According to a 2014 report by the Pennsylvania Department of Education, 95% of its teachers were rated "Highly Qualified" under No Child Left Behind.[121]
In 2013, enrollment was 260 pupils, in grades 6th through 8th, with 43% of pupils eligible for a free lunch due to family poverty. Additionally, 22% of pupils received special education services, while 2.6% of pupils were identified as gifted.[122] According to a 2013 report by the Pennsylvania Department of Education, 100% of its teachers were rated "Highly Qualified" under No Child Left Behind.[123] In 2010, Newport Middle School had 246 pupils enrolled in grades 6th through 8th, with 97 receiving a federal free or reduced-price lunch due to family poverty. The school employed 24 teachers, yielding a student–teacher ratio of 10:1.[124] The school offers a full range of activities in addition to a core curriculum.
- 2016 School Performance Profile
SPP declined to 57 points out of 100 points. Newport Middle School PSSA mandated testing results were: 55% of students in 8th grade were on grade level in reading, while just 33% of students demonstrated on grade level in mathematics. In science, 57% of eighth grade pupils demonstrated on grade level science understanding.[125] In 7th grade, just 44% of pupils were on grade level in reading, while only 23% demonstrated on grade level math skills. Among 6th graders, 57% were on grade level in reading and only 33% were on grade level in math
- 2015 School Performance Profile
The PDE withheld SPP scores. It was reported that 60% of 8th grade students at Newport Middle School students were on grade level in reading on the PSSAs given in April 2015. In math/Algebra 1, only 27% of 8th grade students showed on grade level skills. In science, 61% of the school’s 8th graders demonstrated on grade level science understanding. No eighth grade writing scores were reported. In 7th grade, 52% were on grade level in reading, while 47% showed on grade level math skills. Among 6th graders, 50% were on grade level in reading and 26% were on grade level in mathematics.[126] Statewide 58% of eighth (8th) graders were on grade level in reading, while 29% demonstrated on grade level math skills. Pennsylvania 7th graders were 58% on grade level in reading and 33% demonstrated on grade level math skills. Among sixth (6th) graders, 60.7% were reading on grade level, while 39.7% demonstrated on grade level math skills.[127]
- 2014 School Performance Profile
Newport Middle School achieved 84.2 out of 100. Reflects on grade level reading, mathematics and science achievement. In reading/literature - 74% were on grade level. In Algebra 1/Math, 82.9% showed on grade level mathematics skills. In Science, 62%% of 8th graders showed on grade level science understanding. In writing, 81% of the 8th grade students demonstrated on grade level writing skills.[128]
- 2013 School Performance Profile
Newport Middle School achieved 77.8 out of 100. Reflects on grade level reading, writing, mathematics and science achievement. In reading, just 71% of the students were on grade level. In Mathematics/Algebra 1, 78% of the students showed on grade level skills. In Science, only 58% of the 8th graders demonstrated on grade level understanding. In writing, only 59% of the 8th grade students demonstrated on grade level writing skills.[129]
- Dropout Early Warning System
In 2013, Newport School District did not implement a no cost dropout prevention Early Warning System and Interventions Catalog at the junior high school.[130] The process identifies students at risk for dropping out by examining the pupil’s: attendance, behavior and course grades. Interventions are implemented to assist at-risk pupils to remain in school. The program is funded by federal and private dollars.[131]
AYP history
In 2011 and 2012, Newport Middle School achieved Adequate Yearly Progress (AYP) status even though it missed every academic metric measured.[132] Many students at the Newport Middle School did not achieve adequate yearly progress in 2009 and 2010.[133] This resulted in the school being placed in School Improvement level 1 by the Pennsylvania Department of Education in 2009 and 2010. The administration was required to develop a plan to improve student achievement and to submit it to the PDE for approval. In 2008, Newport Middle School was in Warning AYP status due to lagging student achievement.[134]
- PSSA results
Pennsylvania System of School Assessments, are examination given in the Spring of each school year. Sixth and seventh grades have been tested in reading and mathematics since 2006. Eighth graders are tested in: reading, writing, mathematics and Science. Beginning in the Spring of 2013, eighth graders, who are enrolled in Algebra I take the Keystone Exam for Algebra I at the end of the course. The testing of 8th grade in reading and mathematics began in 1999.[135] Testing in science began in 2007. The goal is for 100% of students to be on grade level or better in reading and mathematics, by the Spring of 2014. The tests focus on the state's Academic Standards for reading, writing, mathematics and science.[136] The standards were published in 1998 and are mandated by the Pennsylvania State Board of Education.[137] In 2014, the Commonwealth adopted the Pennsylvania Core Standards - Mathematics.[138]
- 8th Grade Reading:
- 2012 - 69% on grade level (19% below basic). In Pennsylvania, 79% of 8th graders on grade level.[139]
- 2011 - 72%, (10% below basic). State - 81.8%
- 2010 - 78%, (13% below basic). State - 81%[140]
- 2009 - 76% (12% below basic). State - 80%[141]
- 2008 - 71%, State - 78%
- 8th Grade Math:
- 2012 - 62% on grade level (19% below basic). In Pennsylvania, 76% of 8th graders are on grade level
- 2011 - 67%, (11% below basic). State - 76.9% [142]
- 2010 - 70%, (22% below basic). State - 75%
- 2009 - 60% (18% below basic), State - 71%
- 2008 - 66%, State - 70% [143]
- 8th Grade Science:
- 2012 - 56% on grade level (28% below basic). State – 59% of 8th graders were on grade level.
- 2011 - 42%, (31% below basic). State – 58.3%
- 2010 - 45%, (32% below basic). State - 57%
- 2009 - 54% (24% below basic), State - 54%
- 2008 - 41%, State - 52%
|
|
|
|
Elementary School
Newport Elementary School is located at 559 North 5th Street, Newport. In 2016, the School's enrollment was 477 pupils in grades kindergarten through 5th, with 60% of pupils receiving a federal free or reduced price meals due to family poverty. Additionally, 19% of the pupils receive special education services, while less than 1% are identified as gifted.[146] According to a report by the Pennsylvania Department of Education, 100% of the teachers were rated highly qualified under No Child Left Behind. The school provides full day kindergarten.[147] The school is a federally designated Title I school.
In 2013, Newport Elementary School's enrollment was pupils in grades kindergarten through 5th, with 52,8% of pupils receiving a federal free or reduced price meals due to family poverty. Additionally, 17% of the pupils receive special education services, while no children were identified as gifted.[148] According to a report by the Pennsylvania Department of Education, 100% of the teachers were rated highly qualified under No Child Left Behind. Newport Elementary School provides full day kindergarten.[149] The school is a federally designated Title I school.
According to the National Center for Education Statistics, in 2010, Newport Elementary School had 564 pupils, in grades kindergarten through 5th, with 261 students receiving a federal free or reduced-price lunch due to family poverty. The school employed 49 teachers, yielding a student–teacher ratio of 11:1.[150] Newport Elementary School offers small class sizes and specials in art, music, speech, technology, science, and health & PE. The elementary features full-day kindergarten, a student-operated television studio, and an elementary student assistance program.
- 2016 School Performance Profile
SPP just 64 out of 100 points Newport Elementary School PSSA mandated testing results were: 68% of students in 5th grade were on grade level in reading, while just 43% of students demonstrated on grade level mathematics skills. In 4th grade, 62% were on grade level in reading, while only 39% demonstrated on grade level math skills. In science, 78% of fourth grade pupils demonstrated on grade level understanding of science concepts in the state standards. Among the school's third graders, 53% were on grade level in reading and 55% showed on grade level mathematics skills.[151][152]
- 2015 School Performance Profile
The SPP withheld by the PDE. According to the Pennsylvania Department of Education, 63% of 5th grade students at Newport Elementary School were on grade level in reading on the PSSAs given in April 2015. In mathematics, just 42% of 5th grade students showed on grade level skills. No fifth grade writing scores were reported. In 4th grade, 66% were on grade level in reading, while only 44% showed on grade level math skills. In science, 87% of fourth graders showed on grade level understanding. Among third (3rd) graders, just 60% were on grade level in reading and only 43% were on grade level in mathematics.[153] Statewide 61.9% of fifth (5th) graders were on grade level in reading, while 42.8% demonstrated on grade level math skills. Pennsylvania 4th graders were 58.6% on grade level in reading and 44.4% demonstrated on grade level math skills. In science, 77.3% of fourth graders showed on grade level understanding. Among Pennsylvania third (3rd) graders, 62% were reading on grade level, while 48.5% demonstrated on grade level math skills.[154]
- 2014 School Performance Profile
Newport Elementary School achieved a score of 72.3 out of 100. The score reflects on grade level: reading, science, writing and mathematics achievement. In 2013-14, only 65% of the students were reading on grade level in grades 3rd through 5th. In 3rd grade, 80% of the pupils were reading on grade level. In math, 76% were on grade level (3rd-5th grades). In 4th grade science, 87% of the pupils demonstrated on grade level understanding. In writing, only 30.6% of 5th grade pupils demonstrated on grade level skills.[155]
- 2013 School Performance Profile
Newport Elementary School achieved a score of 71.8 out of 100. The score reflects on grade level: reading, science, writing and mathematics achievement. In 2012-13, only 67% of the students were reading on grade level in grades 3rd through 5th. In 3rd grade, 75% of the pupils were reading on grade level. In math, 80 were on grade level (3rd-5th grades). In 4th grade science, 81% of the pupils demonstrated on grade level understanding. In writing, only 59% of 5th grade pupils demonstrated on grade level writing skills.[156]
- AYP History
In 2012, Newport Elementary school declined to Warning AYP status due to lagging student achievement. Although the student achievement was universally below state level in 2011, the School was rated as making Adequate Yearly Progress.[157] In 2010, the District reported a 95% attendance rate at the elementary school. The school achieved AYP status in 2009 and 2010. In 2008, the School declined to Warning AYP status due to low student academic achievement.[158] The school provided All Day Kindergarten since 2008.
- PSSA Results
Each year, in the Spring, the 3rd graders take the PSSAs in math and reading. The fourth grade is tested in reading, math and science. The fifth grade is evaluated in reading, mathematics and writing. Pennsylvania System of School Assessments, commonly called PSSAs are No Child Left Behind Act related examinations which were administered beginning 2003 to all Pennsylvania public school students in grades 3rd-8th.[159] The goal was for 100% of students to be on grade level or better in reading and mathematics, by the Spring of 2014.[160][161][162] The tests focused on the state's Academic Standards for reading, writing, mathematics and science. The Science exam is given to 4th grades and includes content in science, technology, ecology and the environmental studies.[163]
|
|
|
|
- 4th Grade Science:
- 2012 - 90%, (1% below basic), State – 82%
- 2011 - 83%, (3% below basic), State – 82.9%
- 2010 - 77% on grade level, State - 81%
- 2009 - 84%, State - 83%
- 2008 - 69%, State - 81%
|
|
Preschool
Newport School District operates a preschool that is funded by a state Pre K Counts grant.[168][169] Perry County Early Childhood, Newport Public Library, Head Start, and the Girl Scouts of the USA all partner with Newport Elementary to provide a preschool activity night called “Play Stations”. Newport Elementary also operates the only PreK program in Perry County.
Special education
In December 2015, the District administration reported that 219 pupils or 20.9% of the district's pupils received Special Education services, with 50.7% of the identified students having a specific learning disability.[170]
In 2011, Newport School District administration reported that 223 students received special education services with 52% of identified students having a specific learning disability. In 2010, the District Administration reported that 238 pupils or 20% of the District's pupils received Special Education services with 55% of identified students having specific learning disabilities. In 2009, Newport School District Administration reported that 236 pupils or 20% of the district's pupils received Special Education services.[171]
In 2007, Pennsylvania Secretary of Education Gerald Zahorchak testified before the Pennsylvania House Education Committee regarding full day kindergarten. He claimed that districts which offered the program would see a significant decrease in special education students due to early identification and early intervention. He asserted the high cost of full day kindergarten would be recouped by Districts in lower special education costs.[172] Newport School District has provided full day kindergarten since 2008. The District has seen no decrease in the percentage of special education students it serves, yielding no savings
The District engages in identification procedures to ensure that eligible students receive an appropriate educational program consisting of special education and related services, individualized to meet student needs. At no cost to the parents, these services are provided in compliance with state and federal law; and are reasonably calculated to yield meaningful educational benefit and student progress. To identify students who may be eligible for special education, various screening activities are conducted on an ongoing basis. These screening activities include: review of group-based data (cumulative records, enrollment records, health records, report cards, ability and achievement test scores); hearing, vision, motor, and speech/language screening; and review by the Instructional Support Team or Student Assistance Team. When screening results suggest that the student may be eligible, the District seeks parental consent to conduct a multidisciplinary evaluation. Parents who suspect their child is eligible may verbally request a multidisciplinary evaluation from a professional employee of the District or contact the Special Education Department.[173]
In 2010, the state of Pennsylvania provided $1,026,815,000 for special education services. The funds were distributed to districts based on a state policy which estimates that 16% of the district's pupils are receiving special education services. This funding is in addition to the state's basic education per pupil funding, as well as, all other state and federal funding.[174] The Special Education funding structure is through the federal Individuals with Disabilities Education Act (IDEA) funds and state appropriations. IDEA funds are appropriated to the state on an annual basis and distributed through intermediate units (IUs) to school districts, while state funds are distributed directly to the districts. Total funds that are received by school districts are calculated through a formula. The Pennsylvania Department of Education oversees four appropriations used to fund students with special needs: Special Education; Approved Private Schools; Pennsylvania Chartered Schools for the Deaf and Blind; and Early Intervention. The Pennsylvania Special Education funding system assumes that 16% of the district’s students receive special education services. It also assumes that each student’s needs accrue the same level of costs.[175] Over identification of students, in order to increase state funding, has been an issue in the Commonwealth. Some districts have more than 20% of its students receiving special education services while others have 10% supported through special education.[176] The state requires each public school district and charter school to have a three-year special education plan to meet the unique needs of its special education students.[177] In 2012, the Obama Administration's US Department of Education issued a directive that schools include students with disabilities in extracurricular activities, including sports.[178]
Newport School District received a $833,205 supplement for special education services in 2010.[179] For the 2011-12 school year, 2012-13 school year and the 2013-14 school year, all Pennsylvania public school districts received the same level of funding for special education that they received in 2010-11. This level funding was provided regardless of changes in the number of pupils who need special education services and regardless of the level of services the respective students required.[180][181]
- 2014-15 school year, Newport School District received an increase to $852,773 from the Commonwealth for special education funding.[182]
- 2015-16 - $882,341
- 2016-17 - Newport School District received a 2.2% increase in state special education funding to $901,593.[183]
Additionally, the state provides supplemental funding for extraordinarily impacted students. The District must apply for this added funding.
Gifted education
The Newport School District Administration reported that 19 or 1.61% of its students were gifted in 2009.[184] By law, the district must provide mentally gifted programs at all grade levels. The primary emphasis is on enrichment and acceleration of the regular education curriculum through a push in model with the gifted instructor in the classroom with the regular instructor. Students identified as gifted attending the High School have access to dual enrollment with local colleges. The referral process for a gifted evaluation can be initiated by teachers or parents by contacting the student’s building principal and requesting an evaluation. All requests must be made in writing. To be eligible for mentally gifted programs in Pennsylvania, a student must have a cognitive ability of at least 130 as measured on a standardized ability test by a certified school psychologist. Other factors that indicate giftedness will also be considered for eligibility.[185]
School safety and bullying
The Newport School District administration reported there was one incident of bullying in the District in 2012. Additionally, there were 10 assaults on students and no sexual incidents involving students. The local law enforcement was involved in eight incidents at the schools, with four arrests.[186] [187] Each year the school safety data is reported by the district to the Safe School Center which then publishes the compiled reports online. Nationally, nearly 20% of pupils report being bullied at school.[188]
The Newport School Board has provided the district's antibully policy online.[189] All Pennsylvania schools are required to have an anti-bullying policy incorporated into their Code of Student Conduct. The policy must identify disciplinary actions for bullying and designate a school staff person to receive complaints of bullying. The policy must be available on the school's website and posted in every classroom. All Pennsylvania public schools must provide a copy of its anti-bullying policy to the Office for Safe Schools every year, and shall review their policy every three years. Additionally, the District must conduct an annual review of that policy with students.[190] The Center for Schools and Communities works in partnership with the Pennsylvania Commission on Crime & Delinquency and the Pennsylvania Department of Education to assist schools and communities as they research, select and implement bullying prevention programs and initiatives.[191][192]
Education standards relating to student safety and anti harassment programs are described in the 10.3. Safety and Injury Prevention in the Pennsylvania Academic Standards for Health, Safety and Physical Education.[193]
Safe School grant
In 2013, Newport School District did not participate in a state Safe Schools Targeted Grant. The maximum of $25,000 grants were awarded through a competitive application process.[194] The funds must be used for research based interventions, like: peer mediation, staff training in managing behavioral issues and creating a positive school climate. The District also did not participate in the state's School Resource Officer and Police Officer grants.
Budget
Pennsylvania public school districts budget and expend funds according to procedures mandated by the General Assembly and the Pennsylvania Department of Education (PDE). An annual operating budget is prepared by school district administrative officials. A uniform form is furnished by the PDE and submitted to the board of school directors for approval prior to the beginning of each fiscal year on July 1.
Under Pennsylvania’s Taxpayer Relief Act, Act 1 of the Special Session of 2006, all school districts of the first class A, second class, third class and fourth class must adopt a preliminary budget proposal. The proposal must include estimated revenues and expenditures and the proposed tax rates. This proposed budget must be considered by the Board no later than 90 days prior to the date of the election immediately preceding the fiscal year. The preliminary budget proposal must also be printed and made available for public inspection at least 20 days prior to its adoption. The board of school directors may hold a public hearing on the budget, but are not required to do so. The board must give at least 10 days’ public notice of its intent to adopt the final budget according to Act 1 of 2006.[195]
In 2016, the average teacher salary in Newport School District was $59,532 a year. The District employed 101 teachers and a top salary of $112,750.[196][197]
In 2013, the average teacher salary in Newport School District was $54,923 a year, while the cost of the benefits teachers received was $23,562 per employee, for a total annual average teacher compensation of $78,486.[198] The District employed 200 teachers with an average salary of $59,911 and a top salary of $127,000.[199][200] Newport School District teacher and administrator retirement benefits are equal to at least 2.00% x Final Average Salary x Total Credited Service. (Some teachers benefits utilize a 2.50% benefit factor.) [201] After 40 years of service, a teacher can retire with 100% of the average salary of their final 3 years of employment. According to a study conducted at the American Enterprise Institute, in 2011, public school teachers’ total compensation is roughly 50 percent higher than they would likely receive in the private sector. The study found that the most generous benefits that teachers receive are not accounted for in many studies of compensation including: pension, retiree health benefits and job security.[202]
In 2012, the average teacher salary in Newport School District was $51,837 a year, while the cost of the benefits teachers received was $18,966 per employee, for a total annual average teacher compensation of $70,803.[203] The District employed 134 teachers with a top salary of $100,495.[204]
In 2011, the average teacher salary in Newport School District was $52,105.85 a year, while the cost of the benefits teachers receive was $16,904 per employee, for a total annual average teacher compensation of $69,010.[205] The District employed 103 teachers with a top salary of $100,495 in 2012. According to a study conducted at the American Enterprise Institute, in 2011, public school teachers’ total compensation is roughly 50 percent higher than they would likely receive in the private sector. The study found that the most generous benefits that teachers receive are not accounted for in many studies of compensation, including: pension, retiree health benefits and job security.[206][207]
In 2009, the Newport School District reported employing 118 teachers and administrators with a median salary of $52,664 and a top salary of $90,476.[208]
In 2007, the Newport School District employed 96 teachers who earned an average teacher salary of $47,811 for 180 days worked.[209] As of 2007, Pennsylvania ranked in the top 10 states in average teacher salaries. When adjusted for cost of living Pennsylvania ranked fourth in the nation for teacher compensation.[210] Additionally, the teachers receive a defined benefit pension, health insurance, professional development reimbursement, personal days, 10 paid sick days which accumulate, and other benefits.[211] According to the Pennsylvania Department of Education, 165 students received free or reduced-price lunches due to low family income in the 2007-2008 school year.[212]
Administration costs The Newport School District administrative costs per pupil were $784 in 2008. The lowest administrative cost per pupil in Pennsylvania was $398 per pupil.[213] At the December 16, 2009 meeting the school board eliminated the following administration positions effective July 1, 2010: Director of Curriculum, Instruction and Assessment, Director of Building and Grounds, Middle School Principal.[214]
Per pupil spending In 2008, the Newport School District spent $12,622 per pupil which ranked 207th out of Pennsylvania's 500 school districts.[215] In 2010, the per pupil spending had increased to $18,037.70 which ranked 39th in Pennsylvania.[216] Among the fifty states, Pennsylvania’s total per pupil revenue (including all sources) ranked 11th at $15,023 per student, in 2008-09.[217] In 2007, the Pennsylvania per pupil total expenditures was $12,759.[218] The U.S. Census Bureau reports that Pennsylvania spent $8,191 per pupil in school year 2000-01.[219]
- Reserves
in 2012, Newport School District reported $3,740,894 in reserves with $1,857,721 in its unreserved account. In 2010, the District reported $1,239,563.00 in an unreserved-designated fund balance. The undesignated fund balance was reported as zero.[220] In 2009, the District reported $117,100 in its unreserved-undesignated fund balance. The designated fund balance was reported as zero.[221] Pennsylvania public school district reserve funds are divided into two categories – designated and undesignated. The undesignated funds are not committed to any planned project. Designated funds and any other funds, such as capital reserves, are allocated to specific projects. School districts are required by state law to keep 5 percent of their annual spending in the undesignated reserve funds to preserve bond ratings. According to the Pennsylvania Department of Education, from 2003 to 2010, as a whole, Pennsylvania school districts amassed nearly $3 billion in reserved funds.[222] By 2013, reserves held by Pennsylvania public school districts, as a whole, had increased to over $3.8 billion.[223] In 2014, Newport School Board reported having $4,342,978 in reserves.[224]
Newport School District's annual budget was $16 million (2009–2010). In mid-2009, it was revealed that the District had a $1.1 million shortfall. The Board projected a $1.2 million deficit by the end of the 2009-10 school year.
For the 2010-11 school year, Newport School Board projected a substantial property tax increase to fund a $16.1 million budget. This meant a property tax increase of nearly $300 for the average property owner. The school board sought multiple Act 1 Index exceptions to permit this tax increase.[225] In March 2010, the board chose to eliminate 14 teaching positions.[226] The elementary school had 50 teachers during the 2009 - 2010 school year. The cuts will save the district $552,000. They include eliminating the non mandatory preschool program, a music teacher and the elective Discovery Program. The cuts are effective for the 2010-2011 school year.
- Superintendent Buyout
Dr. Kerry W. Helm, Superintendent since 2006, resigned in December 2009, under board pressure due to taxpayer anger over the financial mismanagement. He negotiated a severance package that included: cash payments of $100,000 in two installments: $80,000 to be paid in January and $20,000 to be paid by Oct. 1, 2010. The district also agreed to make $981.63 in COBRA health insurance payments through June 2010. Helm had recently signed a new three-year contract in February 2009. Per that contract, the district would have needed to spend in excess $258,000 to buy him out of the $99,302 annual superintendent position.[227]
Audit In January 2009, the Pennsylvania Auditor General conducted a performance audit of the district. Findings were reported to the administration and school board.[228] The District was audited again in April 2013 and findings were once again reported to the school board.
Tuition Students who live in the Newport School District's attendance area may choose to attend one of Pennsylvania's 157 public charter schools. A student living in a neighboring public school district or a foreign exchange student may seek admission to Newport School District. For these cases, the Pennsylvania Department of Education sets an annual tuition rate for each school district. It is the amount the public school district pays to a charter school for each resident student that attends the charter and it is the amount a nonresident student's parents must pay to attend the Newport School District's schools. The 2012 tuition rates are Elementary School -$8,029.56, Junior Senior High School - $7,705.36.[229]
Newport School District is funded by a combination of: a local earned income tax 1.1%, a property tax, a real estate transfer tax 0.5%, per capita taxes $5, coupled with substantial funding from the Commonwealth of Pennsylvania and the federal government. Grants provide an opportunity to supplement school funding without raising local taxes. In the Commonwealth of Pennsylvania, pension and Social Security income are exempted from state personal income tax and local earned income tax regardless of the individual's wealth.[230] According to the Pennsylvania State Education Association, the average Pennsylvania public school teacher pension in 2011 exceeds $60,000 a year, plus they receive federal Social Security benefits: both are free of Pennsylvania state income tax and local income tax which funds local public schools.[231]
State basic education funding
According to a report from Representative Todd Stephens office, Newport School District receives 50.7% of its annual revenue from the state.[232]
In December 2014, the Pennsylvania Education Funding Reform Commission conducted a hearing.[233][234] The commission developed a new basic education funding formula which sets a new way to distribute state basic education dollars. It abolished the practice of "hold harmless" funding, which gave districts at least the same as they got the previous school year regardless of declining enrollment. The plan became law in June 2016 (House Bill 1552).[235][236][237]
For the 2017-18 school year, Newport School District received $5,864,313 in Basic Education Funding from the Commonwealth of Pennsylvania. Pennsylvania again increased its public education spending to a record high of $5.995 billion. It was a $100 million increase, 1.7% increase over the 2016-17 state appropriation.[238] Additionally, the state continued to fund its Ready to Learn grants at $250 million and Special Education funding received a $25 million increase to $1,121 billion.[239] The state also paid $529.5 million to the school employee social security fund and another $2.304 billion to the teacher’s pension fund, an increase of 7.6% over the state’s 2016-17 payment. The state maintained its $100 million reimbursement to school districts for transportation costs. Governor Wolf had proposed cutting the funding by 50% shifting the costs to local taxpayers.[240][241]
For the 2016-17 school year, Newport School District received $3,467,058 in Basic Education Funding from the Commonwealth of Pennsylvania. This is a 2.2% increase over 2015-16 funding to the District. This was the highest percentage of BEF increase in Perry County under the state’s Basic Education Funding formula. For the 2016-17 school year, Pennsylvania increased its public education spending to a record high of $5,895 billion. It was a $200 million increase, 3.51% increase over the 2015-16 appropriation.[242] The state also funded Ready to Learn grants at $250 million and Special Education funding received a $20 million increase.[243] The state also paid $492 million to the school employee social security fund and another $2.064 billion to the teacher’s pension fund.[244] Statewide Conestoga Valley School District received a 13.3% increase in state BEF funding. Five PA public school districts received an increase of 10% or greater in Basic Education funding over their 2015-16 funding.
For the 2015-16 school year, Governor Tom Wolf released a partial Basic Education Funding of $2,723,187 to Newport School District, in January 2016.[245] This was part of $10.3 billion in school funding withheld from the public schools, by the Governor since the summer of 2015.[246] The dispersement did not follow the new Basic Education Fair Funding formula which had been established by the Pennsylvania General Assembly in June 2015.[247]
In compliance with a legislative mandate that was passed with veto proof majorities in the PA House and Senate,[248] the final BEF funding was determined for 2015-16, in April 2016. Newport School District received $5,721,027 in Basic Education Funds for the 2015-16 school year. This was a 1.4% increase yielding a $80,813 increase over the previous school year funding. The District also received another $178,587 in Ready to Learn funding from the state.[249]
For the 2014-15 school year, Newport School District will receive $5,622,899 in State Basic Education funding. The District will also receive $158,269 in new Ready To Learn Block grant. The State’s enacted Education Budget includes $5,526,129,000 for the 2014-2015 Basic Education Funding.[250] The Education budget also includes Accountability Block Grant funding at $100 million and $241 million in new Ready to Learn funding for public schools that focus on student achievement and academic success. The State is paying $500.8 million to Social Security on the school employees behalf and another $1.16 billion to the state teachers pension system (PSERS). In total, Pennsylvania’s Education budget for K-12 public schools is $10 billion. This was a $305 million increase over 2013-2014 state spending and the greatest amount ever allotted by the Commonwealth for its public schools.[251]
For the 2013-14 school year, the Newport School District will receive a 1.5% increase or $5,624,780 in Pennsylvania Basic Education Funding. This is $82,161 more than its 2012-13 state BEF to the District. Additionally, Newport School District will receive $81,880 in Accountability Block Grant funding to focus on academic achievement and level funding for special education services. Among the public school districts in Perry County, West Perry School District received the highest percentage increase at 2.1%. The District has the option of applying for several other state and federal grants to increase revenues. The Commonwealth’s budget increased Basic Education Funding statewide by $123 million to over $5.5 billion. Most of Pennsylvania’s 500 public school districts received an increase of Basic Education Funding in a range of 0.9% to 4%. Eight public school districts received exceptionally high funding increases of 10% to 16%. The highest increase in state funding was awarded to Austin Area School District which received a 22.5% increase in Basic Education Funding.[252] The state funded the PSERS (Pennsylvania school employee pension fund) with $1,017,000,000 and Social Security payments for school employees of $495 million.[253]
For the 2012-13 school year, Newport School District received $5,624,499 in State Basic Education funding.[254] The Governor's Executive Budget for 2012-2013 includes $9.34 billion for kindergarten through 12th grade public education, including $5.4 billion in basic education funding, which is an increase of $49 million over the 2011-12 budget. The state also provides $100 million for the Accountability Block grant. Newport School District received $81,880 in ABG funds. The state also provided $544.4 million for School Employees’ Social Security and $856 million for School Employees’ Retirement fund called PSERS.[255] This amount is a $21,823,000 increase (0.34%) over the 2011-2012 appropriations for Basic Education Funding, School Employees' Social Security, Pupil Transportation, Nonpublic and Charter School Pupil Transportation. Since taking office, Corbett’s first two budgets have restored more than $918 million in support of public schools, compensating for the $1 billion in federal stimulus dollars lost at the end of the 2010-11 school year.
In 2011-12 school year, Newport School District received $5,542,619 in state Basic Education Funding.[256] Additionally, Newport School District received $81,880 in Accountability Block Grant funding. According to the Pennsylvania Department of Education, 480 students received free or reduced-price lunches due to low family income in the 2010–11 school year.[257]
For the 2010-11 school year, Newport School District received a 2% increase in state Basic Education Funding (BEF) resulting in a $5,883,294 payment.[258] West Perry School District received a 5.14% increase, which was the highest increase in BEF in Perry County. Kennett Consolidated School District in Chester County received the highest increase in the state at 23.65% increase in funding for the 2010-11 school year. One hundred fifty school districts received the base 2% increase in 2010-11. Fifteen (15) Pennsylvania public school districts received a BEF increase of greater than 10%. The state's hold harmless policy regarding state basic education funding continued where each district received at least the same amount as it received the prior school year, even when enrollment had significantly declined. The amount of increase each school district received was determined by then Governor Edward G. Rendell and then Pennsylvania Secretary of Education, Gerald Zahorchak through the allocation set in the state budget proposal made in February each year.[259] This was the second year of Governor Rendell's plan for the state to fund some school districts at a much higher rate than others.
In the 2009-10 budget year, the Commonwealth of Pennsylvania provided a 4.07% increase in Basic Education Funding to Newport School District, for a total of $5,767,935. Newport School District received the lowest increase in funding from the state, among all the public school districts in Perry County. The district also received supplemental funding for: Title I (federal funding for low-income students), for district size, a poverty supplement from the Commonwealth and more. Among Perry County public school districts, the highest state funding increase was 6.39% to Susquenita School District.[260] The state's hold harmless policy regarding state basic education funding continued where each district received at least the same amount as it received the prior school year, even when enrollment had significantly declined. Seventy school districts received the minimum 2% increase in 2009. The Muhlenberg School District of Berks County received a 22.31% increase in state funding in 2009. Individual district basic education funding increase was determined by then Governor Edward Rendell and the Secretary of Education Gerald Zahorchak in the annual budget process.
The state Basic Education funding to the Newport School District in 2008-09 was $5,542,619.13. Newport School District received $5,542,619.13 in state BEF funding in 2007-08. According to the Pennsylvania Department of Education, 403 students received free or reduced-price lunches due to low family income in the 2007-2008 school year.[261]
Accountability Block Grants
Beginning in 2004-2005, the state launched the Accountability Block Grant school funding. This program has provided $1.5 billion to Pennsylvania’s school districts. The Accountability Block Grant program requires that its taxpayer dollars are focused on specific interventions that are most likely to increase student academic achievement. These interventions include: teacher training, all-day kindergarten, lower class size K-3rd grade, literacy and math coaching programs that provide teachers with individualized job-embedded professional development to improve their instruction, before or after school tutoring assistance to struggling students. For 2010-11, Newport School District applied for and received $222,242 in addition to all other state and federal funding. The District used the funding to provide full-day kindergarten for the 7th year.[262][263]
Ready to Learn grant
Beginning in the 2014-2015 budget, the State funded a new Ready to Learn Grant for public schools. A total of $100 million is allocated through a formula to districts based on the number of students, level of poverty of community as calculated by its market value/personal income aid ratio (MV/PI AR) and the number of English language learners. Ready to Learn Block Grant funds may be used by the Districts for: school safety; Ready by 3 early childhood intervention programs; individualized learning programs; and science, technology, engineering and math (STEM) programs.[264]
Newport School District will receive $158,269 in Ready to Learn Grant dollars in addition to State Basic Education funding, Special Education funding, Accountability Block Grant funding, PreK Counts funding, reimbursement for Social Security payments for employees and other state grants which the district must apply to receive.
Classrooms for the Future grant
The Classroom for the Future state program provided districts with hundreds of thousands of extra state funding to buy laptop computers for each core curriculum high school class (English, Science, History, Math), along with other specialized equipment and provided funding for teacher training to optimize the use of the computers. The program was funded from 2006 to 2009. Newport School District was not approved for funding in 2006-07. The Newport School District received $152,561 in 2007-08 and was given $45,413 for the 2008-09 school year.[265] Among the public school districts in Perry County, West Perry School District received the highest grant $361,599.
Education Assistance grant
While many students qualified, Newport School Administration did not apply for the state's Education Assistance Grant. The state's EAP funding provides for the continuing support of tutoring services and other programs to address the academic needs of eligible students. Funds are available to eligible school districts and full-time career and technology centers (CTC) in which one or more schools have failed to meet at least one academic performance target, as provided for in Section 1512-C of the Pennsylvania Public School Code.[266][267]
PreK Counts grant
Newport School District receives state funding to provide preschool to resident children. For the 2011 school year, Pre-K Counts was funded at the 2010 levels of $83.6 million statewide in Gov. Tom Corbett's proposed budget,. The state also supplements the federal Head Start preschool program with an additional $37.6 million. Pre-K Counts funding was initiated during the Rendell administration. In 2007-08 the state funded Pre-K Counts at $75 million. In 2009, 2010 and 2011, Newport School District received $59,250 to provide preschool to 15 children.[268][269]
Other grants
The District did not participate in: Science Its Elementary grants (discontinued effective with 2009-10 budget by Governor Rendell),[270] Pennsylvania Department of Environmental Protection's Environmental Education annual grants,[271][272] nor the 2012 and 2013 Striving Readers Comprehensive Literacy grant.[273] Newport School District also has not participated in 2012 and 2013 state Pennsylvania Hybrid Learning Grants.[274]
Common Cents state initiative
The school board elected to not participate in the Pennsylvania Department of Education Common Cents program. The program called for the state to audit the district, at no cost to local taxpayers, to identify ways the district could save tax dollars.[275] After the review of the information, the district was not required to implement the recommended cost savings changes.
Federal grant funding
Newport School District received $1,084,472 in ARRA - Federal Stimulus money to be used in specific programs like special education and meeting the academic needs of low-income students.[276]
School Improvement Grant
U.S. Education Secretary Arne Duncan announced in March 2012, that the first-year data suggest student achievement is improving at campuses that participated in the School Improvement grant program. He reported that at nearly 60 percent of SIG schools, more students are demonstrating proficiency in reading and math. Nearly a quarter of those schools reported math improvement in the double digits, and close to 20 percent of schools saw double-digit gains in reading.[277]
In 2012, the Newport High School was eligible for School Improvement grant funding due to ongoing low student achievement. In the summer of 2011, the district administration did not apply for School Improvement Grant funding, from the federal government (over $9.9 million available). Both Newport High School and Newport Middle School were eligible for funding. The grant stipulates the funds be used for improving student achievement using one of four federally dictated strategies. The strategies are: transformation, turnaround, restart with new faculty and administration or closure of failing schools. Transformation calls for a change in faculty and administration evaluations, mandated training in proven teaching techniques and rigorous curriculum change that focuses on student achievement. The Pennsylvania Education Secretary awarded $66 Million to reform Pennsylvania's lowest-achieving schools[278]
For 2010-11, Newport School District did not apply for a School Improvement Grant. It was eligible for funding due to the chronic, low achievement at the high school and middle school.[279]
In 2010, Pennsylvania received $141 million from the federal department of education, to turn around its worst-performing schools. The funds were disbursed via a competitive grant program.[280] The Pennsylvania Department of Education has identified 200 Pennsylvania schools as "persistently lowest-achieving," making them eligible for this special funding.[281] Pennsylvania required low performing schools to apply or provide documentation about why they had not applied. The funds must be used, by the district, to turn around schools in one of four ways: school closure, restart - close the school and reopen it as a charter school. The other two options involve firing the principal. One would require at least half the faculty in a chronically poor performing school be dismissed. The second involves intensive teacher training coupled with strong curriculum revision or a longer school day.[282]
Race to the Top grant
Newport School district officials did not apply for the Race to the Top federal grant which would have brought the district hundreds of thousands in additional federal dollars for committing to improve student academic achievement.[283] Participation required the administration, the school board and the local teachers' union to sign an agreement to prioritize improving student academic success. In Pennsylvania, 120 public school districts and 56 charter schools agreed to participate. Pennsylvania was not approved for the grant. The failure of districts to agree to participate was cited as one reason that Pennsylvania was not approved.[284]
The district employs three full-time technology personnel who service four fully equipped computer labs at the high school, two at the elementary school and five mobile wireless labs (Classrooms for the Future). In addition every classroom has at least one computer and many are equipped with Smartboards. The middle/high school library operates a mobile wireless lab of laptops for student use. Wireless internet access is available throughout the district. Both buildings in the district are monitored by digital surveillance equipment.
Title II grants
The Federal government provides annual grants to schools to be used to improve the quality of teacher instructions to pupils. The goal is to provide each child in public schools with “High Quality” teachers and principals as defined by the state.[285] The funds are sent to the state Department of Education which distributes them to each school district and charter school.[286] Beginning in 2002, the federal funding committed to Title II was $3,175,000,000.
Public school district administrations must apply to the state annually for the Title II funds. In 2012-13, Newport School District received $76,319 in federal Title II funding.[287] In 2014-15, Newport School District applied for and received $72,825.[288]
English language learners grant
The Federal government provides annual grants to schools to assist in educating immigrant children and children who are identified as limited English proficient.[289] Upon registering for school a language survey is done for all new enrollment pupils, typically in kindergarten or preschool. They identify the primary language spoken at home. This data is collected and submitted to the Pennsylvania Department of Education, which in turn notifies the federal government.[290][291]
In 2012-13 - Newport School District received $815 in Title III funding for English language learners.[292] For 2014-15, Newport School District received no Title III funding.[293]
Real estate taxes
The Newport School Board property tax rates for school year 2016-17 were raised by the school board to 14.1831 mills.[294] A mill is $1 of tax for every $1,000 of a property's assessed value. Property taxes, in the Commonwealth of Pennsylvania, apply only to real estate - land and buildings. The property tax is not levied on cars, business inventory, or other personal property. Certain types of property are exempt from property taxes, including: places of worship, places of burial, private social clubs, nonprofit hospitals, charitable and educational institutions and all government property (local, state and federal). Additionally, service related, disabled US military veterans may seek an exemption from paying property taxes. Unlike other states, under Pennsylvania state tax policy, natural gas and oil pipelines are exempted from property taxes.[295]
Irregular property reassessments have become a serious issue in the commonwealth as it creates a significant disparity in taxation within a community and across a region. Pennsylvania school district revenues are dominated by two main sources: 1) Property tax collections, which account for the vast majority (between 75-85%) of local revenues; and 2) Act 511 tax collections (Local Tax Enabling Act), which are around 15% of revenues for school districts.[296]
|
|
The average yearly property tax paid by Perry County residents amounts to about 3.11% of their yearly income. Perry County ranked 539th of the 3143 United States counties for property taxes as a percentage of median income.[308] According to a report prepared by the Pennsylvania Department of Education, the total real estate taxes collected by all school districts in Pennsylvania rose from $6,474,133,936 in 1999-00 to $10,438,463,356 in 2008-09 and to $11,153,412,490 in 2011.[309] Property taxes in Pennsylvania are relatively high on a national scale. According to the Tax Foundation, Pennsylvania ranked 11th in the U.S. in 2008 in terms of property taxes paid as a percentage of home value (1.34%) and 12th in the country in terms of property taxes as a percentage of income (3.55%).[310]
Act 1 Adjusted index
The Act 1 of 2006 Index regulates the rates at which each school district can raise property taxes in Pennsylvania. Districts are not authorized to raise taxes above that index unless they allow voters to vote by referendum, or they seek an exception from the state Department of Education. The base index for the 2011-2012 school year is 1.4 percent, but the Act 1 Index can be adjusted higher, depending on a number of factors, such as property values and the personal income of district residents. Act 1 included 10 exceptions, including: increasing pension costs, increases in special education costs, a catastrophe like a fire or flood, increase in health insurance costs for contracts in effect in 2006 or dwindling tax bases. The base index is the average of the percentage increase in the statewide average weekly wage, as determined by the PA Department of Labor and Industry, for the preceding calendar year and the percentage increase in the Employment Cost Index for Elementary and Secondary Schools, as determined by the Bureau of Labor Statistics in the U.S. Department of Labor, for the previous 12-month period ending June 30. For a school district with a market value/personal income aid ratio (MV/PI AR) greater than 0.4000, its index equals the base index multiplied by the sum of .75 and its MV/PI AR for the current year.[311] In June 2011, the Pennsylvania General Assembly eliminated six of the ten the exceptions to the Act 1 Index.[312] The following exceptions were maintained: 1) costs to pay interest and principal on indebtedness incurred prior to September 4, 2004 for Act 72 schools and prior to June 27, 2006 for non-Act 72 schools; 2) costs to pay interest and principal on electoral debt; 3) costs incurred in providing special education programs and services (beyond what is already paid by the State); and 4) costs due to increases of more than the Index in the school’s share of payments to PSERS (PA school employee pension fund) taking into account the PSERS contribution rate.[313][314]
The School District Adjusted Index for the Newport School District 2006-2007 through 2010-2011.[315]
|
|
For the 2016-17 budget year, Newport School Board did not apply for any exceptions to exceed the District's Act 1 Index limit.[325] Statewide 299 school districts adopted a resolution to not exceed their Act I index in 2016-17. In 2016-17, all Pennsylvania public school districts were required to make a 30.03% of payroll payment to the teacher’s pension fund (PSERS).[326] This was in addition to the 6.02% social security employer match payment.[327]
For the 2015-16 budget year, Newport School Board did not apply for any exceptions to exceed their Act 1 Index limit. For the school budget 2015-16, 310 Pennsylvania public school districts adopted a resolution certifying that tax rates would not be increased above its Act 1 Index limit. Another 187 school districts adopted a preliminary budget leaving open the option of exceeding the Index limit. Regarding the pension costs exception, 172 school districts received approval to exceed the Index limit in full, while others received a partial approval of their request. For special education costs, 119 districts received approval to exceed their tax limit. No Pennsylvania public school districts received an approval for the grandfathered construction debts exception.[328]
For the 2014-15 budget year, Newport School Board applied for an exception to exceed their Act 1 Index limit due to the rapidly escalating cost of the teachers' pensions. In 2014-15, all Pennsylvania school districts were required to make a 21.4% of payroll payment to the teacher’s pension fund (PSERS).[329] For 2014-15, Newport School District will pay $831,549 for teacher pensions and $268,715 to the Social Security system. For the school budget 2014-15, 316 Pennsylvania public school districts adopted a resolution certifying that tax rates would not be increased above its Act 1 Index limit. Another 181 school districts adopted a preliminary budget leaving open the option of exceeding the Index limit. Districts may apply for multiple exceptions each year. For the pension costs exception, 163 school districts received approval to exceed the Index in full, while others received a partial approval of their request. For special education costs, 104 districts received approval to exceed their tax limit. Seven Pennsylvania public school districts received an approval for the grandfathered construction debts exception.[330]
For the 2013-14 budget year, Newport School Board applied for all three exceptions to exceed their Act 1 Index limit: teacher's pensions cost, special education costs and Grandfather Construction debt. For the school budget year 2013-14, 311 Pennsylvania public school districts adopted a resolution certifying that tax rates would not be increased above their index. Another 171 school districts adopted a preliminary budget leaving open the option of exceeded the Index limit. For the exception for pension costs, 89 school districts received approval to exceed the Index in full while others received a partial approval of their request. For special education costs, 75 districts received approval to exceed their tax limit. For the pension costs exception, 169 school districts received approval to exceed the Index. Eleven Pennsylvania public school districts received an approval for grandfathered construction debts.[331]
For the 2012-13 budget year, Newport School Board did not apply for exceptions to exceed the Act 1 Index. For 2012-2013, 274 school districts adopted a resolution certifying that tax rates would not be increased above their index; 223 school districts adopted a preliminary budget leaving open the option of exceeded the Index limit. For the exception for pension costs, 194 school districts received approval to exceed the Index. For special education costs, 129 districts received approval to exceed the tax limit.[332]
For the 2011-12 school year, Newport School Board applied for an exception to exceed the Act 1 Index: School Construction Grandfathered Debt. Each school budget year, the Newport School Board has the option of adopting either: 1) a resolution in January certifying they will not increase taxes above their index or 2) a preliminary budget in February. A school district adopting the resolution may not apply for referendum exceptions or ask voters for a tax increase above the inflation index. A specific timeline for these decisions is published annually, by the Pennsylvania Department of Education.[333]
According to a state report, for the 2011-2012 school year budgets, 247 school districts adopted a resolution certifying that tax rates would not be increased above their index; 250 school districts adopted a preliminary budget. Of the 250 school districts that adopted a preliminary budget, 231 adopted real estate tax rates that exceeded their index. Tax rate increases in the other 19 school districts that adopted a preliminary budget did not exceed the school district’s index. Of the districts who sought exceptions: 221 used the pension costs exemption and 171 sought a Special Education costs exemption. Only 1 school district sought an exemption for Nonacademic School Construction Project, while 1 sought an exception for Electoral debt for school construction.[334]
For the 2011-12 school year, the Newport School Board applied for an exception to exceed the Act 1 Index - School Construction Grandfathered Debt. Each year, the Newport School Board has the option of adopting either 1) a resolution in January certifying they will not increase taxes above their index or 2) a preliminary budget in February. A school district adopting the resolution may not apply for referendum exceptions or ask voters for a tax increase above the inflation index. A specific timeline for these decisions is published annually, by the Pennsylvania Department of Education.[335]
According to a state report, for the 2011-2012 school year budgets, 247 school districts adopted a resolution certifying that tax rates would not be increased above their index; 250 school districts adopted a preliminary budget. Of the 250 school districts that adopted a preliminary budget, 231 adopted real estate tax rates that exceeded their index. Tax rate increases in the other 19 school districts that adopted a preliminary budget did not exceed the school district’s index. Of the districts who sought exceptions: 221 used the pension costs exemption and 171 sought a Special Education costs exemption. Only 1 school district sought an exemption for Nonacademic School Construction Project, while 1 sought an exception for Electoral debt for school construction.[336]
For 2010-11, Newport School Board applied for multiple exceptions to exceed the Act 1 index for the budgets, including Maintenance of revenues and rising teacher pension costs.[337] In the Spring of 2010, 135 Pennsylvania school boards asked to exceed their adjusted index. Approval was granted to 133 of them and 128 sought an exception for pension costs increases.[338] For 2009-10 school budget, the board did not apply for exceptions to exceed the Index.[339]
Property tax relief
In 2013, Newport School District 2,177 approved homestead properties received $194.[340] The amount received by the District must be divided equally among all approved residences.[341] In 2012, the Homestead/Farmstead Property Tax Relief from gambling, for the Newport School District, was $193 per approved permanent primary residence. The amount of property tax relief each school district receives is announced by the PDE in May each year. It is dependent on the amount of tax revenue collected on the casino slots in the previous year.
In 2010, the tax relief was $194. In Newport School District, 2129 property owners applied for the tax relief.[342] In 2009, the District's property tax relief was set at $194 for 2,174 approved homesteads. This was the highest tax relief to homestead owners residing in Perry County in 2010. The relief was subtracted from the total annual school property tax bill. Property owners apply for the relief through the county Treasurer's office. Farmers can qualify for a farmstead exemption on building used for agricultural purposes. The farm must be at least 10 acres (40,000 m2) contiguous and must be the primary residence of the owner. Farmers can qualify for both the homestead exemption and the farmstead exemption. The highest property tax relief in Pennsylvania was given to residents in Chester Upland School District in Delaware County, at $632 in 2009 and 2010.[343] In Perry County, 88.04% of eligible property owners applied for property tax relief in 2009. This was among the highest participation rates in Pennsylvania.[344]
Additionally, the Pennsylvania Property Tax/Rent Rebate program is provided for low income Pennsylvanians aged 65 and older; widows and widowers aged 50 and older; and people with disabilities age 18 and older. The income limit is $35,000 for homeowners. The maximum rebate for both homeowners and renters is $650. Applicants can exclude one-half (1/2) of their Social Security income, so people who make substantially more than $35,000 may still qualify for a rebate. Individuals must apply annually for the rebate. This tax rebate can be taken in addition to Homestead/Farmstead Gambling Property Tax Relief. In 2012, the Pennsylvania Secretary of the Treasury reported issuing more than half a million property tax rebates totaling $238 million.[345] The Property tax/rent rebate program is funded by revenues from the Pennsylvania Lottery. In 2012, these property tax rebates were increased by an additional 50 percent for senior households in the state, so long as those households have incomes under $30,000 and pay more than 15% of their income in property taxes.[346]
Enrollment
In 2012, Newport School District enrollment declined to 1,175 preschool plus K-12. According to the Pennsylvania Department of Education, there are fewer than 1200 students enrolled in the District in K-12. There were 97 students in the Class of 2009. The senior class of 2010 has 68 students. Enrollment in Newport School District is projected to continue to remain below 1150 through 2019. With limited local taxation resources, opportunities for students are limited. Consolidation of the administrations with adjacent school districts would achieve substantial administrative cost savings for people in each community. These excessive administrative overhead dollars could be redirected to improve lagging mathematics and science achievement, to enrich the academic programs or to substantially reduce property taxes. Consolidation of the central administrations would not require the closing of any schools.[347] A new district composed of Greenwood School District and Newport School District would have a student population of 2000 with stable enrollment projected for the next two decades. Newport School District has an athletic partnership with the Greenwood High School for football, track, soccer, and wrestling.
Pennsylvania has one of the highest numbers of school districts in the nation. The District is one of the 500 public school districts of Pennsylvania in 2013. In Pennsylvania, 80% of the school districts serve student populations under 5,000, and 40% serve less than 2,000. This results in excessive school administration bureaucracy and not enough course diversity.[348] In a survey of 88 superintendents of small districts, 42% of the 49 respondents stated that they thought consolidation would save money without closing any schools.[349] Less than 95 of Pennsylvania's 501 school districts have enrollment below 1250 students, in 2007.[350]
Over the next 10 years, rural Pennsylvania school enrollment is projected to decrease 8 percent per a report by the Center for Rural Pennsylvania.[351]
Renovations
The middle/high school recently underwent a $25 million renovation and additions project which is LEED Silver certified. The HVAC system has been converted to using geo-thermal energy to help reduce dependence on foreign oil as well as save money. A six thousand gallon cistern collects gray water to operate toilet facilities on all three floors of the building. The building features 21st century classrooms wired for technology, an 8,000-square-foot (740 m2) auxiliary gymnasium and a new 10,000-square-foot (930 m2) main gymnasium which seats approximately 1,500, a state of the art auditorium which seats 800, and state of the art technology education, agricultural education, and technology labs. The building is fully accessible to handicapped students and patrons.
Wellness policy
Newport School Board established a district-wide Wellness Policy in 2006.[352] The policy deals with nutritious meals served at school, the control of access to some foods and beverages during school hours, age appropriate nutrition education for all students, and physical education for students K-12. The policy is in response to state mandates and federal legislation (P.L. 108 – 265). The law dictates that each school district participating in a program authorized by the Richard B. Russell National School Lunch Act (42 U.S.C. 1751 et seq) or the Child Nutrition Act of 1966 (42 U.S.C. 1771 et seq) "shall establish a local school wellness policy by School Year 2006." Most districts identified the superintendent and school foodservice director as responsible for ensuring local wellness policy implementation.[353]
The legislation placed the responsibility of developing a wellness policy at the local level so the individual needs of each district can be addressed. According to the requirements for the Local Wellness Policy, school districts must set goals for nutrition education, physical activity, campus food provision, and other school-based activities designed to promote student wellness. Additionally, districts were required to involve a broad group of individuals in policy development and to have a plan for measuring policy implementation. Districts were offered a choice of levels of implementation for limiting or prohibiting low nutrition foods on the school campus. In final implementation these regulations prohibit some foods and beverages on the school campus.[354] The Pennsylvania Department of Education required the district to submit a copy of the policy for approval.
The Newport School District offers both a free school breakfast and a free or reduced-price lunch to children in low income families. All students attending the school can eat breakfast and lunch. Children from families with incomes at or below 130 percent of the federal poverty level are provided a breakfast and lunch at no cost to the family. Children from families with incomes between 130 and 185 percent of the federal poverty level can be charged no more than 30 cents per breakfast. A foster child whose care and placement is the responsibility of the State or who is placed by a court with a caretaker household is eligible for both a free breakfast and a free lunch. Runaway, homeless and Migrant Youth are also automatically eligible for free meals.[355] The meals are partially funded with federal dollars through the United States Department of Agriculture.[356]
In 2013, the USDA issued new restrictions to foods in public schools. The rules apply to foods and beverages sold on all public school district campuses during the day. They limit vending machine snacks to a maximum of 200 calories per item. Additionally, all snack foods sold at school must meet competitive nutrient standards, meaning they must have fruits, vegetables, dairy or protein in them or contain at least 10 percent of the daily value of fiber, calcium, potassium, and Vitamin D.[357] In order to comply with the Healthy, Hunger-Free Kids Act of 2010 all US public school districts are required to raise the price of their school lunches to $2.60 regardless of the actual cost of providing the lunch.[358] In 2014, President Obama ordered a prohibition of advertisements for unhealthy foods on public school campuses during the school day.[359] The Food and Drug Administration requires that students take milk as their beverage at lunch. In accordance with this law, any student requesting water in place of milk with their lunch must present a written request, signed by a doctor, documenting the need for water instead of milk.[360]
Newport School District provides health services as mandated by the Commonwealth and the federal government. Nurses are available in each building to conduct annual health screenings (data reported to the PDE and state Department of Health) and to dispense prescribed medications to students during the school day.[361] Students can be excluded from school unless they comply with all the State Department of Health’s extensive immunization mandates. School nurses monitor each pupil for this compliance.[362][363] Nurses also monitor each child's weight.
In 2016, the Pennsylvania Department of Health made available to each Pennsylvania high school the overdose antidote drug naloxone in a nasal spray. School nurses were also provided with educational materials and training developed by the National Association of School Nurses.[364] The initial cost was covered by a grant from a private foundation.[365]
- eTools grant
The District participated in Highmark Foundation’s Healthy High 5 Health eTools for Schools grant which enabled mobile data collection of pertinent health and physical fitness screening data on students K-12 in a database held by InnerLink, Inc. in Lancaster, Pennsylvania.[366] Health eTools for Schools also provided interdisciplinary research-based curriculum in nutrition, physical education and physical activity to participating districts. The program was discontinued in 2013.[367]
Extracurriculars
Newport Schools offer a full range of extracurricular activities, including: band and orchestra, chorus, and a wide variety of clubs and organizations. Newport students have represented the district at all levels of competition in both academic and extracurricular pursuits. Eligibility for participation is determined by the school board.[368][369][370] The District reported spending $413,000 to provide extracurriculars in 2013-14.[371]
Newport School Board entered into a three-year contract with Central Pennsylvania Rehabilitation Services to provide an athletic trainer at practices and home games.[372] The contract is for 25 hours a week for 40 weeks at $18,500 a year. Coaches receive compensation as outlined in the teachers' union contract. When athletic competition exceeds the regular season, additional compensation is paid.[373]
The athletic stadium is named after George Katchmer who coached the school to its only undefeated season in 1953. There is a Buffalo pattern made from rocks displayed proudly behind the field. According to Pennsylvania’s Safety in Youth Sports Act, all sports coaches, paid and volunteer, are required to annually complete the Concussion Management Certification Training and present the certification before coaching.[374][375]
By Pennsylvania law, all K-12 students in the District, including those who attend a private nonpublic school, cyber charter school, charter school and those homeschooled, are eligible to participate in the extracurricular programs, including all athletics. They must meet the same eligibility rules as the students enrolled in the district's schools.[376][377][378]
Newport School District has an athletic partnership with Greenwood School District for football, track, soccer, and wrestling. Coaches receive compensation as outlined in the teachers' union contract. When athletic competition exceeds the regular season, additional compensation is paid.[379]
The District funds:
- Varsity
|
|
- Middle School Sports
|
|
According to PIAA directory July 2013 [380]
References
- ↑ Sean Sauro (March 29, 2014). "Neuhard named as new Newport superintendent". Perry County Times.
- ↑ PDE< ED Names and Addresses, 2017
- ↑ Sean Sauro, Newport School budget built without tax increase, Pennlive, June 7, 2014
- ↑ National Center of Education Statistics, Common Core of Data Newport School District, 2016
- ↑ National Center of Education Statistics, Common Core of Data Newport School District, 2012
- ↑ PDE (October 4, 2016). "Newport School District Fast Facts 2016".
- ↑ Pennsylvania Department of Education (December 6, 2015). "Newport School District Fast Facts 2015".
- ↑ Pennsylvania Department of Education (October 4, 2013). "Newport School District Fast Facts 2013".
- ↑ Pennsylvania Department of Education, Newport School District enrollment and projections report, July 2011
- ↑ PDE, Enrollment by LEA 2015-16, 2015
- ↑ Pennsylvania Department of Education, Enrollment and Projections for Newport School District, January 2009
- ↑ Newport School District Administration, Newport School District Budget 2015-16 Report, June 2015
- ↑ Newport School District Administration, Newport School District Budget 2014-15 Report, June 2014
- ↑ Newport School Board Secretary, Newport School Board meeting minutes June 2012, June 18, 2012
- ↑ proximityone (2014). "School District Comparative Analysis Profiles".
- ↑ Pennsylvania Budget and Policy Center, Education Facts Student Poverty Concentration by LEA, 2012
- ↑ Collin Deppen (January 2015). "How many children are homeless in your school district?" (PDF). Pennsylvania Department of Education.
- ↑ US Census Bureau, American Fact Finder, 2009
- ↑ US Census Bureau (2014). "Pennsylvania Median household income, 2006-2010 by County".
- ↑ US Census Bureau (2010). "American Fact Finder, State and County quick facts".
- ↑ US Census Bureau (September 2011). "Income, Poverty, and Health Insurance Coverage in the United States: 2010" (PDF).
- ↑ Jeff Guo (September 15, 2015). "Lower wages for whites, higher wages for immigrants, and inequality for all". Washington Post.
- ↑ PA Auditor General, Performance audit Newport School District, March 2016
- ↑ Pennsylvania Public School Code Governance 2010
- ↑ US Department of Education (2015). "Every Student Succeeds Act".
- ↑ Pennsylvania General Assembly (2012). "Act of Jul. 12, 2012, P.L. 1142, No. 141 Section 921-A".
- ↑ Pennsylvania General Assembly, Pennsylvania School Code, 2013
- ↑ Pennsylvania General Assembly, Pennsylvania School Code, 2013
- ↑ Pennsylvania General Assembly (2012). "Act of Jul. 12, 2012, P.L. 1142, No. 141".
- ↑ The Commonwealth Foundation for Public Policy Alternatives. "The Pennsylvania Project". Archived from the original on July 16, 2011. Retrieved May 20, 2010.
- ↑ Pittsburgh Business Times (April 12, 2016). "Chester County district leads statewide Honor Roll 2016".
- ↑ Pittsburgh Business Times (April 11, 2014). "What makes up a district's School Performance Profile score?".
- ↑ Pittsburgh Business Times (April 10, 2015). "Guide to Pennsylvania Schools Statewide School District Ranking 2015".
- ↑ Pittsburgh Business Times (April 11, 2014). "Guide to Pennsylvania Schools Statewide School District Ranking 2014".
- ↑ Pittsburgh Business Times, Guide to Western Pennsylvania Schools Statewide Honor Roll Rankings 2013, April 6, 2013
- ↑ Pittsburgh Business Times, Statewide Honor Roll Rankings 2012, April 4, 2012
- ↑ Pittsburgh Business Times, Statewide Honor Roll Rankings 2011, May 6, 2011
- ↑ Pittsburgh Business Times, Pennsylvania School District Rankings 2010, May 1, 2010
- ↑ Pittsburgh Business Times (May 23, 2007). "Three of top school districts in state hail from Allegheny County,".
- ↑ Pittsburgh Business Times (April 11, 2011). "Overachiever statewide ranking". Archived from the original on July 23, 2011.
- ↑ Pittsburgh Business Times (May 6, 2010). "Overachiever statewide ranking".
- ↑ Pennsylvania Senate Education Committee, Pennsylvania Bottom 5% Persistently Low Achieving Schools January 11, 2011, January 25, 2011
- ↑ The Morning Call, 2009 PSSA RESULTS Newport School District, 2009
- ↑ Pennsylvania Department of Education, Pennsylvania Public School District AYP History, 2011
- ↑ Pennsylvania Department of Education, Pennsylvania District AYP History 2003-2010, 2011
- ↑ PDE, Graduation rate by LEA, 2016
- ↑ Pennsylvania Department of Education (December 6, 2015). "Newport School District Performance Profile 2015".
- ↑ Pennsylvania Department of Education (November 6, 2014). "Newport School District Performance Profile 2014".
- ↑ Pennsylvania Department of Education (October 4, 2014). "Newport School District Performance Profile".
- ↑ Pennsylvania Department of Education (September 21, 2012). "Newport School District AYP Overview 2012". Archived from the original on July 14, 2014. Retrieved October 30, 2011.
- ↑ Pennsylvania Department of Education (2011). "Newport School District - School AYP Data Table". Archived from the original on 2014-07-14. Retrieved 2011-10-30.
- ↑ Pennsylvania Department of Education (March 15, 2011). "New 4-year Cohort Graduation Rate Calculation Now Being Implemented".
- ↑ Pennsylvania Department of Education, Newport High School Academic Achievement Report Card 2010, October 20, 2010
- ↑ Pennsylvania Department of Education. "Newport School District Academic Achievement Report Card 2009". Archived from the original on 2012-11-07. Retrieved 2017-09-10.
- ↑ Pennsylvania Partnerships for Children - High School Graduation rates report 2007
- ↑ Pennsylvania Department of Education (2006). "Newport School District Academic Achievement Report card 2006".
- ↑ Pennsylvania Department of Education (November 14, 2016). "Newport High School Fast Facts 2016".
- ↑ US News and World Report, Best High Schools, 2016
- ↑ Pennsylvania Department of Education (2015). "Highly Qualified Teacher Guidelines". Archived from the original on 2016-06-24.
- ↑ US News and World Report, Best High Schools, 2013
- ↑ National Center for Education Statistics, Common Core of Data - Newport High School, 2010
- ↑ Pennsylvania Department of Education (September 29, 2016). "2016 PSSA AND KEYSTONE Results".
- ↑ Pennsylvania Department of Education (August 2016). "Findings and Recommendations Pursuant to Act 1 of 2016" (PDF).
- ↑ Jan Murphy (October 16, 2016). "How District schools fared overall".
- ↑ Pennsylvania Department of Education (November 4, 2015). "Newport High School School Performance Profile 2015".
- ↑ Jan Murphy (November 4, 2015). "Report card for state's high schools show overall decline". Pennlive.com.
- ↑ Pennsylvania Department of Education (November 4, 2015). "2015 Keystone Exam School Level Data".
- ↑ Pennsylvania Department of Education (November 6, 2014). "Newport High School Academic Performance Data 2014".
- ↑ Evamarie Socha (November 6, 2014). "Half of Valley districts see state test scores decline". The Daily Item.
- ↑ Eleanor Chute (November 21, 2014). "Pennsylvania student scores declined with reduced funding, test results show". Pittsburgh Post-Gazette.
- ↑ Pennsylvania Department of Education, Newport High School Academic Performance Data 2013, October 4, 2013
- ↑ Eleanor Chute & Mary Niederberger (December 11, 2013). "New assessment shows fuller picture of Pa. schools". Pittsburgh Post-Gazette.
- ↑ Pennsylvania Department of Education (January 11, 2011). "Persistently failing schools Pennsylvania Title I School Improvement List". Archived from the original on February 23, 2014. Retrieved September 10, 2017.
- ↑ Newport High School Administration (August 9, 2010). "Newport High School School Improvement Notification Letter". Archived from the original on July 14, 2014. Retrieved September 10, 2017.
- ↑ John Y. Baker & F. Joseph Merlino (November 2010). "PA Districts with the Greatest Gains and Losses on the 11th Grade PSSA Math and Science Test from 2004 to 2010". Archived from the original on 2011-07-24. Retrieved 2011-02-15.
- ↑ Newport School District Administration (February 10, 2011). "Newport School District Strategic Plan". Archived from the original on October 3, 2011. Retrieved April 15, 2011.
- ↑ Pennsylvania Department of Education (2014). "State Academic Standards".
- ↑ Pennsylvania Department of Education (2014). "State Assessment System".
- ↑ Pennsylvania Department of Education, Newport High School Report Card 2012, September 21, 2012
- ↑ Pennsylvania Department of Education (September 29, 2011). "2010-2011 PSSA and AYP Results".
- ↑ Pennsylvania Department of Education, Newport High School Report Card 2010, September 14, 2010
- ↑ Pittsburgh Post Gazette (October 15, 2012). "How is your school doing?".
- ↑ Pennsylvania Department of Education, Newport High School Academic Achievement Report Card 2010, August 2010
- ↑ Pennsylvania Department of Education, Newport School District Academic Achievement Report Card 2009, August 2009
- ↑ Pennsylvania Department of Education, Newport School District Academic Achievement Report Card 2007, 2007
- ↑ Pennsylvania Department of Education, Newport School District Academic Achievement Report Card 2006, August 2006
- ↑ Pennsylvania Department of Education (September 29, 2012). "2011-2012 AYP and PSSA Science Results".
- ↑ Pennsylvania Department of Education. "Science PSSA Results by school and grade 2008".
- ↑ The Pennsylvania Basic Education/Higher Education Science and Technology Partnership, Science in Motion annual report, 2012
- ↑ Pennsylvania College Remediation Report https://www.scribd.com/doc/23970364/Pennsylvania-College-Remediation-Report%5Bpermanent+dead+link%5D
- ↑ National Center for Education Statistics - IPEDS 2009
- ↑ Pennsylvania Department of Education (2016). "SAT and AP Scores 2016".
- ↑ College Board (2017). "SAT 2016 Total Group report Pennsylvania". Archived from the original on 2017-08-02.
- ↑ Scicchitano, Eric., SAT Split in Valley, The Daily Item, April 17, 2017
- ↑ College Board, Class of 2016 SAT Participation and Performance Data, 2017
- ↑ Pennsylvania Department of Education (2015). "SAT and AP Scores 2015".
- ↑ College Board, SAT 2015 Total Group report Pennsylvania, 2016
- ↑ PDE, School Performance profile, November 6, 2014
- ↑ Pennsylvania Department of Education (2014). "SAT and ACT Scores".
- ↑ College Board (2014). "2014 College-Bound Seniors State Profile Report" (PDF).
- ↑ College Board (2013). "The 2013 SAT Report on College & Career Readiness".
- ↑ Pennsylvania Department of Education (2011). "Public School SAT Scores 2011". Archived from the original on 2011-10-15.
- ↑ College Board (September 2011). "SAT Scores State By State - Pennsylvania".
- ↑ "While U.S. SAT scores dip across the board, N.J. test-takers hold steady". NJ.com. September 2011.
- ↑ The Center for Rural Pennsylvania (August 2006). "SAT Scores and Other School Data".
- ↑ "Archived copy". Archived from the original on 2014-10-17. Retrieved 2011-01-27. Pennsylvania Department of Education - Dual Enrollment Guidelines.
- ↑ Pennsylvania Transfer and Articulation Agreement. Site accessed March 2010. http://www.patrac.org/
- ↑ Newport School District Administration (February 10, 2011). "Newport School District Strategic Plan". Archived from the original on October 3, 2011. Retrieved April 15, 2011.
- ↑ Pennsylvania Department of Education (2010). "Keystone Exam Overview" (PDF).
- ↑ Megan Harris (September 12, 2013). "Pennsylvania changing high school graduation requirements". Tribune Live.
- ↑ Pennsylvania Department of Education (September 2011). "Pennsylvania Keystone Exams Overview". Archived from the original on 2012-03-17.
- ↑ Pennsylvania State Board of Education (2010). "Rules and Regulation Title 22 PA School Code CH. 4".
- ↑ Pennsylvania Department of Education, State Board of Education Finalizes Adoption of Pennsylvania Common Core State Academic Standards and High School Graduation Requirements, March 14, 2013
- ↑ Pennsylvania Department of Education (2011). "Keystone Exams".
- ↑ College Board (2017). "Exam Fees and Reductions: 2015".
- ↑ PDE, School Performance Profile - Academic Performance Data - Newport High School, December 2013
- ↑ PDE, AP Course report 2014, 2014
- ↑ PDE, AP Course report 2015, 2015
- ↑ PDE, AP Course report 2016, 2016
- ↑ Pennsylvania Department of Education (October 14, 2016). "Newport Middle School Fast Facts 2016".
- ↑ Pennsylvania Department of Education, Professional Qualifications of Teachers Newport Middle School, November 5, 2015
- ↑ Pennsylvania Department of Education (October 4, 2013). "Newport Middle School School Fast Facts 2013".
- ↑ Pennsylvania Department of Education, Professional Qualifications of Teachers Newport Middle School, October 4, 2013
- ↑ National Center of Education Statistics, Common Core of Data - Newport Middle School, 2010
- ↑ Pennsylvania Department of Education (September 29, 2016). "2016 PSSA AND KEYSTONE Results".
- ↑ Pennsylvania Department of Education (October 1, 2015). "2015 PSSA School Level Data".
- ↑ Pennsylvania Department of Education (October 1, 2015). "2015 PSSA State Level Data".
- ↑ Pennsylvania Department of Education (November 6, 2014). "Newport Middle School Academic Performance Data 2014".
- ↑ Pennsylvania Department of Education (October 4, 2013). "Newport Middle School Academic Performance Data 2013,".
- ↑ Office of First Lady (September 2, 2014). "Pennsylvania First Lady and Acting Secretary of Education Announce 35 Schools Statewide Implementing Dropout Program".
- ↑ Pennsylvania Department of Education, The Early Warning System, 2014
- ↑ Pennsylvania Department of Education, Newport Middle School AYP Overview 2012, September 21, 2012
- ↑ Pennsylvania Department of Education, Newport Middle School AYP Status 2010, March 10, 2011
- ↑ Pennsylvania Department of Education, Newport Middle School AYP Overview 2008, August 15, 2008
- ↑ Pennsylvania Department of Education. "IU16-PSSA 95-96 Results by School". Retrieved May 11, 2014.
- ↑ Pennsylvania Department of Education (2014). "Standards Aligned Systems".
- ↑ Pennsylvania Department of Education (2014). "State Academic Standards".
- ↑ Pennsylvania Department of Education (2014). "State Academic Standards Mathematics".
- ↑ Pennsylvania Department of Education, Newport Middle School Academic Report Card 2012, September 21, 2012
- ↑ Pennsylvania Department of Education, Newport Middle School Academic Achievement Report Card 2010, March 2010
- ↑ Pennsylvania Department of Education, PSSA Math and Reading Results 2009, September 2009
- ↑ Pennsylvania Department of Education, Newport Middle School Academic Achievement Report Card 2011, September 29, 2011
- ↑ Pennsylvania Department of Education. "PSSA Results Math and Reading School 2008".
- ↑ Pennsylvania Department of Education. "PSSA Math and Reading Results 2010".
- ↑ Pennsylvania Department of Education. "PSSA Math and Reading Results 2009".
- ↑ Pennsylvania Department of Education (October 14, 2016). "Newport Elementary School Fast Facts 2016".
- ↑ Pennsylvania Department of Education, School Performance Profile, Newport Elementary School Fast Facts, 2016
- ↑ Pennsylvania Department of Education (October 4, 2013). "Newport Elementary School Fast Facts".
- ↑ Pennsylvania Department of Education, School Performance Profile, Newport Elementary School Fast Facts 2013, October 4, 2013
- ↑ National Center for Education Statistics, Common Core of Data - Newport Elementary School, 2010
- ↑ Pennsylvania Department of Education, 2016 PSSA AND KEYSTONE Results, September 29, 2016
- ↑ Jan Murphy (September 29, 2016). "Standardized test scores show Pa. schools have more work to do". Pennlive.com.
- ↑ Pennsylvania Department of Education (October 1, 2015). "2015 PSSA School Level Data".
- ↑ Pennsylvania Department of Education (October 1, 2015). "2015 PSSA State Level Data".
- ↑ Pennsylvania Department of Education (November 6, 2014). "Newport Elementary School Academic Performance Data 2014".
- ↑ Pennsylvania Department of Education (October 4, 2013). "Newport Elementary School Academic Performance Data 2013".
- ↑ Pennsylvania Department of Education, Newport Elementary School AYP Status Report 2010, March 2011
- ↑ Pennsylvania Department of Education, Newport Elementary School AYP Status Report 2008, August 15, 2008
- ↑ Pennsylvania State Board of Education (2003). "PSSA results 2003".
- ↑ New America Foundation (2003). "No Child Left Behind Overview".
- ↑ The Goals of No Child Left Behind (Jul 20, 2010). "The Goals of No Child Left Behind".
- ↑ Learning Point Associates (220). "Understanding the No Child Left Behind Act" (PDF).
- ↑ Pennsylvania State Board of Education (January 11, 2003). "Pennsylvania Academic Standards Science and Technology, Ecology and Environment".
- ↑ Pennsylvania Department of Education, Newport Elementary School Academic Achievement Report Card 2012, September 21, 2012
- ↑ Pennsylvania Department of Education, Newport Elementary School Academic Achievement Report Card 2010, October 20, 2010
- ↑ Pennsylvania Department of Education, Newport Elementary School Academic Achievement Report Card 2009, September 2009
- ↑ Pittsburgh Post Gazette (October 15, 2012). "How is your school doing?".
- ↑ Pennsylvania Department of Education, Pennsylvania Pre-K Counts Grantees 2008-09, March 16, 2009
- ↑ Pennsylvania Department of Education, Pennsylvania PreK Counts Enrollment Contacts, March 22, 2010
- ↑ Pennsylvania Bureau of Special Education Services (2015). "Newport School District Special Education Data Report LEA Performance on State Performance Plan (SPP) Targets" (PDF).
- ↑ Pennsylvania Bureau of Special Education (January 31, 2011). "Newport School District Special Education Data Report LEA Performance on State Performance Plan (SPP) Targets School Year 2008-2009" (PDF). Archived from the original (PDF) on April 23, 2012. Retrieved April 15, 2011.
- ↑ Gerald L. Zahorchak, D. Ed. (May 30, 2007). "House Education Committee Hearing on Governor's Proposed Increase for Accountability Block Grants Testimony for Gerald L. Zahorchak, D. Ed. Secretary, Pennsylvania Department of Education" (PDF). Archived from the original (PDF) on June 26, 2015.
- ↑ Newport School District (2010–2011). "Newport School District Special Education Department - Annual Public Notice of Special Education Services". Archived from the original on 2012-04-25. Retrieved 2011-10-26.
- ↑ Pennsylvania Department of Education. "Pennsylvania Special Education Funding".
- ↑ Browne, Patrick., Senate Education Committee Hearing on Special Education Funding & Accountability testimony, November 1, 2011
- ↑ Kintisch, Baruch., Public Hearing: Special Education Funding & Accountability Testimony, Education Law Center, November 11, 2011
- ↑ Amy Morton, Executive Deputy Secretary, Public Hearing: Special Education Funding & Accountability Testimony, Pennsylvania Department of Education, November 11, 2011
- ↑ US Department of Education, U.S. Department of Education Clarifies Schools' Obligation to Provide Equal Opportunity to Students with Disabilities to Participate in Extracurricular Athletics, January 25, 2013
- ↑ Pennsylvania Department of Education (July 2010). "Special Education Funding from Pennsylvania State_2010-2011".
- ↑ Pennsylvania Department of Education (2011). "Special Education Funding 2011-2012 Fiscal Year".
- ↑ Pennsylvania Department of Education (April 2012). "Investing in PA kids,".
- ↑ Pennsylvania Department of Education, Special Education funding report by LEA, July 2014
- ↑ Pennsylvania Department of Education, BEF, Special Education Funding, RTL Grants 2016-17, July 2016
- ↑ Pennsylvania Department of Education (July 2010). "Gifted Students as Percentage of Total Enrollment by School District/Charter School" (PDF). Archived from the original (PDF) on 2016-03-04.
- ↑ Pennsylvania Department of Education and Pennsylvania School Board (February 4, 2011). "CHAPTER 16. Special Education For Gifted Students".
- ↑ Center for Safe Schools (2013). "Newport School District Safety Report 2013" (PDF).
- ↑ Commonwealth of Pennsylvania Safe School Center (2012). "Pennsylvania Safe Schools Online Reports".
- ↑ Safe & Responsive Schools Project (June 20, 2011). "Area high school students create anti-bullying mural". Williamsport Sun Gazette.
- ↑ Newport School Board (March 16, 2009). "Bullying Policy 249".
- ↑ Pennsylvania General Assembly (2006). "Regular Session 2007–2008 House Bill 1067, Act 61 Section 6 page 8".
- ↑ Center for Safe Schools of Pennsylvania (2006). "Bullying Prevention advisory".
- ↑ Pennsylvania Department of Education (2012). "Bullying, Hazing, and Harassment Resources". Archived from the original on 2011-11-21.
- ↑ Pennsylvania State Board of Education (January 11, 2003). "Pennsylvania Academic Standards Health, Safety and Physical Education".
- ↑ Pennsylvania Department of Education (February 21, 2014). "Acting Secretary of Education Announces $2.6 Million in Safe Schools Targeted Grants".
- ↑ Pennsylvania General Assembly, Taxpayer Relief Act, Act 1 of the Special Session of 2006, June 27, 2006
- ↑ "Newport School District Payroll report 2016". OpenPAGov.org. 2016.
- ↑ Times Tribune (June 16, 2013). "PA Teacher Profile Database 2011-12".
- ↑ Pennsylvania Department of Education (2013). "Investing in Pennsylvania Students".
- ↑ "School District Payroll report 2011". OpenPA Gov.org. 2013.
- ↑ Times Tribune (June 16, 2013). "PA Teacher Profile Database 2011-12".
- ↑ Pennsylvania School Employees Retirement System (2014). "Your PSERS Benefits & Leaving Employment".
- ↑ American Enterprise Institute, (2011). "Assessing the Compensation of Public School Teachers". Archived from the original on 2013-01-03.
- ↑ Pennsylvania Department of Education (2013). "Investing in Pennsylvania Students".
- ↑ "Newport School District Payroll report 2012-13". OpenPA Gov.org. 2014.
- ↑ Pennsylvania Department of Education (2012). "Investing in Pennsylvania Students".
- ↑ American Enterprise Institute (2011). "Assessing the Compensation of Public School Teachers". Archived from the original on 2013-01-03.
- ↑ Times Tribune (June 16, 2013). "PA Teacher Profile Database 2011-12".
- ↑ Asbury Park Press (2009). "PA. Public School Salaries".
- ↑ Fenton, Jacob, Average classroom teacher salaries in Perry County, 2006-07. The Morning Call. Accessed March 2010.
- ↑ Teachers need to know enough is enough, PaDelcoTimes, April 20, 2010.
- ↑ Newport Professional Education Association Employment Contract 2009
- ↑ Pennsylvania Department of Education Funding Report by LEA October 2009.
- ↑ Fenton, Jacob., Pennsylvania School District Data: Will School Consolidation Save Money?, The Morning Call, February 2009
- ↑ Newport School District School Board Meeting Minutes December 16, 2009.
- ↑ "Central Pennsylvania School Districts Spending Versus Academic Results". 2009. Archived from the original on 2014-10-08.
- ↑ Pennsylvania Department of Education (2010). "2009-10 Selected Data - 2009-10 Total Expenditures per ADM".
- ↑ United States Census Bureau (2009). "States Ranked According to Per Pupil Elementary-Secondary Public School System Finance Amounts: 2008-09" (PDF).
- ↑ US Census Bureau (2009). "Total and current expenditures per pupil in fall enrollment in public elementary and secondary education, by function and state or jurisdiction: 2006-07".
- ↑ US Census Bureau (March 2003). "Public Education Finances 2000-01 Annual Survey of Local Government Finances" (PDF).
- ↑ Pennsylvania Department of Education, Finances AFR General Fund Balance by District, May 2011
- ↑ Pennsylvania Department of Education. "Fund Balances by Local Education Agency 1997 to 2008". Archived from the original on 2014-10-21.
- ↑ Murphy, Jan., Pennsylvania's public schools boost reserves, CentreDaily Times, September 22, 2010
- ↑ Melissa Daniels (June 1, 2013). "PA school districts look to cash stash to balance budgets". PA Independent. Archived from the original on August 26, 2013.
- ↑ PDE (2014). "Investing in Pennsylvania Students".
- ↑ Casey, Thom, District taxes rise even higher, Perry County Times. February 24, 2010.
- ↑ Boyer, Lauren (March 23, 2010). "Tempers flare in Newport as school board eliminates 14 teaching positions, two programs". The Patriot News.
- ↑ Casey, Thom, Newport board accepts Helm’s resignation, Perry County Times. December 30, 2009.
- ↑ "NEWPORT SCHOOL DISTRICT PERRY COUNTY, PENNSYLVANIA PERFORMANCE AUDIT REPORT". January 2009.
- ↑ Pennsylvania Department of Education (May 2012). "Pennsylvania Public School District Tuition Rates".
- ↑ Pennsylvania Department of Revenue (October 2010). "Personal Income Tax Information".
- ↑ John Finnerty (2013). "PA teachers pensions". CNHI Harrisburg Bureau.
- ↑ Pennsylvania Representative Todd Stephens (January 23, 2014). "LEEF Funding Chart 2014".
- ↑ Nathan Benefield and James Paul Senior Policy Analyst (December 3, 2014). "School Funding Reform & Weighted Student Funding" (PDF).
- ↑ Pennsylvania General Assembly - Education Reform Commission (December 2014). "Basic Education Funding Commission Public Hearing Funding Issues related to Enrollment and Growth".
- ↑ Basic Education Funding Commission, Commission minutes, 2016
- ↑ York Dispatch, Governor Wolf Signs Fair Funding Formula, June 2016
- ↑ Pennsylvania General Assembly (June 2016). "House Bill 1552, Act 35 of 2016".
- ↑ Pennsylvania Department of Education, Education Budget 2017-18, July 2017
- ↑ PDE, Special Education Funding fiscal year 2017-18, July 2017
- ↑ PA Office of Budget (July 2016). "Commonwealth 2016-17 Enacted Budget Line-Item Appropriations" (PDF).
- ↑ Charles Thompson (June 30, 2017). "Pennsylvania state lawmakers start chewing into $32 billion, agreed-to budget proposal". Pennlive.com.
- ↑ Pennsylvania Department of Education, Education Budget 2016-17, July 2016
- ↑ PDE, Special Education Funding fiscal year 2016-17, July 2017
- ↑ PA Office of Budget, Commonwealth 2016-17 Enacted Budget Line-Item Appropriations, July 2016
- ↑ Jan Murphey (January 4, 2016). "Here's the payout your school district gets from the partial 2015-16 state budget". Pennlive.com.
- ↑ Jennifer Wakeman (January 4, 2016). "Harrisburg releases $3.3 billion in delayed funds".
- ↑ Pennsylvania General Assembly (June 26, 2015). "Basic Education Funding Commission".
- ↑ Jan Murphy (April 15, 2016). "House, Senate cast veto-proof majority votes on school funding bill". Pennlive.com.
- ↑ PDE, Ed Budget 2015-16, May 2016
- ↑ PDE (July 7, 2014). "Enacted Education Budget 2014-2015".
- ↑ Pennsylvania Department of Education, 2014-15 Enacted Education Budget Fast Facts, July 14, 2014
- ↑ Democrat Appropriations Committee, Report on Education funding by LEA, July 2, 2013
- ↑ Pennsylvania Office of the Budget, 2013-14 State Budget Highlights, 2013
- ↑ Senator Jake Corman (June 28, 2012). "Pennsylvania Education funding by Local School District" (PDF). Archived from the original (PDF) on July 30, 2012.
- ↑ Pennsylvania General Assembly Sen Jake Corman (June 29, 2012). "SB1466 of 2012 General Fund Appropriation".
- ↑ PA Senate Appropriations Committee (June 28, 2011). "School District 2011-12 funding Report". Archived from the original on October 8, 2014.
- ↑ Pennsylvania Department of Education, Funding Report by Local Education Agency, 2010.
- ↑ Pennsylvania house Appropriations Committee (August 2010). "PA House Appropriations Committee Basic Education Funding-Printout2 2010-2011". Archived from the original on 2014-10-08.
- ↑ Office of Budget, (February 2010). "Pennsylvania Budget Proposal,".
- ↑ Pennsylvania Department of Education, 2009-2010 Funding Report by Local Education Agency, October 2009.
- ↑ Pennsylvania Department of Education Funding Report by LEA October 2009.
- ↑ Pennsylvania Department of Education. "Accountability Block Grant report 2010, Grantee list 2010".
- ↑ Pennsylvania Department of Education (2010). "Accountability Block Grant Mid Year report". Archived from the original on 2013-10-15.
- ↑ Pennsylvania Department of Education (2013). "Passport for Learning Block Grant".
- ↑ Pennsylvania Auditor General (2008-12-22). "Classrooms For the Future grants audit" (PDF).
- ↑ Pennsylvania Training & Technical Assistance Network. "Tutoring: Educational Assistance Program" (PDF). Archived from the original (PDF) on 2012-03-10.
- ↑ "Pennsylvania School Tutoring - Education Assistance Program 2010-2011". July 2010. Archived from the original on 2012-11-07. Retrieved 2017-09-10.
- ↑ Pennsylvania Department of Education (2010). "Pennsylvania PreK Counts End of Year Report 2009-10" (PDF).
- ↑ Office of Child Development and Early Learning (2009). "Early Childhood Programs - PreK Counts".
- ↑ Pennsylvania Department of Education, Science: It’s Elementary Grantees Students in 143 Schools Benefit from Intensive Science Curriculum, July 22, 2008
- ↑ Department of Environmental Protection (2014). "Environmental Education Grants".
- ↑ Pennsylvania Department of Environmental Protection (April 22, 2013). "Governor Corbett Awards 92 Grants for Environmental Education and Stewardship".
- ↑ Pennsylvania Department of Education (May 23, 2012). "Pennsylvania Awards $36.1 Million to Strengthen Literacy Programs".
- ↑ Pennsylvania Department of Education Press Office (October 17, 2013). "Acting Secretary of Education Says Hybrid Learning Benefits Students; Highlights Success of First-Year Pilot Program".
- ↑ Pennsylvania Department of Education (2009). "Common Cents program - Making Every Dollar Count".
- ↑ Commonwealth of Pennsylvania (2009). "Perry County ARRA FUNDING". Archived from the original on 2009-11-19.
- ↑ US Department of Education, Secretary of Education, Arne Duncan remarks - “Working in the Nation’s Lowest-Performing Schools: A Progress Report”, MARCH 19, 2012
- ↑ Pennsylvania Department of Education (August 23, 2011). "Education Secretary Announces $66 Million Awarded to Reform Pennsylvania Lowest-Achieving Schools". Archived from the original on November 9, 2012.
- ↑ Pennsylvania Department of Education (2010). "School Improvement grants 2010". Archived from the original on 2011-07-17.
- ↑ Pennsylvania Department of Education (2010). "School Improvement information".
- ↑ Pennsylvania Department of Education. "Pennsylvania School Improvement Grant Components_Stat_Requirements". Archived from the original on 2012-11-06.
- ↑ Pennsylvania Department of Education (2010). "PA Department of Education School Improvement Federal Funds for School Reforms to Boost Student Achievement Awardees 2010". Archived from the original on 2012-11-05.
- ↑ Pennsylvania's 'Race to the Top' Fueled by Effective Reforms, Strong Local Support Governor's Office Press Release January 20, 2010
- ↑ Race to the Top Fund, U.S. Department of Education, March 29, 2010.
- ↑ PDE (2015). "TITLE II, PART A - TEACHER AND PRINCIAL TRAINING & RECRUITING".
- ↑ PDE (2015). "Federal Programs".
- ↑ PDE, Title IIA egrants 2012-13, 2012
- ↑ PDE, Title IIA egrants 2014-15, 2014
- ↑ US Department of Education (September 15, 2004). "Title III — Language Instruction for Limited English Proficient and Immigrant Students".
- ↑ PDE, English As A Second Language (ESL), 2015
- ↑ Pennsylvania Department of Education (July 1, 2009). "Educating Students with Limited English Proficiency" (PDF).
- ↑ PDE (2015). "Title III Supplemental Program".
- ↑ PDE, Title III Grant Allocations 2014-15, 2014
- ↑ PDE (November 2016). "Finances RE Tax Rates 2016-17".
- ↑ Katie Colaneri (June 11, 2015). "New pipeline could mean tax bonanza for NJ towns, but for Pa.? Not so much". State Impact NPR.org.
- ↑ Pennsylvania Department of Education, Act 511 Tax Report, 2004
- ↑ PDE, Real Estate Taxes by LEA, 2015
- ↑ "Newport School budget built without tax increase". Perry County Times. June 7, 2014.
- ↑ Pennsylvania Department of Education, Real Estate Tax Millage by School District, May 2013
- ↑ Pennsylvania Department of Education, Real Estate Tax Millage by School District, May 2012
- ↑ Pennsylvania Department of Education (May 2011). "Real Estate Tax Millage by School District,".
- ↑ Pennsylvania Department of Education. "Finances_Real Estate Tax Rates 2010-11".
- ↑ Pennsylvania Department of Education. "Finances_Real Estate Tax Rates 2009-10".
- ↑ Pennsylvania Department of Education (2008). "Pennsylvania School District Real Estate Tax Rates 2008-09".
- ↑ Pennsylvania Department of Education (2008). "Real Estate Tax Millage by School District,".
- ↑ Pennsylvania Department of Education, Real Estate Tax Millage by School District, 2006
- ↑ Pennsylvania Department of Education, Real Estate Tax Millage by School District, 2005
- ↑ Tax-rates.org., County Property Taxes 2012, 2012
- ↑ Pennsylvania Department of Education, Pennsylvania School Finances - Summaries of Annual Financial Report Data 2010-11, 2011
- ↑ New Census Data on Property Taxes on Homeowners, Tax Foundation, September 22, 2009.
- ↑ Pennsylvania Department of Education (2010). "2010-11 Act 1 of 2006 Referendum Exception Guidelines".
- ↑ Kaitlynn Riely (August 4, 2011). "Law could restrict school construction projects". Pittsburgh Post-Gazette.
- ↑ Pennsylvania General Assembly (June 2011). "SB330 of 2011".
- ↑ Eric Boehm (July 1, 2011). "Property tax reform final piece of state budget". PA Independent. Archived from the original on July 4, 2011.
- ↑ Pennsylvania Department of Education (May 2010). "Special Session Act 1 of 2006 School District Adjusted Index for 2006-2007 through 2011-2012".
- ↑ Pennsylvania Department of Education, 2011-2012 School District Adjusted Index, September 2010
- ↑ Pennsylvania Department of Education, 2012-2013 School District Adjusted Index Listing, Pennsylvania Department of Education, May 2011
- ↑ Pennsylvania Department of Education, 2013-2014 School District Adjusted Index, September 2012
- ↑ Pennsylvania Department of Education, 2014-2015 School District Adjusted Index, September 2013
- ↑ Pennsylvania Department of Education, 2015-2016 School District Adjusted Index, September 2014
- ↑ Pennsylvania Department of Education (September 5, 2015). "2016-2017 School District Adjusted Index,".
- ↑ Pennsylvania Department of Education (2015). "Property Tax Relief".
- ↑ PA Department of Education (September 10, 2016). "Index Calculation Required by Special Session Act 1 of 2006".
- ↑ Pennsylvania Department of Education (2016). "2017-18 School District Adjusted Index Listing".
- ↑ Pennsylvania Department of Education (April 2016). "Report on Referendum Exceptions For School Year 2016-2017".
- ↑ PSERS (December 10, 2015). "Fiscal Year 2016/2017 Employer Contribution Rate" (PDF).
- ↑ USA IRS (December 14, 2016). "Understanding Employment Taxes".
- ↑ Pennsylvania Department of Education (April 2015). "Taxpayer Relief Act Special Session Act 1 of 2006 Report on Referendum Exceptions For School Year 2015-2016".
- ↑ Pennsylvania School Employees, Retirement System, PSERS Chart showing payment mandates 2007-2020, 2014
- ↑ Pennsylvania Department of Education (April 30, 2014). "Report on Referendum Exceptions For School Year 2014-2015".
- ↑ Pennsylvania Department of Education, Report on Referendum Exceptions For School Year 2013-2014, April 2013
- ↑ Pennsylvania Department of Education, Report on Referendum Exceptions For School Year 2012-2013, March 30, 2012
- ↑ Pennsylvania Department of Education (2011). "Special Session Act 1 of 2006 the Taxpayer Relief Act information".
- ↑ Pennsylvania Department of Education (April 2011). "Report on Exceptions".
- ↑ Pennsylvania Department of Education (2011). "Special Session Act 1 of 2006 the Taxpayer Relief Act information".
- ↑ Pennsylvania Department of Education (April 2011). "Report on Exceptions".
- ↑ Pennsylvania Department of Education (May 2010). "Report on Referendum Exceptions for 2010-2011".
- ↑ Scarcella, Frank & Pursell, Tricia (May 25, 2010). "Local school tax assessments exceed state averages". The Daily Item.
- ↑ Pennsylvania Department of Education (May 2009). "Report on Referendum Exceptions for 2009-2010".
- ↑ Pennsylvania Department of Education (May 1, 2013). "2013-2014 Estimated State Property Tax Relief per Homestead".
- ↑ Pennsylvania Gaming Control Board (2014). "Gaming Benefits for Pennsylvanians".
- ↑ Pennsylvania Department of Education, Tax Relief per homestead May 1, 2010, accessed May 18, 2010
- ↑ Pennsylvania Department of Education (May 2010). "Tax Relief per Homestead 5-1-10. Report".
- ↑ Pennsylvania Auditor General Office, Special Report Pennsylvania Property Tax Relief, 2-23-2010.
- ↑ Elias, Joe., Pennsylvania Treasury Department to issue $238 million in property tax rebates, The Harrisburg Patriot-News, |June 30, 2012
- ↑ Pennsylvania Department of Revenue., Property Tax/Rent Rebate Program, June 2012
- ↑ PDE, Pennsylvania Public School Enrollments and Projections G-O 2008-09, 2010
- ↑ Rendell, E. & Soderberg, M. (2009). Pennsylvania school district consolidation. 2009-10 Executive Budget Fast Facts. Pennsylvania Office of the Governor.
- ↑ Study of the cost-effectiveness of consolidating Pennsylvania districts. New York: Standard & Poor’s School Evaluation Services. 2007, p. 6.
- ↑ Pennsylvania Legislative Budget and Finance Committee, Study of the Cost Effectiveness of Consolidating Pennsylvania School Districts, 2007.
- ↑ "Research Analyzes Rural School District Enrollment and Building Capacity", The Center for Rural Pennsylvania. October 2009
- ↑ Newport School Board (2009). "Student Wellness Policy 249".
- ↑ Probart C, McDonnell E, Weirich JE, Schilling L, Fekete V (September 2008). "Statewide assessment of local wellness policies in Pennsylvania public school districts". J Am Diet Assoc. 108 (9): 1497–502. doi:10.1016/j.jada.2008.06.429. PMID 18755322.
- ↑ Pennsylvania Department of Education – Division of Food and Nutrition (July 2008). "Nutrition Standards for Competitive Foods in Pennsylvania Schools for the School Nutrition Incentive".
- ↑ USDA, Child Nutrition Programs - Eligibility Manual for School Meals, 2012
- ↑ Pennsylvania Hunger Action Center, The Pennsylvania School Breakfast Report Card, 2009
- ↑ USDA, Child Nutrition Programs, June 27, 2013
- ↑ United States Department of Agriculture (2011). "Food and Nutrition Service Equity in School Lunch Pricing Fact Sheet" (PDF). Archived from the original (PDF) on 2013-09-22.
- ↑ Denver Nicks (February 25, 2014). "White House Sets New Limits on Junk Food Ads in Schools". Time Magazine.
- ↑ USDA Food and Nutrition Service (2014). "School Meals FAQ".
- ↑ Newport School Health Administration (2014). "Newport School Nurse".
- ↑ Pennsylvania State Department of Health (2010). "Pennsylvania Bulletin Doc. No. 10-984 School Immunizations; Communicable and Noncommunicable Diseases".
- ↑ Pennsylvania Department of Health (2014). "School Immunization Requirements".
- ↑ York Dispatch (February 4, 2016). "All PA high schools to receive donated naloxone kits".
- ↑ Ben Allen (February 2, 2016). "Pa. to put drug that reverses overdoses in schools for free". WITF.
- ↑ Kristin Ioannou; Highmark. Inc. (2007). "PR Newswire, Highmark Healthy High 5 Health eTools for Schools Available Free Through 2009".
- ↑ Cathy Hoffman, Interlink (September 2, 2008). "Highmark Foundation Extends Subsidy for Health eTools for Schools through 2013" (PDF).
- ↑ Newport School Board (October 10, 2009). "Newport School District Extracurricular Activity Policy 122". Archived from the original on October 3, 2011. Retrieved April 15, 2011.
- ↑ Newport School Board (December 15, 2005). "Newport School District Interscholastic Athletics Activity Policy 123". Archived from the original on October 3, 2011. Retrieved April 15, 2011.
- ↑ Newport School Board (October 10, 2009). "Newport School District Athletic Eligibility Activity Policy 123.1". Archived from the original on October 3, 2011. Retrieved April 15, 2011.
- ↑ Newport School District Administration Report to PDE - New POrt School District budget, June 2014
- ↑ Sean Sauro (May 3, 2014). "Newport School Board approves athletic trainer". Perry County Times.
- ↑ Newport School District, Newport School District Teacher Union Contract, 2014
- ↑ PA General Assembly (July 1, 2012). "Senate Bill 200 of Session 2011 Safety in Youth Sports Act".
- ↑ UMPC Sports Medicine (2014). "Managing Concussions in Student Athletes: The Safety in Youth Sports Act".
- ↑ Pennsylvania Office of the Governor Press Release, (November 10, 2005). "Home-Schooled, Charter School Children Can Participate in School District Extracurricular Activities,". Archived from the original on October 23, 2014.
- ↑ Newport School Board (March 20, 2006). "Newport School District Extracurricular Participation by Home Policy 137.1". Archived from the original on October 3, 2011. Retrieved April 15, 2011.
- ↑ Newport School Board (March 20, 2006). "Newport School District Extracurricular Participation by Charter/Cyber Charter Students Policy 140.1". Archived from the original on October 3, 2011. Retrieved April 15, 2011.
- ↑ Newport School Board, Newport School District Teacher Union Contract, 2014
- ↑ Pennsylvania Interscholastic Athletics Association (2014). "PIAA School Directory".
External links
Perry County, Pennsylvania Schools | |||||||||||||
|---|---|---|---|---|---|---|---|---|---|---|---|---|---|
| |||||||||||||
| |||||||||||||