Wellington—Halton Hills (provincial electoral district)
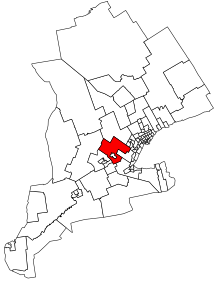 Wellington-Halton Hills in relation to other southern Ontario ridings | |||
| Provincial electoral district | |||
| Legislature | Legislative Assembly of Ontario | ||
| MPP |
Progressive Conservative | ||
| District created | 2004 | ||
| First contested | 2007 | ||
| Last contested | 2018 | ||
| Demographics | |||
| Population (2006) | 111,241 | ||
| Electors (2007) | 75,358 | ||
| Area (km²) | 1,584 | ||
| Pop. density (per km²) | 70.2 | ||
| Census divisions | Wellington County, Halton | ||
| Census subdivisions | Guelph, Guelph/Eramosa, Puslinch, Erin, Centre Wellington, Halton Hills | ||
Wellington—Halton Hills is a provincial electoral district in western Ontario, Canada. It elects one member to the Legislative Assembly of Ontario.
The riding, which was first contested in the 2007 provincial election, consists of the municipalities of Guelph/Eramosa, Puslinch, Erin, Centre Wellington and Halton Hills.
47.5% of the riding came from Halton, 25.2% came from Waterloo—Wellington, 16.3% came from Guelph—Wellington and 11% came from Dufferin—Peel—Wellington—Grey. Although it is counted as a Midwestern Ontario riding, the Halton Hills portion is part of the Greater Toronto Area.
Members of Provincial Parliament
| Wellington—Halton Hills | ||||
|---|---|---|---|---|
| Assembly | Years | Member | Party | |
| Riding created from Halton, Waterloo—Wellington, Guelph—Wellington and Dufferin—Peel—Wellington—Grey |
||||
| 39th | 2007–2011 | Ted Arnott | Progressive Conservative | |
| 40th | 2011–2014 | |||
| 41st | 2014–2018 | |||
| 42nd | 2018–Present | |||
Election results
| Ontario general election, 2018 | ||||||||
|---|---|---|---|---|---|---|---|---|
| ** Preliminary results — Not yet official ** | ||||||||
| Party | Candidate | Votes | % | ±% | ||||
| Progressive Conservative | Ted Arnott | 31,659 | 54.00 | +7.32 | ||||
| New Democratic | Diane Ballantyne | 14,087 | 24.03 | +9.88 | ||||
| Liberal | Jon Hurst | 7,492 | 12.78 | -16.34 | ||||
| Green | Dave Rodgers | 5,066 | 8.64 | -5.51 | ||||
| Libertarian | Jadon Pfeiffer | 320 | 0.55 | -1.73 | ||||
| Total valid votes | 58,624 | 100.0 | ||||||
| Total rejected, unmarked and declined ballots | ||||||||
| Turnout | 64.26 | |||||||
| Eligible voters | 91,228 | |||||||
| Progressive Conservative hold | Swing | -1.28 | ||||||
| Source: Elections Ontario[1] | ||||||||
| Ontario general election, 2014 | ||||||||
|---|---|---|---|---|---|---|---|---|
| Party | Candidate | Votes | % | ±% | ||||
| Progressive Conservative | Ted Arnott | 22,600 | 46.68 | -8.94 | ||||
| Liberal | Daniel Zister | 14,095 | 29.12 | +2.29 | ||||
| New Democratic | Michael Carlucci | 6,848 | 14.15 | -0.30 | ||||
| Green | Dave Rodgers | 3,566 | 7.37 | +4.27 | ||||
| Libertarian | Jason Cousineau | 1,104 | 2.28 | |||||
| Freedom | Mitch Sproule | 198 | 0.40 | |||||
| Total valid votes | 48,411 | 100.00 | ||||||
| Progressive Conservative hold | Swing | -5.62 | ||||||
| Source: Elections Ontario[2] | ||||||||
| Ontario general election, 2011 | ||||||||
|---|---|---|---|---|---|---|---|---|
| Party | Candidate | Votes | % | ±% | ||||
| Progressive Conservative | Ted Arnott | 23,495 | 55.62 | +6.46 | ||||
| Liberal | Moya Johnson | 11,334 | 26.83 | -3.56 | ||||
| New Democratic | Dale Hamilton | 6,106 | 14.45 | +5.52 | ||||
| Green | Raymond Dartsch | 1,309 | 3.10 | -7.15 | ||||
| Total valid votes | 42,244 | 100.00 | ||||||
| Total rejected, unmarked and declined ballots | 137 | 0.32 | ||||||
| Turnout | 42,381 | 51.11 | ||||||
| Eligible voters | 82,926 | |||||||
| Progressive Conservative hold | Swing | +5.01 | ||||||
| Source: Elections Ontario[3] | ||||||||
| Ontario general election, 2007 | ||||||||
|---|---|---|---|---|---|---|---|---|
| Party | Candidate | Votes | % | ±% | ||||
| Progressive Conservative | Ted Arnott | 21,533 | 49.16 | -3.17 | ||||
| Liberal | Marg Bentley | 13,312 | 30.39 | -2.34 | ||||
| Green | Martin Lavictoire | 4,489 | 10.25 | |||||
| New Democratic | Noel Duignan | 3,914 | 8.94 | -0.25 | ||||
| Family Coalition | Giuseppe Gori | 555 | 1.27 | |||||
| Total valid votes | 43,803 | 100.00 | ||||||
| Progressive Conservative hold | Swing | -0.42 | ||||||
^ Change based on redistributed results
2007 electoral reform referendum
| Ontario electoral reform referendum, 2007 | |||
|---|---|---|---|
| Side | Votes | % | |
| First Past the Post | 28,316 | 66.0 | |
| Mixed member proportional | 14,589 | 34.0 | |
| Total valid votes | 42,905 | 100.0 | |
Sources
- ↑ "Candidate Search". Elections Ontario. Retrieved 18 May 2018.
- ↑ Elections Ontario. "General Election Results by District, 099 Wellington-Halton Hills". Retrieved 13 June 2014.
- ↑ Elections Ontario (2011). "Official return from the records / Rapport des registres officiels - Wellington—Halton Hills" (PDF). Retrieved 2 June 2014.
This article is issued from
Wikipedia.
The text is licensed under Creative Commons - Attribution - Sharealike.
Additional terms may apply for the media files.