Leeds—Grenville—Thousand Islands and Rideau Lakes (provincial electoral district)
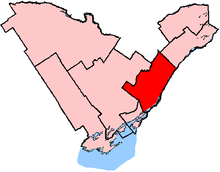 Leeds–Grenville shown within the Eastern Ontario region | |||
| Provincial electoral district | |||
| Legislature | Legislative Assembly of Ontario | ||
| MPP |
Progressive Conservative | ||
| District created | 1986 | ||
| First contested | 1987 | ||
| Last contested | 2018 | ||
| Demographics | |||
| Population (2006) | 99,206 | ||
| Electors (2008) | 73,763 | ||
| Area (km²) | 3,751 | ||
| Pop. density (per km²) | 26.4 | ||
| Census divisions | Leeds and Grenville | ||
| Census subdivisions | Athens, Augusta, Brockville, Edwardsburgh/Cardinal, Elizabethtown–Kitley, Front of Yonge, Gananoque, Leeds and the Thousand Islands, Merrickville–Wolford, North Grenville, Prescott, Rideau Lakes, Westport | ||
Leeds—Grenville—Thousand Islands and Rideau Lakes is a provincial electoral district in Ontario, Canada, that has been represented in the Legislative Assembly of Ontario since 1987. Before the 2018 election, it was known simply as Leeds—Grenville.
It consists of the United Counties of Leeds and Grenville.
Since 1999, provincial ridings have been defined to have the same borders as federal ridings.
For the 2018 election, the district gave up a small portion of territory to Lanark--Frontenac--Kingston.
Members of Provincial Parliament
| Assembly | Years | Member | Party | |
|---|---|---|---|---|
| Leeds—Grenville Riding created from Leeds and Grenville |
||||
| 34th | 1987–1990 | Bob Runciman | Progressive Conservative | |
| 35th | 1990–1995 | |||
| 36th | 1995–1999 | |||
| 37th | 1999–2003 | |||
| 38th | 2003–2007 | |||
| 39th | 2007–2010 | |||
| 2010–2011 | Steve Clark | |||
| 40th | 2011–2014 | |||
| 41st | 2014–2018 | |||
| Leeds—Grenville—Thousand Islands and Rideau Lakes | ||||
| 42nd | 2018–Present | Steve Clark | Progressive Conservative | |
Election results
| Ontario general election, 2018 | ||||||||
|---|---|---|---|---|---|---|---|---|
| ** Preliminary results — Not yet official ** | ||||||||
| Party | Candidate | Votes | % | ±% | ||||
| Progressive Conservative | Steve Clark | 29,996 | 61.29 | +5.22 | ||||
| New Democratic | Michelle Taylor | 9,669 | 19.76 | +2.65 | ||||
| Liberal | David Henderson | 6,543 | 13.37 | -7.12 | ||||
| Green | Derek Morley | 2,347 | 4.80 | -0.09 | ||||
| Libertarian | Bill Buckley | 389 | 0.79 | |||||
| Total valid votes | 100.00 | |||||||
| Turnout | 61.86 | |||||||
| Eligible voters | 79,115 | |||||||
| Progressive Conservative hold | Swing | |||||||
| Source: Elections Ontario[1] | ||||||||
| Ontario general election, 2014: Leeds—Grenville | ||||||||
|---|---|---|---|---|---|---|---|---|
| Party | Candidate | Votes | % | ±% | ||||
| Progressive Conservative | Steve Clark | 23,253 | 56.07 | −7.53 | ||||
| Liberal | Christine Milks | 8,499 | 20.49 | +3.06 | ||||
| New Democratic | David Lundy | 7,219 | 17.41 | +2.18 | ||||
| Green | Stephen Bowering | 2,030 | 4.89 | +1.44 | ||||
| Libertarian | Harold Gabriel | 471 | 1.14 | – | ||||
| Total valid votes | 41,472 | 100.0 | +8.43 | |||||
| Progressive Conservative hold | Swing | −5.30 | ||||||
Source(s)
Elections Ontario (2014). "Official result from the records, 042 Leeds-Grenville" (PDF). Retrieved 27 June 2015.
| ||||||||
| Ontario general election, 2011: Leeds—Grenville | ||||||||
|---|---|---|---|---|---|---|---|---|
| Party | Candidate | Votes | % | ±% | Expenditures | |||
| Progressive Conservative | Steve Clark | 24,314 | 63.60 | −3.08 | $ 52,598.00 | |||
| Liberal | Ray Heffernan | 6,663 | 17.43 | −2.65 | 17,512.99 | |||
| New Democratic | David Lundy | 5,822 | 15.23 | +10.12 | 13,274.26 | |||
| Green | Charlie Taylor | 1,319 | 3.45 | −4.22 | 3,731.20 | |||
| Socialist | Lance Fulsom | 111 | 0.29 | 0.00 | ||||
| Total valid votes / Expense limit | 38,229 | 100.0 | +37.72 | $ 90,198.43 | ||||
| Total rejected, unmarked and declined ballots | 155 | 0.40 | +0.09 | |||||
| Turnout | 38,384 | 50.64 | +14.03 | |||||
| Eligible voters | 75,797 | −0.34 | ||||||
| Progressive Conservative hold | Swing | −0.22 | ||||||
Source(s)
"Official return from the records / Rapport des registres officiels - Leeds—Grenville" (PDF).
"2011 Candidate Campaign Returns (CR-1)". Retrieved June 8, 2014. | ||||||||
| Ontario provincial by-election, March 4, 2010: Leeds—Grenville Resignation of Bob Runciman | ||||||||
|---|---|---|---|---|---|---|---|---|
| Party | Candidate | Votes | % | ±% | Expenditures | |||
| Progressive Conservative | Steve Clark | 18,510 | 66.68 | +10.44 | $ 27,511.00 | |||
| Liberal | Stephen Mazurek | 5,573 | 20.08 | −8.59 | 65,190.41 | |||
| Green | Neil Kudrinko | 2,130 | 7.67 | +0.49 | 14,799.66 | |||
| New Democratic | Steve Armstrong | 1,417 | 5.10 | −1.87 | 17,118.89 | |||
| Libertarian | Anthony Giles | 129 | 0.46 | 297.56 | ||||
| Total valid votes | 27,759 | 100.0 | −39.61 | |||||
| Total rejected ballots | 87 | 0.31 | −0.07 | |||||
| Turnout | 27,846 | 36.61 | −24.57 | |||||
| Eligible voters | 76,053 | +5.35 | ||||||
Source(s)
"Leeds—Grenville By-Election – March 4, 2010". Elections Ontario. Retrieved June 8, 2014.
"2010 By-Election Returns – Ottawa West-Nepean – Candidate (CR-1) & Association (CR-3) Returns". "Ontario's Runciman among 5 new senators". Toronto Star. January 29, 2010. Retrieved June 8, 2014. | ||||||||
| Ontario general election, 2007: Leeds—Grenville | ||||||||
|---|---|---|---|---|---|---|---|---|
| Party | Candidate | Votes | % | ±% | Expenditures | |||
| Progressive Conservative | Bob Runciman | 22,755 | 56.24 | +7.54 | $ 51,680.90 | |||
| Liberal | Lori Bryden | 11,602 | 28.67 | −11.46 | 38,465.17 | |||
| Green | Jeanie Warnock | 2,907 | 7.18 | +3.10 | 1,870.14 | |||
| New Democratic | Pauline Kuhlmann | 2,821 | 6.97 | +1.36 | 2,619.71 | |||
| Family Coalition | Michael Dwyer | 377 | 0.93 | −0.54 | 0.00 | |||
| Total valid votes/Expense limit | 40,462 | 100.0 | −8.10 | $ 79,644.04 | ||||
| Total rejected ballots | 190 | 0.47 | −0.02 | |||||
| Turnout | 40,652 | 55.11 | −7.00 | |||||
| Eligible voters | 73,763 | +3.55 | ||||||
Source(s) | ||||||||
| Ontario general election, 2003: Leeds—Grenville | ||||||||
|---|---|---|---|---|---|---|---|---|
| Party | Candidate | Votes | % | ±% | Expenditures | |||
| Progressive Conservative | Bob Runciman | 21,443 | 48.70 | −4.40 | $ 59,840.81 | |||
| Liberal | Stephen Mazurek | 17,667 | 40.13 | +0.84 | 57,732.05 | |||
| New Democratic | Steve Armstrong | 2,469 | 5.61 | +0.85 | 2,720.12 | |||
| Green | Jerry Heath | 1,799 | 4.09 | +1.80 | 7,267.53 | |||
| Family Coalition | Melody Trolly | 649 | 1.47 | 435.25 | ||||
| Total valid votes/Expense limit | 44,027 | 100.0 | −0.04 | $ 68,387.52 | ||||
| Total rejected ballots | 217 | 0.49 | −0.15 | |||||
| Turnout | 44,244 | 62.11 | +0.39 | |||||
| Eligible voters | 71,237 | −0.81 | ||||||
| Ontario general election, 1999: Leeds—Grenville | ||||||||
|---|---|---|---|---|---|---|---|---|
| Party | Candidate | Votes | % | ±% | Expenditures | |||
| Progressive Conservative | Bob Runciman | 23,390 | 53.10 | −10.16 | $ 65,879.18 | |||
| Liberal | Don Cameron | 17,307 | 39.29 | +13.26 | 54,543.00 | |||
| New Democratic | Jim Murray | 2,097 | 4.76 | −1.97 | 2,138.29 | |||
| Green | Ken Blackburn | 1,008 | 2.29 | −0.41 | 762.21 | |||
| Natural Law | Britt Roberts | 244 | 0.55 | 0.00 | ||||
| Total valid votes/Expense limit | 44,046 | 100.0 | +28.04 | $ 68,946.24 | ||||
| Total rejected ballots | 282 | 0.64 | −0.10 | |||||
| Turnout | 44,328 | 61.72 | −1.34 | |||||
| Eligible voters | 71,819 | +30.69 | ||||||
| Ontario general election, 1995: Leeds—Grenville | ||||||||
|---|---|---|---|---|---|---|---|---|
| Party | Candidate | Votes | % | ±% | Expenditures | |||
| Progressive Conservative | Bob Runciman | 21,763 | 63.27 | +14.20 | $ 44,550.77 | |||
| Liberal | Peter McKenna | 8,955 | 26.03 | −0.68 | 45,063.22 | |||
| New Democratic | Charles Stewart | 2,316 | 6.73 | −17.48 | 3,608.98 | |||
| Green | Peter Bevan-Baker | 927 | 2.69 | 1,692.83 | ||||
| Independent | Phillip Blancher | 438 | 1.27 | 669.80 | ||||
| Total valid votes/Expense limit | 34,399 | 100.0 | +0.20 | $ 47,488.00 | ||||
| Total rejected ballots | 255 | 0.74 | ||||||
| Turnout | 34,654 | 63.06 | ||||||
| Eligible voters | 54,953 | |||||||
Source(s)
"General Election of June 8 1995 – Summary of Valid Ballots by Candidate". Retrieved June 8, 2014.
"General Election of June 8 1995 – Statistical Summary". Elections Ontario. "1995 Details of Candidate Income and Expenses" (3.16MB). & "1995 Summary of Income and Campaign Expenses" ( | ||||||||
| Ontario general election, 1990: Leeds—Grenville | ||||||||
|---|---|---|---|---|---|---|---|---|
| Party | Candidate | Votes | % | ±% | ||||
| Progressive Conservative | Bob Runciman | 16,846 | 49.07 | +5.89 | ||||
| Liberal | Chris Puddicombe | 9,172 | 26.72 | −15.88 | ||||
| New Democratic | Art Lane | 8,312 | 24.21 | +9.99 | ||||
| Total valid votes | 34,330 | 100.0 | +0.25 | |||||
| Ontario general election, 1987: Leeds—Grenville | ||||||||
|---|---|---|---|---|---|---|---|---|
| Party | Candidate | Votes | % | |||||
| Progressive Conservative | Bob Runciman | 14,787 | 43.18 | |||||
| Liberal | Jim Jordan | 14,589 | 42.60 | |||||
| New Democratic | Geri Sheedy | 4,869 | 14.22 | |||||
| Total valid votes | 34,245 | 100.0 | ||||||
2007 electoral reform referendum
| Ontario electoral reform referendum, 2007 | |||
|---|---|---|---|
| Side | Votes | % | |
| First Past the Post | 28,156 | 71.19 | |
| Mixed Member Proportional | 11,392 | 28.81 | |
| Total valid votes | 39,548 | 100.00 | |
References
- ↑ "Candidate Search". Elections Ontario. Retrieved 18 May 2018.
External links
This article is issued from
Wikipedia.
The text is licensed under Creative Commons - Attribution - Sharealike.
Additional terms may apply for the media files.