Washington's 7th congressional district
| Washington's 7th congressional district | |
|---|---|
 | |
| Current Representative | Pramila Jayapal (D–Seattle) |
| Population (2010) | 683,158 |
| Median income | 61,747 |
| Ethnicity |
|
| Cook PVI | D+33[1] |
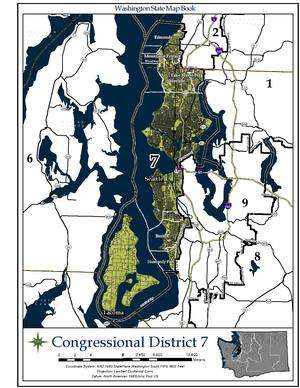
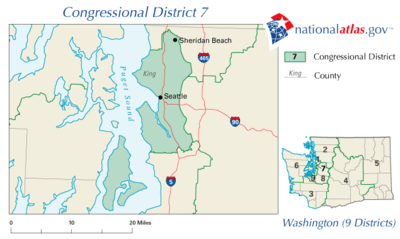
Washington's 7th congressional district encompasses most of Seattle, all of Vashon Island, Edmonds, Shoreline, Kenmore, and parts of Burien, Lake Forest Park, Mountlake Terrace, and Normandy Park. Since 2017, the 7th District has been represented in the U.S. House of Representatives by Pramila Jayapal, a Democrat.
The 7th is the most Democratic district in the Pacific Northwest, and the most Democratic district on the West Coast outside of the San Francisco Bay Area or Los Angeles. It is also the most Democratic majority-white district in the United States. Democrats dominate every level of government, and routinely win elections by well over 70 percent of the vote. Al Gore swept the 7th District in 2000 with 72% of the vote while John Kerry won 79% of the vote in the district in 2004. Barack Obama took in 84% of the vote in the district in 2008.
Washington's seventh seat in the U.S. House was added following the 1950 census, but the state did not immediately reapportion. It was contested as a statewide at-large seat for three elections: 1952, 1954, and 1956; and voters cast ballots for two congressional seats, their district and the at-large. Democrat Donald H. Magnuson won all three at-large elections. The 1958 election was the first after the state reapportioned to seven districts; Magnuson was elected to the new district in 1958 and 1960, but lost in 1962.
Election results from presidential races
| Year | Office | Results |
|---|---|---|
| 1964 | President | Johnson 62 - 38% |
| 1968 | President | Humphrey 52 - 40% |
| 1972 | President | Nixon 56 - 44% |
| 1976 | President | Carter 48 - 48% |
| 1980 | President | Reagan 44 - 42% |
| 1984 | President | Mondale 58 - 41% |
| 1988 | President | Dukakis 66 - 32% |
| 1992 | President | Clinton 65 - 18% |
| 1996 | President | Clinton 67 - 20% |
| 2000 | President | Gore 72 - 20% |
| 2004 | President | Kerry 79 - 19% |
| 2008 | President | Obama 84 - 15% |
| 2012 | President | Obama 79 - 18% |
| 2016 | President | Clinton 82 - 12% |
List of representatives
| Representative | Party | Dates | Electoral history |
|---|---|---|---|
| District created | January 3, 1959 | ||
 |
Democratic | January 3, 1959 – January 3, 1963 |
Redistricted from the At-large district. Lost re-election. |
 |
Republican | January 3, 1963 – January 3, 1965 |
Lost re-election. |
 |
Democratic | January 3, 1965 – January 22, 1977 |
Resigned to become U.S. Secretary of Transportation. |
| Vacant | January 22, 1977 – May 17, 1977 | ||
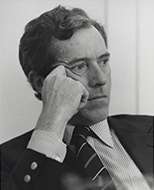 |
Republican | May 17, 1977 – January 3, 1979 |
Lost re-election. |
 |
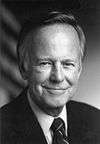
Democratic | January 3, 1979 – January 3, 1989 |
Retired to run for U.S. Senator. |
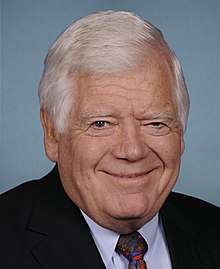 |
Democratic | January 3, 1989 – January 3, 2017 |
Retired. |
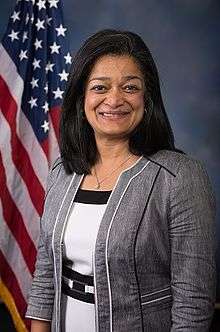 |
Democratic | January 3, 2017 – Present |
Elected in 2016 |
See also
References
- ↑ "Partisan Voting Index – Districts of the 115th Congress" (PDF). The Cook Political Report. April 7, 2017. Retrieved April 7, 2017.
- Martis, Kenneth C. (1989). The Historical Atlas of Political Parties in the United States Congress. New York: Macmillan Publishing Company.
- Martis, Kenneth C. (1982). The Historical Atlas of United States Congressional Districts. New York: Macmillan Publishing Company.
- Congressional Biographical Directory of the United States 1774–present