Venn diagram

| Part of a series on Statistics |
| Probability theory |
|---|
 |
A Venn diagram (also called primary diagram, set diagram or logic diagram) is a diagram that shows all possible logical relations between a finite collection of different sets. These diagrams depict elements as points in the plane, and sets as regions inside closed curves. A Venn diagram consists of multiple overlapping closed curves, usually circles, each representing a set. The points inside a curve labelled S represent elements of the set S, while points outside the boundary represent elements not in the set S. This lends to easily read visualizations; for example, the set of all elements that are members of both sets S and T, S ∩ T, is represented visually by the area of overlap of the regions S and T. In Venn diagrams the curves are overlapped in every possible way, showing all possible relations between the sets. They are thus a special case of Euler diagrams, which do not necessarily show all relations. Venn diagrams were conceived around 1880 by John Venn. They are used to teach elementary set theory, as well as illustrate simple set relationships in probability, logic, statistics, linguistics, and computer science.
A Venn diagram in which the area of each shape is proportional to the number of elements it contains is called an area-proportional or scaled Venn diagram.
Example

This example involves two sets, A and B, represented here as coloured circles. The orange circle, set A, represents all living creatures that are two-legged. The blue circle, set B, represents the living creatures that can fly. Each separate type of creature can be imagined as a point somewhere in the diagram. Living creatures that both can fly and have two legs—for example, parrots—are then in both sets, so they correspond to points in the region where the blue and orange circles overlap. It is important to note that this overlapping region would only contain those elements (in this example creatures) that are members of both set A (two-legged creatures) and are also members of set B (flying creatures.)
Humans and penguins are bipedal, and so are then in the orange circle, but since they cannot fly they appear in the left part of the orange circle, where it does not overlap with the blue circle. Mosquitoes have six legs, and fly, so the point for mosquitoes is in the part of the blue circle that does not overlap with the orange one. Creatures that are not two-legged and cannot fly (for example, whales and spiders) would all be represented by points outside both circles.
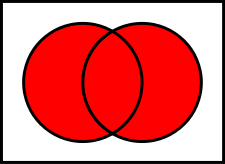
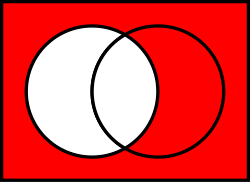
The combined region of sets A and B is called the union of A and B, denoted by A ∪ B. The union in this case contains all living creatures that are either two-legged or that can fly (or both).
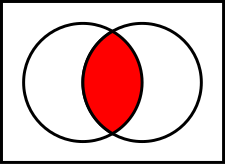
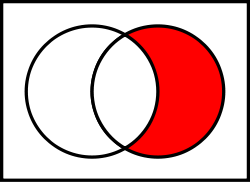
The region in both A and B, where the two sets overlap, is called the intersection of A and B, denoted by A ∩ B. For example, the intersection of the two sets is not empty, because there are points that represent creatures that are in both the orange and blue circles.
History
Venn diagrams were introduced in 1880 by John Venn in a paper entitled On the Diagrammatic and Mechanical Representation of Propositions and Reasonings in the "Philosophical Magazine and Journal of Science", about the different ways to represent propositions by diagrams.[1][2][3] The use of these types of diagrams in formal logic, according to Frank Ruskey and Mark Weston, is "not an easy history to trace, but it is certain that the diagrams that are popularly associated with Venn, in fact, originated much earlier. They are rightly associated with Venn, however, because he comprehensively surveyed and formalized their usage, and was the first to generalize them".[4]
Venn himself did not use the term "Venn diagram" and referred to his invention as "Eulerian Circles".[3] For example, in the opening sentence of his 1880 article Venn writes, "Schemes of diagrammatic representation have been so familiarly introduced into logical treatises during the last century or so, that many readers, even those who have made no professional study of logic, may be supposed to be acquainted with the general nature and object of such devices. Of these schemes one only, viz. that commonly called 'Eulerian circles,' has met with any general acceptance..."[1][2] Lewis Carroll (Charles Dodgson) includes "Venn's Method of Diagrams" as well as "Euler's Method of Diagrams" in an "Appendix, Addressed to Teachers" of his book "Symbolic Logic" (4th edition published in 1896). The term "Venn diagram" was later used by Clarence Irving Lewis in 1918, in his book "A Survey of Symbolic Logic".[4][5]
Venn diagrams are very similar to Euler diagrams, which were invented by Leonhard Euler in the 18th century.[note 1][6][7] M. E. Baron has noted that Leibniz (1646–1716) in the 17th century produced similar diagrams before Euler, but much of it was unpublished.[8] She also observes even earlier Euler-like diagrams by Ramon Llull in the 13th Century.[9]
In the 20th century, Venn diagrams were further developed. D. W. Henderson showed in 1963 that the existence of an n-Venn diagram with n-fold rotational symmetry implied that n was a prime number.[10] He also showed that such symmetric Venn diagrams exist when n is 5 or 7. In 2002 Peter Hamburger found symmetric Venn diagrams for n = 11 and in 2003, Griggs, Killian, and Savage showed that symmetric Venn diagrams exist for all other primes. Thus rotationally symmetric Venn diagrams exist if and only if n is a prime number.[11]
Venn diagrams and Euler diagrams were incorporated as part of instruction in set theory as part of the new math movement in the 1960s. Since then, they have also been adopted in the curriculum of other fields such as reading.[12]
Overview


A Venn diagram is constructed with a collection of simple closed curves drawn in a plane. According to Lewis,[5] the "principle of these diagrams is that classes [or sets] be represented by regions in such relation to one another that all the possible logical relations of these classes can be indicated in the same diagram. That is, the diagram initially leaves room for any possible relation of the classes, and the actual or given relation, can then be specified by indicating that some particular region is null or is not-null".[5]:157
Venn diagrams normally comprise overlapping circles. The interior of the circle symbolically represents the elements of the set, while the exterior represents elements that are not members of the set. For instance, in a two-set Venn diagram, one circle may represent the group of all wooden objects, while another circle may represent the set of all tables. The overlapping region or intersection would then represent the set of all wooden tables. Shapes other than circles can be employed as shown below by Venn's own higher set diagrams. Venn diagrams do not generally contain information on the relative or absolute sizes (cardinality) of sets; i.e. they are schematic diagrams.
Venn diagrams are similar to Euler diagrams. However, a Venn diagram for n component sets must contain all 2n hypothetically possible zones that correspond to some combination of inclusion or exclusion in each of the component sets. Euler diagrams contain only the actually possible zones in a given context. In Venn diagrams, a shaded zone may represent an empty zone, whereas in an Euler diagram the corresponding zone is missing from the diagram. For example, if one set represents dairy products and another cheeses, the Venn diagram contains a zone for cheeses that are not dairy products. Assuming that in the context cheese means some type of dairy product, the Euler diagram has the cheese zone entirely contained within the dairy-product zone—there is no zone for (non-existent) non-dairy cheese. This means that as the number of contours increases, Euler diagrams are typically less visually complex than the equivalent Venn diagram, particularly if the number of non-empty intersections is small.[13]
The difference between Euler and Venn diagrams can be seen in the following example. Take the three sets:


The Venn and the Euler diagram of those sets are:
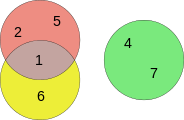 Euler diagram
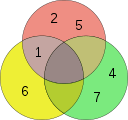 Venn diagram
Extensions to higher numbers of sets
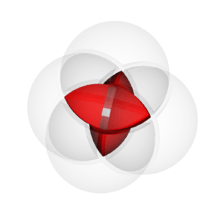
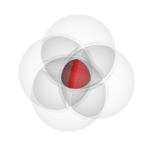
Venn diagrams typically represent two or three sets, but there are forms that allow for higher numbers. Shown below, four intersecting spheres form the highest order Venn diagram that has the symmetry of a simplex and can be visually represented. The 16 intersections correspond to the vertices of a tesseract (or the cells of a 16-cell respectively).
 |

|

|
|
 |
For higher numbers of sets, some loss of symmetry in the diagrams is unavoidable. Venn was keen to find "symmetrical figures...elegant in themselves,"[6] that represented higher numbers of sets, and he devised an elegant four-set diagram using ellipses (see below). He also gave a construction for Venn diagrams for any number of sets, where each successive curve that delimits a set interleaves with previous curves, starting with the three-circle diagram.
 Venn's construction for 4 sets
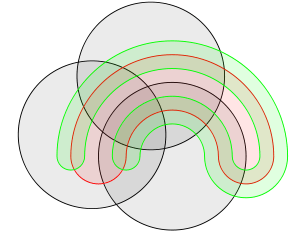 Venn's construction for 5 sets
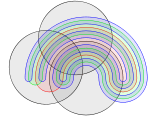 Venn's construction for 6 sets
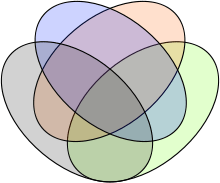 Venn's four-set diagram using ellipses
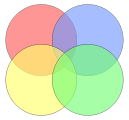 Non-example: This Euler diagram is not a Venn diagram for four sets as it has only 13 regions (excluding the outside); there is no region where only the yellow and blue, or only the red and green circles meet.
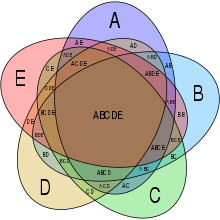 Five-set Venn diagram using congruent ellipses in a 5-fold rotationally symmetrical arrangement devised by Branko Grünbaum. Labels have been simplified for greater readability; for example, A denotes A ∩ Bc ∩ Cc ∩ Dc ∩ Ec, while BCE denotes Ac ∩ B ∩ C ∩ Dc ∩ E.
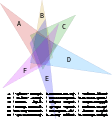 Six-set Venn diagram made of only triangles (interactive version)
Edwards–Venn diagrams
 Three sets
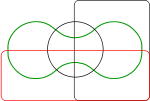 Four sets
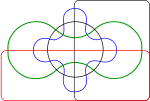 Five sets
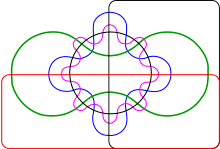 Six sets
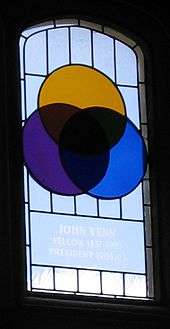
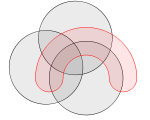
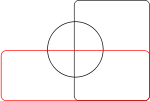
Anthony William Fairbank Edwards constructed a series of Venn diagrams for higher numbers of sets by segmenting the surface of a sphere, which became known as Edwards–Venn diagrams.[14] For example, three sets can be easily represented by taking three hemispheres of the sphere at right angles (x = 0, y = 0 and z = 0). A fourth set can be added to the representation by taking a curve similar to the seam on a tennis ball, which winds up and down around the equator, and so on. The resulting sets can then be projected back to a plane to give cogwheel diagrams with increasing numbers of teeth, as shown here. These diagrams were devised while designing a stained-glass window in memory of Venn.[14]
Other diagrams
Edwards–Venn diagrams are topologically equivalent to diagrams devised by Branko Grünbaum, which were based around intersecting polygons with increasing numbers of sides. They are also two-dimensional representations of hypercubes.
Henry John Stephen Smith devised similar n-set diagrams using sine curves[14] with the series of equations

Charles Lutwidge Dodgson (aka Lewis Carroll) devised a five-set diagram known as Carroll's square.
Related concepts
Venn diagrams correspond to truth tables for the propositions , , etc., in the sense that each region of Venn diagram corresponds to one row of the truth table.[15][16] This type is also known as Johnston diagram. Another way of representing sets is with John F. Randolph's R-diagrams.


See also
- Existential graph (by Charles Sanders Peirce)
- Logical connectives
- Spherical octahedron – A stereographic projection of a regular octahedron makes a 3-set Venn diagram, as 3 orthogonal great circles, each dividing space into two halves.
- Marquand diagram (and as further derivation Veitch chart and Karnaugh map)
Notes
- ↑ In Euler's Lettres à une princesse d'Allemagne sur divers sujets de physique et de philosophie [Letters to a German Princess on various physical and philosophical subjects] (Saint Petersburg, Russia: l'Academie Impériale des Sciences, 1768), volume 2, pages 95-126. In Venn's article, however, he suggests that the diagrammatic idea predates Euler, and is attributable to Christian Weise or Johann Christian Lange (in Lange's book Nucleus Logicae Weisianae (1712)).
References
- 1 2 Venn, John (July 1880). "I. On the Diagrammatic and Mechanical Representation of Propositions and Reasonings" (PDF). The London, Edinburgh, and Dublin Philosophical Magazine and Journal of Science. 5. Taylor & Francis. 10 (59): 1–18. doi:10.1080/14786448008626877. Archived (PDF) from the original on 2017-05-16.
- 1 2 Venn, John (1880). "On the employment of geometrical diagrams for the sensible representations of logical propositions". Proceedings of the Cambridge Philosophical Society. 4: 47–59.
- 1 2 Sandifer, Ed (2003). "How Euler Did It" (pdf). MAA Online. The Mathematical Association of America (MAA). Retrieved 2009-10-26.
- 1 2 Ruskey, Frank; Weston, Mark (2005-06-18). "A Survey of Venn Diagrams". The Electronic Journal of Combinatorics.
- 1 2 3 Lewis, Clarence Irving (1918). A Survey of Symbolic Logic. Berkeley: University of California Press.
- 1 2 Venn, John (1881). Symbolic logic. Macmillan. p. 108. Retrieved 2013-04-09.
- ↑ Mac Queen, Gailand (October 1967). The Logic Diagram (PDF) (Thesis). McMaster University. Archived from the original (PDF) on 2017-04-14. Retrieved 2017-04-14. (NB. Has a detailed history of the evolution of logic diagrams including but not limited to the Venn diagram.)
- ↑ Leibniz, Gottfried Wilhelm (1903) [ca. 1690]. "De Formae Logicae per linearum ductus". In Couturat, Louis. Opuscules et fragmentes inedits de Leibniz (in Latin). pp. 292–321.
- ↑ Baron, Margaret E. (May 1969). "A Note on The Historical Development of Logic Diagrams". The Mathematical Gazette. 53 (384): 113–125. doi:10.2307/3614533. JSTOR 3614533.
- ↑ Henderson, D. W. (April 1963). "Venn diagrams for more than four classes". American Mathematical Monthly. 70 (4): 424–6. doi:10.2307/2311865. JSTOR 2311865.
- ↑ Ruskey, Frank; Savage, Carla D.; Wagon, Stan (December 2006). "The Search for Simple Symmetric Venn Diagrams" (PDF). Notices of the AMS. 53 (11): 1304–11.
- ↑ "Strategies for Reading Comprehension Venn Diagrams". Archived from the original on 2009-04-29. Retrieved 2009-06-20.
- ↑ "Euler Diagrams 2004: Brighton, UK: September 22–23". Reasoning with Diagrams project, University of Kent. 2004. Retrieved 2008-08-13.
- 1 2 3 Edwards, Anthony William Fairbank (2004), Cogwheels of the Mind: The Story of Venn Diagrams, Baltimore, Maryland, USA: Johns Hopkins University Press, p. 65, ISBN 0-8018-7434-3 .
- ↑ Grimaldi, Ralph P. (2004). Discrete and combinatorial mathematics. Boston: Addison-Wesley. p. 143. ISBN 0-201-72634-3.
- ↑ Johnson, D. L. (2001). "3.3 Laws". Elements of logic via numbers and sets. Springer Undergraduate Mathematics Series. Berlin, Germany: Springer-Verlag. p. 62. ISBN 3-540-76123-3.
Further reading
- Mahmoodian, Ebadollah S.; Rezaie, M.; Vatan, F. (March 1987). "Generalization of Venn Diagram" (PDF). Eighteenth Annual Iranian Mathematics Conference. Tehran and Isfahan, Iran. Archived (PDF) from the original on 2017-05-01. Retrieved 2017-05-01.
- Edwards, Anthony William Fairbank (1989-01-07). "Venn diagrams for many sets". New Scientist. 121 (1646): 51–56.
- Watkinson, John (1990). "4.10. Hamming distance". Coding for Digital Recording. Stoneham, MA, USA: Focal Press. pp. 94–99, foldout in backsleeve. ISBN 0-240-51293-6. ISBN 978-0-240-51293-8. (NB. The book comes with a 3-page foldout of a seven-bit cylindrical Venn diagram.)
- Stewart, Ian (June 2003) [1992]. "Chapter 4. Cogwheels of the Mind". Another Fine Math You've Got Me Into (reprint of 1st ed.). Mineola, New York, USA: Dover Publications, Inc. (W. H. Freeman). pp. 51–64. ISBN 0-486-43181-9.
- Glassner, Andrew (2004). "Venn and Now". Morphs, Mallards, and Montages: Computer-Aided Imagination. Wellesley, MA, USA: A. K. Peters. pp. 161–184. ISBN 978-1568812311.
- Mamakani, Khalegh; Ruskey, Frank (2012-07-27). "A New Rose: The First Simple Symmetric 11-Venn Diagram". pp. 6452. arXiv:1207.6452. Bibcode:2012arXiv1207.6452M. Archived from the original on 2017-05-01. Retrieved 2017-05-01.
External links
| Wikimedia Commons has media related to Venn diagrams. |
- Hazewinkel, Michiel, ed. (2001) [1994], "Venn diagram", Encyclopedia of Mathematics, Springer Science+Business Media B.V. / Kluwer Academic Publishers, ISBN 978-1-55608-010-4
- Weisstein, Eric W. "Venn Diagram". MathWorld.
- Lewis Carroll's Logic Game – Venn vs. Euler at Cut-the-knot
- Six sets Venn diagrams made from triangles
| Axioms | 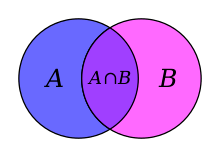 | |
|---|---|---|
| Operations | ||
| ||
| Set types | ||
| Theories | ||
| ||
| Set theorists | ||