Karnaugh map

The Karnaugh map (KM or K-map) is a method of simplifying Boolean algebra expressions. Maurice Karnaugh introduced it in 1953[1][2] as a refinement of Edward Veitch's 1952 Veitch chart,[3][4] which actually was a rediscovery of Allan Marquand's 1881 logical diagram[5] aka Marquand diagram[4] but with a focus now set on its utility for switching circuits.[4] Veitch charts are therefore also known as Marquand–Veitch diagrams,[4] and Karnaugh maps as Karnaugh–Veitch maps (KV maps).
The Karnaugh map reduces the need for extensive calculations by taking advantage of humans' pattern-recognition capability.[1] It also permits the rapid identification and elimination of potential race conditions.
The required Boolean results are transferred from a truth table onto a two-dimensional grid where, in Karnaugh maps, the cells are ordered in Gray code,[6][4] and each cell position represents one combination of input conditions, while each cell value represents the corresponding output value. Optimal groups of 1s or 0s are identified, which represent the terms of a canonical form of the logic in the original truth table.[7] These terms can be used to write a minimal Boolean expression representing the required logic.
Karnaugh maps are used to simplify real-world logic requirements so that they can be implemented using a minimum number of physical logic gates. A sum-of-products expression can always be implemented using AND gates feeding into an OR gate, and a product-of-sums expression leads to OR gates feeding an AND gate.[8] Karnaugh maps can also be used to simplify logic expressions in software design. Boolean conditions, as used for example in conditional statements, can get very complicated, which makes the code difficult to read and to maintain. Once minimised, canonical sum-of-products and product-of-sums expressions can be implemented directly using AND and OR logic operators.[9] Diagrammatic and mechanical methods for minimizing simple logic expressions have existed since at least the medieval times. More systematic methods for minimizing complex expressions began to be developed in the early 1950s, but until the mid to late 1980's the Karnaugh map was the most common used in practice.[10]
Example
Karnaugh maps are used to facilitate the simplification of Boolean algebra functions. For example, consider the Boolean function described by the following truth table.
| A | B | C | D | ||
|---|---|---|---|---|---|
| 0 | 0 | 0 | 0 | 0 | 0 |
| 1 | 0 | 0 | 0 | 1 | 0 |
| 2 | 0 | 0 | 1 | 0 | 0 |
| 3 | 0 | 0 | 1 | 1 | 0 |
| 4 | 0 | 1 | 0 | 0 | 0 |
| 5 | 0 | 1 | 0 | 1 | 0 |
| 6 | 0 | 1 | 1 | 0 | 1 |
| 7 | 0 | 1 | 1 | 1 | 0 |
| 8 | 1 | 0 | 0 | 0 | 1 |
| 9 | 1 | 0 | 0 | 1 | 1 |
| 10 | 1 | 0 | 1 | 0 | 1 |
| 11 | 1 | 0 | 1 | 1 | 1 |
| 12 | 1 | 1 | 0 | 0 | 1 |
| 13 | 1 | 1 | 0 | 1 | 1 |
| 14 | 1 | 1 | 1 | 0 | 1 |
| 15 | 1 | 1 | 1 | 1 | 0 |

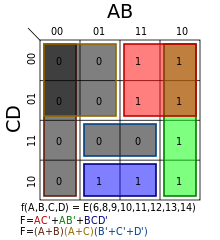
Following are two different notations describing the same function in unsimplified Boolean algebra, using the Boolean variables A, B, C, D, and their inverses.
- where are the minterms to map (i.e., rows that have output 1 in the truth table).
- where are the maxterms to map (i.e., rows that have output 0 in the truth table).


Karnaugh map


1)In this time the four input variables can be combined in 16 different ways, so the truth table has 16 rows, and the K-map has 16 positions. The K-map is therefore arranged in a 4 × 4 grid.
The row and column indices (shown across the top, and down the left side of the Karnaugh map) are ordered in Gray code rather than binary numerical order. Gray code ensures that only one variable changes between each pair of adjacent cells. Each cell of the completed Karnaugh map contains a binary digit representing the function's output for that combination ofÀ inputs.
After the Karnaugh map has been constructed, it is used to find one of the simplest possible forms — a canonical form — for the information in the truth table. Adjacent 1s in the Karnaugh map represent opportunities to simplify the expression. The minterms ('minimal terms') for the final expression are found by encircling groups of 1s in the map. Minterm groups must be rectangular and must have an area that is a power of two (i.e., 1, 2, 4, 8…). Minterm rectangles should be as large as possible without containing any 0s. Groups may overlap in order to make each one larger. The optimal groupings in the example below are marked by the green, red and blue lines, and the red and green groups overlap. The red group is a 2 × 2 square, the green group is a 4 × 1 rectangle, and the overlap area is indicated in brown.
The cells are often denoted by a shorthand which describes the logical value of the inputs that the cell covers. For example, AD would mean a cell which covers the 2x2 area where A and D are true, i.e. the cells numbered 13, 9, 15, 11 in the diagram above. On the other hand, AD would mean the cells where A is true and D is false (that is, D is true).
The grid is toroidally connected, which means that rectangular groups can wrap across the edges (see picture). Cells on the extreme right are actually 'adjacent' to those on the far left, in the sense that the corresponding input values only differ by one bit's; similarly, so are those at the very top and those at the bottom. Therefore, AD can be a valid term—it includes cells 12 and 8 at the top, and wraps to the bottom to include cells 10 and 14—as is B, D, which includes the four corner.
Solution
Once the Karnaugh map has been constructed and the adjacent 1s linked by rectangular and square boxes, the algebraic minterms can be found by examining which variables stay the same within each box.
For the red grouping:
- A is the same and is equal to 1 throughout the box, therefore it should be included in the algebraic representation of the red minterm.
- B does not maintain the same state (it shifts from 1 to 0), and should therefore be excluded.
- C does not change. It is always 0, so its complement, NOT-C, should be included. Thus, C should be included.
- D changes, so it is excluded.
Thus the first minterm in the Boolean sum-of-products expression is AC.
For the green grouping, A and B maintain the same state, while C and D change. B is 0 and has to be negated before it can be included. The second term is therefore AB. Note that it is acceptable that the green grouping overlaps with the red one.
In the same way, the blue grouping gives the term BCD.
The solutions of each grouping are combined: the normal form of the circuit is .

Thus the Karnaugh map has guided a simplification of

It would also have been possible to derive this simplification by carefully applying the axioms of boolean algebra, but the time it takes to do that grows exponentially with the number of terms.
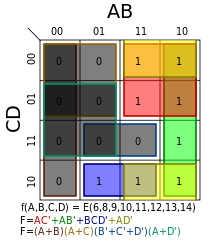
Inverse
The inverse of a function is solved in the same way by grouping the 0s instead.
The three terms to cover the inverse are all shown with grey boxes with different colored borders:
- brown: A, B
- gold: A, C
- blue: BCD
This yields the inverse:

Through the use of De Morgan's laws, the product of sums can be determined:

Don't cares
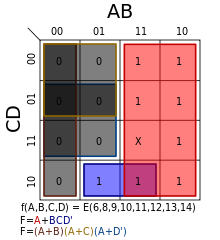
Karnaugh maps also allow easy minimizations of functions whose truth tables include "don't care" conditions. A "don't care" condition is a combination of inputs for which the designer doesn't care what the output is. Therefore, "don't care" conditions can either be included in or excluded from any rectangular group, whichever makes it larger. They are usually indicated on the map with a dash or X.
The example on the right is the same as the example above but with the value of f(1,1,1,1) replaced by a "don't care". This allows the red term to expand all the way down and, thus, removes the green term completely.
This yields the new minimum equation:

Note that the first term is just A, not AC. In this case, the don't care has dropped a term (the green rectangle); simplified another (the red one); and removed the race hazard (removing the yellow term as shown in the following section on race hazards).
The inverse case is simplified as follows:

Race hazards
Elimination
Karnaugh maps are useful for detecting and eliminating race conditions. Race hazards are very easy to spot using a Karnaugh map, because a race condition may exist when moving between any pair of adjacent, but disjoint, regions circumscribed on the map. However, because of the nature of Gray coding, adjacent has a special definition explained above – we're in fact moving on a torus, rather than a rectangle, wrapping around the top, bottom, and the sides.
- In the example above, a potential race condition exists when C is 1 and D is 0, A is 1, and B changes from 1 to 0 (moving from the blue state to the green state). For this case, the output is defined to remain unchanged at 1, but because this transition is not covered by a specific term in the equation, a potential for a glitch (a momentary transition of the output to 0) exists.
- There is a second potential glitch in the same example that is more difficult to spot: when D is 0 and A and B are both 1, with C changing from 1 to 0 (moving from the blue state to the red state). In this case the glitch wraps around from the top of the map to the bottom.
Whether glitches will actually occur depends on the physical nature of the implementation, and whether we need to worry about it depends on the application. In clocked logic, it is enough that the logic settles on the desired value in time to meet the timing deadline. In our example, we are not considering clocked logic.
In our case, an additional term of would eliminate the potential race hazard, bridging between the green and blue output states or blue and red output states: this is shown as the yellow region (which wraps around from the bottom to the top of the right half) in the adjacent diagram.

The term is redundant in terms of the static logic of the system, but such redundant, or consensus terms, are often needed to assure race-free dynamic performance.
Similarly, an additional term of must be added to the inverse to eliminate another potential race hazard. Applying De Morgan's laws creates another product of sums expression for f, but with a new factor of .


2-variable map examples
The following are all the possible 2-variable, 2 × 2 Karnaugh maps. Listed with each is the minterms as a function of and the race hazard free (see previous section) minimum equation. A minterm is defined as an expression that gives the most minimal form of expression of the mapped variables. All possible horizontal and vertical interconnected blocks can be formed. These blocks must be of the size of the powers of 2 (1, 2, 4, 8, 16, 32, ...). These expressions create a minimal logical mapping of the minimal logic variable expressions for the binary expressions to be mapped. Here are all the blocks with one field.

A block can be continued across the bottom, top, left, or right of the chart. That can even wrap beyond the edge of the chart for variable minimization. This is because each logic variable corresponds to each vertical column and horizontal row. A visualization of the k-map can be considered cylindrical. The fields at edges on the left and right are adjacent, and the top and bottom are adjacent. K-Maps for four variables must be depicted as a donut or torus shape. The four corners of the square drawn by the k-map are adjacent. Still more complex maps are needed for 5 variables and more.
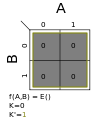 Σm(0); K = 0
 Σm(1); K = A′B′
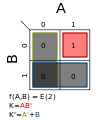 Σm(2); K = AB′
 Σm(3); K = A′B
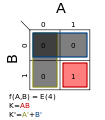 Σm(4); K = AB
 Σm(1,2); K = B′
 Σm(1,3); K = A′
 Σm(1,4); K = A′B′ + AB
 Σm(2,3); K = AB′ + A′B
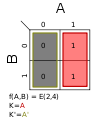 Σm(2,4); K = A
 Σm(3,4); K = B
 Σm(1,2,3); K = A' + B′
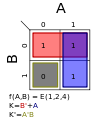 Σm(1,2,4); K = A + B′
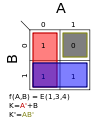 Σm(1,3,4); K = A′ + B
 Σm(2,3,4); K = A + B
 Σm(1,2,3,4); K = 1
Other graphical methods
Alternative graphical minimization methods include:
- Marquand diagram (1881) by Allan Marquand (1853–1924)[5][4]
- Harvard minimizing chart (1951) by Howard H. Aiken and Martha L. Whitehouse of the Harvard Computation Laboratory[11][1][12][2]
- Veitch chart (1952) by Edward Veitch (1924–2013)[3][4]
- Svoboda's graphical aids (1956) and triadic map by Antonín Svoboda (1907–1980)[13][14][15][16]
- Händler circle graph (aka Händler'scher Kreisgraph, Kreisgraph nach Händler, Händler-Kreisgraph, Händler-Diagramm, Minimisierungsgraph [sic]) (1958) by Wolfgang Händler (1920–1998)[17][18][19][15][20][21][22][23][24]
- Graph method (1965) by Herbert Kortum (1907–1979)[25][26][27][28][29][30][31]
See also
References
- 1 2 3 Karnaugh, Maurice (November 1953) [1953-04-23, 1953-03-17]. "The Map Method for Synthesis of Combinational Logic Circuits" (PDF). Transactions of the American Institute of Electrical Engineers part I. 72 (9): 593–599. doi:10.1109/TCE.1953.6371932. Paper 53-217. Archived (PDF) from the original on 2017-04-16. Retrieved 2017-04-16. (NB. Also contains a short review by Samuel H. Caldwell.)
- 1 2 Curtis, H. Allen (1962). A new approach to the design of switching circuits. Bell Laboratories Series. Princeton, New Jersey, USA: D. van Nostrand Company, Inc.
- 1 2 Veitch, Edward W. (1952-05-03) [1952-05-02]. "A Chart Method for Simplifying Truth Functions". ACM Annual Conference/Annual Meeting: Proceedings of the 1952 ACM Annual Meeting (Pittsburg). New York, USA: ACM: 127–133. doi:10.1145/609784.609801.
- 1 2 3 4 5 6 7 Brown, Frank Markham (2012) [2003, 1990]. Boolean Reasoning - The Logic of Boolean Equations (reissue of 2nd ed.). Mineola, New York: Dover Publications, Inc. ISBN 978-0-486-42785-0.
- 1 2 Marquand, Allan (1881). "XXXIII: On Logical Diagrams for n terms". The London, Edinburgh, and Dublin Philosophical Magazine and Journal of Science. 5. 12 (75): 266–270. doi:10.1080/14786448108627104. Retrieved 2017-05-15. (NB. Quite many secondary sources erroneously cite this work as "A logical diagram for n terms" or "On a logical diagram for n terms".)
- ↑ Wakerly, John F. (1994). Digital Design: Principles & Practices. New Jersey, USA: Prentice Hall. pp. 222, 48–49. ISBN 0-13-211459-3. (NB. The two page sections taken together say that K-maps are labeled with Gray code. The first section says that they are labeled with a code that changes only one bit between entries and the second section says that such a code is called Gray code.)
- ↑ Belton, David (April 1998). "Karnaugh Maps – Rules of Simplification". Archived from the original on 2017-04-18. Retrieved 2009-05-30.
- ↑ Dodge, Nathan B. (September 2015). "Simplifying Logic Circuits with Karnaugh Maps" (PDF). The University of Texas at Dallas, Erik Jonsson School of Engineering and Computer Science. Archived (PDF) from the original on 2017-04-18. Retrieved 2017-04-18.
- ↑ Cook, Aaron. "Using Karnaugh Maps to Simplify Code". Quantum Rarity. Archived from the original on 2017-04-18. Retrieved 2012-10-07.
- ↑ Wolfram, Stephen (2002). A New Kind of Science. Wolfram Media, Inc. p. 1097. ISBN 1-57955-008-8.
- ↑ Aiken, Howard H.; Blaauw, Gerrit; Burkhart, William; Burns, Robert J.; Cali, Lloyd; Canepa, Michele; Ciampa, Carmela M.; Coolidge, Jr., Charles A.; Fucarile, Joseph R.; Gadd, Jr., J. Orten; Gucker, Frank F.; Harr, John A.; Hawkins, Robert L.; Hayes, Miles V.; Hofheimer, Richard; Hulme, William F.; Jennings, Betty L.; Johnson, Stanley A.; Kalin, Theodore; Kincaid, Marshall; Lucchini, E. Edward; Minty, William; Moore, Benjamin L.; Remmes, Joseph; Rinn, Robert J.; Roche, John W.; Sanbord, Jacquelin; Semon, Warren L.; Singer, Theodore; Smith, Dexter; Smith, Leonard; Strong, Peter F.; Thomas, Helene V.; Wang, An; Whitehouse, Martha L.; Wilkins, Holly B.; Wilkins, Robert E.; Woo, Way Dong; Little, Elbert P.; McDowell, M. Scudder (1952) [January 1951]. "Chapter V: Minimizing charts". Synthesis of electronic computing and control circuits (second printing, revised ed.). Write-Patterson Air Force Base: Harvard University Press (Cambridge, Massachusetts, USA) / Geoffrey Cumberlege Oxford University Press (London). pp. preface, 50–67. Retrieved 2017-04-16.
[…] Martha Whitehouse constructed the minimizing charts used so profusely throughout this book, and in addition prepared minimizing charts of seven and eight variables for experimental purposes. […] Hence, the present writer is obliged to record that the general algebraic approach, the switching function, the vacuum-tube operator, and the minimizing chart are his proposals, and that he is responsible for their inclusion herein. […]
(NB. Work commenced in April 1948.) - ↑ Phister, Jr., Montgomery (1959) [December 1958]. Logical design of digital computers. New York, USA: John Wiley & Sons Inc. pp. 75–83. ISBN 0471688053.
- ↑ Svoboda, Antonín (1956). Graficko-mechanické pomůcky užívané při analyse a synthese kontaktových obvodů [Utilization of graphical-mechanical aids for the analysis and synthesis of contact circuits]. Stroje na zpracování informací [Symphosium IV on information processing machines] (in Czech). IV. Prague: Czechoslovak Academy of Sciences, Research Institute of Mathematical Machines. pp. 9–21.
- ↑ Svoboda, Antonín (1956). Graphical Mechanical Aids for the Synthesis of Relay Circuits. Nachrichtentechnische Fachberichte (NTF), Beihefte der Nachrichtentechnischen Zeitschrift (NTZ). Braunschweig, Germany: Vieweg-Verlag.
- 1 2 Steinbuch, Karl W.; Weber, Wolfgang; Heinemann, Traute, eds. (1974) [1967]. Taschenbuch der Informatik - Band II - Struktur und Programmierung von EDV-Systemen. Taschenbuch der Nachrichtenverarbeitung (in German). 2 (3 ed.). Berlin, Germany: Springer-Verlag. pp. 25, 62, 96, 122–123, 238. ISBN 3-540-06241-6. LCCN 73-80607.
- ↑ Svoboda, Antonín; White, Donnamaie E. (2016) [1979-08-01]. Advanced Logical Circuit Design Techniques (PDF) (retyped electronic reissue ed.). Garland STPM Press (original issue) / WhitePubs (reissue). ISBN 978-0-8240-7014-4. Archived (PDF) from the original on 2017-04-14. Retrieved 2017-04-15.
- ↑ Händler, Wolfgang (1958). Ein Minimisierungsverfahren zur Synthese von Schaltkreisen (Minimisierungsgraphen) (Dissertation) (in German). Technische Hochschule Darmstadt. D 17. (NB. Although written by a German, the title contains an anglicism; the correct German term would be "Minimierung" instead of "Minimisierung".)
- ↑ Händler, Wolfgang (2013) [1961]. "Zum Gebrauch von Graphen in der Schaltkreis- und Schaltwerktheorie". In Peschl, Ernst Ferdinand; Unger, Heinz. Colloquium über Schaltkreis- und Schaltwerk-Theorie - Vortragsauszüge vom 26. bis 28. Oktober 1960 in Bonn - Band 3 von Internationale Schriftenreihe zur Numerischen Mathematik [International Series of Numerical Mathematics] (ISNM) (in German). 3. Institut für Angewandte Mathematik, Universität Saarbrücken, Rheinisch-Westfälisches Institut für Instrumentelle Mathematik: Springer Basel AG / Birkhäuser Verlag Basel. pp. 169–198. doi:10.1007/978-3-0348-5770-3. ISBN 978-3-0348-5771-0.
- ↑ Berger, Erich R.; Händler, Wolfgang (1967) [1962]. Steinbuch, Karl W.; Wagner, Siegfried W., eds. Taschenbuch der Nachrichtenverarbeitung (in German) (2 ed.). Berlin, Germany: Springer-Verlag OHG. pp. 64, 1034–1035, 1036, 1038. LCCN 67-21079. Title No. 1036.
[…] Übersichtlich ist die Darstellung nach Händler, die sämtliche Punkte, numeriert nach dem Gray-Code […], auf dem Umfeld eines Kreises anordnet. Sie erfordert allerdings sehr viel Platz. […] [Händler's illustration, where all points, numbered according to the Gray code, are arranged on the circumference of a circle, is easily comprehensible. It needs, however, a lot of space.]
- ↑ Hotz, Günter (1974). Schaltkreistheorie [Switching circuit theory]. DeGruyter Lehrbuch (in German). Walter de Gruyter & Co. p. 117. ISBN 3-11-00-2050-5.
[…] Der Kreisgraph von Händler ist für das Auffinden von Primimplikanten gut brauchbar. Er hat den Nachteil, daß er schwierig zu zeichnen ist. Diesen Nachteil kann man allerdings durch die Verwendung von Schablonen verringern. […] [The circle graph by Händler is well suited to find prime implicants. A disadvantage is that it is difficult to draw. This can be remedied using stencils.]
- ↑ "Informatik Sammlung Erlangen (ISER)" (in German). Erlangen, Germany: Friedrich-Alexander Universität. 2012-03-13. Archived from the original on 2017-05-16. Retrieved 2017-04-12. (NB. Shows a picture of a Kreisgraph by Händler.)
- ↑ "Informatik Sammlung Erlangen (ISER) - Impressum" (in German). Erlangen, Germany: Friedrich-Alexander Universität. 2012-03-13. Archived from the original on 2012-02-26. Retrieved 2017-04-15. (NB. Shows a picture of a Kreisgraph by Händler.)
- ↑ Zemanek, Heinz (2013) [1990]. "Geschichte der Schaltalgebra" [History of circuit switching algebra]. In Broy, Manfred. Informatik und Mathematik [Computer Sciences and Mathematics] (in German). Springer-Verlag. pp. 43–72. ISBN 9783642766770.
Einen Weg besonderer Art, der damals zu wenig beachtet wurde, wies W. Händler in seiner Dissertation […] mit einem Kreisdiagramm. […]
(NB. Collection of papers at a colloquium held at the Bayerische Akademie der Wissenschaften, 1989-06-12/14, in honor of Friedrich L. Bauer.) - ↑ Bauer, Friedrich Ludwig; Wirsing, Martin (March 1991). Elementare Aussagenlogik (in German). Berlin / Heidelberg: Springer-Verlag. pp. 54–56, 71, 112–113, 138–139. ISBN 978-3-540-52974-3.
[…] handelt es sich um ein Händler-Diagramm […], mit den Würfelecken als Ecken eines 2m-gons. […] Abb. […] zeigt auch Gegenstücke für andere Dimensionen. Durch waagerechte Linien sind dabei Tupel verbunden, die sich nur in der ersten Komponente unterscheiden; durch senkrechte Linien solche, die sich nur in der zweiten Komponente unterscheiden; durch 45°-Linien und 135°-Linien solche, die sich nur in der dritten Komponente unterscheiden usw. Als Nachteil der Händler-Diagramme wird angeführt, daß sie viel Platz beanspruchen. […]
- ↑ Kortum, Herbert (1965). "Minimierung von Kontaktschaltungen durch Kombination von Kürzungsverfahren und Graphenmethoden" [Minimization of contact circuits by combination of reduction procedures and graphical methods]. messen-steuern-regeln (msr) (in German). Verlag Technik. 8 (12): 421–425. ISSN 0026-0347. CODEN MSRGAN.
- ↑ Kortum, Herbert (1966). "Konstruktion und Minimierung von Halbleiterschaltnetzwerken mittels Graphentransformation". messen-steuern-regeln (msr) (in German). Verlag Technik. 9 (1): 9–12. ISSN 0026-0347. CODEN MSRGAN.
- ↑ Kortum, Herbert (1966). "Weitere Bemerkungen zur Minimierung von Schaltnetzwerken mittels Graphenmethoden". messen-steuern-regeln (msr) (in German). Verlag Technik. 9 (3): 96–102. ISSN 0026-0347. CODEN MSRGAN.
- ↑ Kortum, Herbert (1966). "Weitere Bemerkungen zur Behandlung von Schaltnetzwerken mittels Graphen. Konstruktion von vermaschten Netzwerken (Brückenschaltungen)" [Further remarks on treatment of switching networks by means of graphs]. messen-steuern-regeln (msr) (in German). Verlag Technik. 9 (5): 151–157. ISSN 0026-0347. CODEN MSRGAN. Kortum, Herbert (1965). "Weitere Bemerkungen zur Behandlung von Schaltnetzwerken mittels Graphen" [Further remarks on treatment of switching networks by means of graphs]. Regelungstechnik (in German). 10. Internationales Wissenschaftliches Kolloquium, Ilmenau. Technische Hochschule. 10 (5): 33–39.
- ↑ Kortum, Herbert (1967). "Über zweckmäßige Anpassung der Graphenstruktur diskreter Systeme an vorgegebene Aufgabenstellungen". messen-steuern-regeln (msr) (in German). Verlag Technik. 10 (6): 208–211. ISSN 0026-0347. CODEN MSRGAN.
- ↑ Kortum, Herbert (1966). "Zur Minimierung von Schaltsystemen" [Minimization of switching circuits]. Wissenschaftliche Zeitschrift der TU Ilmenau (in German). Jena: Technische Hochschule für Elektrotechnik Ilmenau / Forschungsstelle für Meßtechnik und Automatisierung der Deutschen Akademie der Wissenschaften. 12 (2): 181–186.
- ↑ Tafel, Hans Jörg (1971). "4.3.5. Graphenmethode zur Vereinfachung von Schaltfunktionen". Written at RWTH, Aachen, Germany. Einführung in die digitale Datenverarbeitung [Introduction to digital information processing] (in German). Munich, Germany: Carl Hanser Verlag. pp. 98–105, 107–113. ISBN 3-446-10569-7.
Further reading
- Katz, Randy Howard (1998) [1994]. Contemporary Logic Design. The Benjamin/Cummings Publishing Company. pp. 70–85. doi:10.1016/0026-2692(95)90052-7. ISBN 0-8053-2703-7.
- Vingron, Shimon Peter (2004) [2003-11-05]. "Karnaugh Maps". Switching Theory: Insight Through Predicate Logic. Berlin, Heidelberg, New York: Springer-Verlag. pp. 57–76. ISBN 3-540-40343-4.
- Wickes, William E. (1968). Logic Design with Integrated Circuits. New York, USA: John Wiley & Sons. pp. 36–49. LCCN 68-21185.
A refinement of the Venn diagram in that circles are replaced by squares and arranged in a form of matrix. The Veitch diagram labels the squares with the minterms. Karnaugh assigned 1s and 0s to the squares and their labels and deduced the numbering scheme in common use.
- Maxfield, Clive "Max" (2006-11-29). "Reed-Muller Logic". Logic 101. EETimes. Part 3. Archived from the original on 2017-04-19. Retrieved 2017-04-19.
External links
- Detect Overlapping Rectangles, by Herbert Glarner.
- Using Karnaugh maps in practical applications, Circuit design project to control traffic lights.
- K-Map Tutorial for 2,3,4 and 5 variables
- Karnaugh Map Example
- POCKET–PC BOOLEAN FUNCTION SIMPLIFICATION, Ledion Bitincka — George E. Antoniou