Trincomalee District
| Trincomalee District திருகோணமலை மாவட்டம் ත්රිකුණාමළය දිස්ත්රික්කය | |
|---|---|
| Administrative District | |
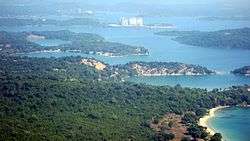 Trincomalee Bay | |
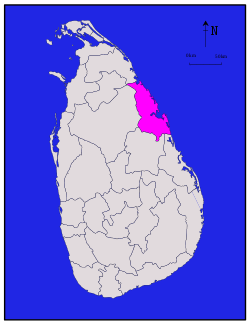 Location within Sri Lanka | |
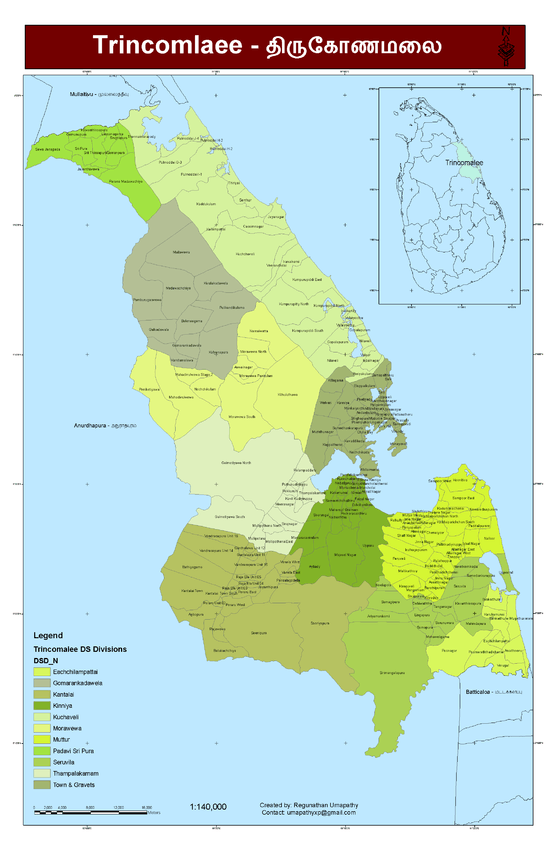 Administrative units of Trincomalee District in 2006 | |
| Coordinates: 08°35′N 81°05′E / 8.583°N 81.083°ECoordinates: 08°35′N 81°05′E / 8.583°N 81.083°E | |
| Country | Sri Lanka |
| Province | Eastern |
| Capital | Trincomalee |
| DS Division | |
| Government | |
| • District Secretary | Mr. H. A. A. Pushmakumara |
| • MPs |
List
|
| • MPCs |
List
|
| Area | |
| • Total | 2,727 km2 (1,053 sq mi) |
| • Land | 2,529 km2 (976 sq mi) |
| • Water | 198 km2 (76 sq mi) 7.26% |
| Area rank | 11th (4.16% of total area) |
| Population (2012 census)[1] | |
| • Total | 378,182 |
| • Rank | 21st (1.87% of total pop.) |
| • Density | 140/km2 (360/sq mi) |
| Ethnicity(2012 census)[1] | |
| • Moor | 163,982 (40.43%) |
| • Sri Lankan Tamil | 115,549 (30.55%) |
| • Sinhalese | 101,991 (26.97%) |
| • Indian Tamil | 6,531 (1.73%) |
| • Other | 1,257 (0.33%) |
| Religion(2012 census)[2] | |
| • Muslim | 166,200 (42.12%) |
| • Buddhist | 98,772 (26.12%) |
| • Hindu | 98,133 (25.95%) |
| • Christian | 21,892 (5.79%) |
| • Other | 134 (0.04%) |
| Time zone | UTC+05:30 (Sri Lanka) |
| Post Codes | 31000-31999 |
| Telephone Codes | 026 |
| ISO 3166 code | LK-53 |
| Vehicle registration | EP |
| Official Languages | Tamil, Sinhala |
| Website | Trincomalee District Secretariat |
Trincomalee District (Tamil: திருகோணமலை மாவட்டம் Tirukŏṇamalai Māvaṭṭam; Sinhalese: ත්රිකුණාමළය දිස්ත්රික්කය Trikuṇāmalaya distrikkaya) is one of the 25 districts of Sri Lanka, the second level administrative division of the country. The district is administered by a District Secretariat headed by a District Secretary (previously known as a Government Agent) appointed by the central government of Sri Lanka. The capital of the district is the city of Trincomalee.
Geography
Trincomalee District is located in the east of Sri Lanka in the Eastern Province. It has an area of 2,727 square kilometres (1,053 sq mi).[3]
Administrative units
Trincomalee District is divided into 11 Divisional Secretary's Division (DS Divisions), each headed by a Divisional Secretary (previously known as an Assistant Government Agent).[4] The DS Divisions are further sub-divided into 230 Grama Niladhari Divisions (GN Divisions).[4]
| DS Division | Main Town | Divisional Secretary | GN Divisions |
Area (km2) [5] |
Population (2012 Census)[6] | Population Density (/km2) | |||||
|---|---|---|---|---|---|---|---|---|---|---|---|
| Sri Lankan Moors | Sri Lankan Tamil | Sinhalese | Indian Tamil | Other | Total | ||||||
| Gomarankadawala | Gomarankadawala | S. M. C. Samarakoon | 10 | 288 | 1 | 25 | 7,313 | 0 | 0 | 7,339 | 25 |
| Kantalai | Kantalai | K. Premadasha | 23 | 404 | 5,108 | 1,534 | 37,448 | 2,478 | 73 | 46,641 | 115 |
| Kinniya | Kinniya | M. A. Anas | 31 | 165 | 58,447 | 2,522 | 19 | 3,445 | 18 | 64,451 | 391 |
| Kuchchaveli | Kuchchaveli | P. Thaneswaran | 24 | 438 | 21,307 | 10,553 | 1,193 | 40 | 7 | 33,100 | 76 |
| Morawewa (Muthalikkulam) | Morawewa | W. M. Bathiya Vijayantha | 10 | 329 | 1,300 | 888 | 5,750 | 3 | 5 | 7,946 | 24 |
| Muttur | Muttur | V. Yoosuf | 42 | 195 | 34,984 | 20,935 | 444 | 4 | 12 | 56,379 | 289 |
| Padavi Siripura | Siripura | V. P. S. Jinadrasena | 10 | 152 | 1 | 10 | 11,846 | 0 | 1 | 11,858 | 78 |
| Seruvila | Seruvila | P. R. Jayarathna | 17 | 311 | 2,426 | 1,816 | 9,293 | 3 | 8 | 13,546 | 44 |
| Thampalakamam (Thambalagamuwa) | Thampalakamam | J. Sripathy | 12 | 226 | 16,164 | 4,701 | 7,476 | 0 | 15 | 28,356 | 125 |
| Trincomalee Town & Gravets | Trincomalee | J.H.Arulraj | 42 | 148 | 13,113 | 61,282 | 21,179 | 546 | 1,114 | 97,234 | 657 |
| Verugal & Eachchalampattu | Verugal | P. Thanesvaran | 9 | 71 | 3 | 11,283 | 30 | 12 | 4 | 11,332 | 160 |
| Total | 230 | 2,727 | 152,854 | 115,549 | 101,991 | 6,531 | 1,257 | 378,182 | 139 | ||
Demographics
Population
Trincomalee District's population was 378,182 in 2012.[1]
The population of the district, like the rest of the east and north, has been heavily affected by the civil war. The war killed an estimated 100,000 people.[7] Several hundred thousand Sri Lankan Tamils, possibly as much as one million, emigrated to the West during the war.[8] Many Sri Lankan Tamils also moved to the relative safety of the capital Colombo. The war also caused many people from all ethnic and religious groups who lived in the district to flee to other parts of Sri Lanka, though most of them have returned to the district since the end of the civil war.
Ethnicity
| Year | Muslim[lower-alpha 1] | Tamil[lower-alpha 2] | Sinhalese | Other | Total No. | ||||
|---|---|---|---|---|---|---|---|---|---|
| No. | % | No. | % | No. | % | No. | % | ||
| 1827 | 3,245 | 16.94% | 15,663 | 81.76% | 250 | 1.30% | 0 | 0.00% | 19,158 |
| 1881 Census | 5,746 | 25.89% | 14,304 | 64.44% | 935 | 4.21% | 1,212 | 5.46% | 22,197 |
| 1891 Census | 6,426 | 24.96% | 17,117 | 66.49% | 1,105 | 4.29% | 1,097 | 4.26% | 25,745 |
| 1901 Census | 8,258 | 29.04% | 17,060 | 59.98% | 1,203 | 4.23% | 1,920 | 6.75% | 28,441 |
| 1911 Census | 9,700 | 32.60% | 17,233 | 57.92% | 1,138 | 3.82% | 1,684 | 5.66% | 29,755 |
| 1921 Census | 12,846 | 37.66% | 18,580 | 54.47% | 1,501 | 4.40% | 1,185 | 3.47% | 34,112 |
| 1946 Census | 23,219 | 30.58% | 33,795 | 44.51% | 11,606 | 15.29% | 7,306 | 9.62% | 75,926 |
| 1953 Census | 28,616 | 34.10% | 37,517 | 44.71% | 15,296 | 18.23% | 2,488 | 2.96% | 83,917 |
| 1963 Census | 40,775 | 29.43% | 54,452 | 39.30% | 39,925 | 28.82% | 3,401 | 2.45% | 138,553 |
| 1971 Census | 59,924 | 31.83% | 71,749 | 38.11% | 54,744 | 29.08% | 1,828 | 0.97% | 188,245 |
| 1981 Census | 75,039 | 29.32% | 93,132 | 36.39% | 85,503 | 33.41% | 2,274 | 0.89% | 255,948 |
| 2001 Census[lower-alpha 3] | n/a | n/a | n/a | n/a | n/a | n/a | n/a | n/a | n/a |
| 2007 Enumeration | 151,692 | 45.37% | 96,142 | 28.75% | 84,766 | 25.35% | 1,763 | 0.53% | 334,363 |
| 2012 Census | 152,854 | 40.42% | 122,080 | 32.29% | 101,991 | 26.97% | 1,257 | 0.33% | 378,182 |
Religion
| Year | Muslim | Buddhist | Hindu | Christian[lower-alpha 4] | Others | Total No. | |||||
|---|---|---|---|---|---|---|---|---|---|---|---|
| No. | % | No. | % | No. | % | No. | % | No. | % | ||
| 1981 Census | 76,404 | 29.85% | 82,602 | 32.27% | 80,843 | 31.59% | 15,583 | 6.09% | 516 | 0.20% | 255,948 |
| 2012 Census | 159,2516 | 42.11% | 98,772 | 26.12% | 98,133 | 25.95% | 21,892 | 5.79% | 134 | 0.04% | 378,182 |
Politics and government
Local government
Trincomalee District has 13 local authorities of which two are Urban Councils and the remaining 11 are Divisional Councils (Pradesha Sabhai or Pradeshiya Sabha).[12]
| Local Authority | Area | Population | Registered Electors (2011) |
Elected Members (2011) | ||||
|---|---|---|---|---|---|---|---|---|
| UPFA | TNA | UNP | Other | Total | ||||
| Gomarankadawala Divisional Council | 5,831 | 8 | 0 | 1 | 0 | 9 | ||
| Kantalai Divisional Council | 397.3 | 48,632 | 30,898 | 8 | 0 | 3 | 0 | 11 |
| Kinniya Divisional Council | 16,626 | 5 | 0 | 2 | 0 | 7 | ||
| Kinniya Urban Council | 9.5 | 44,034 | 21,069 | 5 | 0 | 1 | 1 | 7 |
| Kuchchaveli Divisional Council | 333.3 | 29,967 | 20,872 | 6 | 2 | 1 | 0 | 9 |
| Morawewa Divisional Council | 116.0 | 10,000 | 8,659 | 6 | 0 | 3 | 0 | 9 |
| Muttur Divisional Council | 179.4 | 60,000 | 37,731 | 7 | 3 | 1 | 0 | 11 |
| Padavi Siripura Divisional Council | 217.1 | 13,000 | 8,362 | 6 | 0 | 1 | 2 | 9 |
| Seruvila Divisional Council | 277.0 | 13,886 | 9,130 | 7 | 1 | 1 | 0 | 9 |
| Thampalakamam Divisional Council | 244.0 | 33,967 | 17,125 | 6 | 0 | 3 | 0 | 9 |
| Trincomalee Town and Gravets Divisional Council | 31,791 | 3 | 5 | 1 | 0 | 9 | ||
| Trincomalee Urban Council | 7.5 | 101,958 | 31,927 | 2 | 8 | 1 | 1 | 12 |
| Verugal Divisional Council | 5,894 | 1 | 5 | 0 | 1 | 7 | ||
| Total | 245,915 | 70 | 24 | 19 | 5 | 118 | ||
Notes
- ↑ Sri Lankan Moors and Indian Moors.
- ↑ Sri Lankan Tamil and Indian Tamil.
- ↑ 2001 Census was only carried out partially in Trincomalee District.
- ↑ Roman Catholic and Other Christian.
References
- 1 2 3 4 "A2 : Population by ethnic group according to districts, 2012". Census of Population & Housing, 2011. Department of Census & Statistics, Sri Lanka.
- 1 2 "A3 : Population by religion according to districts, 2012". Census of Population & Housing, 2011. Department of Census & Statistics, Sri Lanka.
- ↑ "Area of Sri Lanka by province and district" (PDF). Statistical Abstract 2011. Department of Census & Statistics, Sri Lanka. Archived from the original (PDF) on 2012-11-13.
- 1 2 "Overview". Trincomalee District Secretariat.
- ↑ "Land area by province, district and divisional secretariat division" (PDF). Statistical Abstract 2011. Department of Census & Statistics, Sri Lanka. Archived from the original (PDF) on 2013-12-15.
- ↑ "A6 : Population by ethnicity and district according to Divisional Secretary's Division, 2012". Census of Population & Housing, 2011. Department of Census & Statistics, Sri Lanka.
- ↑ "Up to 100,000 killed in Sri Lanka's civil war: UN". ABC News (Australia). 20 May 2009.
- ↑ Harrison, Frances (23 July 2003). "Twenty years on - riots that led to war". BBC News.
- ↑ "Special Enumeration 2007, Trincomalee" (PDF). Department of Census & Statistics, Sri Lanka.
- ↑ "Demographic Changes by the LTTE Peace Secretariat, April 2008" (PDF). Sangam.
- ↑ "Population by religion and district, Census 1981, 2001" (PDF). Statistical Abstract 2011. Department of Census & Statistics, Sri Lanka. Archived from the original (PDF) on 2013-12-15.
- ↑ "Local Authorities". Trincomalee District Secretariat.
External links
| Wikimedia Commons has media related to Trincomalee District. |