Graph of a function
In mathematics, the graph of a function f is, formally, the set of all ordered pairs (x, f(x)), such that x is in the domain of the function f, and, in practice, the graphical representation of this set. If the function input x, and the values f(x), are real numbers, the graph is a two-dimensional graph, and, for a continuous function, is a curve. If the function input x is an ordered pair (x1, x2) of real numbers, the graph is the collection of all pairs ((x1, x2), f(x1, x2)). These pairs can be identified with the ordered triples (x1, x2, f(x1, x2)). For a continuous function the graph of such a function is a surface.
The concept of the graph of a function is generalized to the graph of a relation. To test whether a graph of a relation represents a function of the first variable x, one uses the vertical line test. To test whether a graph represents a function of the second variable y, one uses the horizontal line test. If the function has an inverse, the graph of the inverse can be found by reflecting the graph of the original function over the line y = x.
In science, engineering, technology, finance, and other areas, graphs are tools used for many purposes. In the simplest case one variable is plotted as a function of another, typically using rectangular axes; see Plot (graphics) for details.
In the modern foundations of mathematics, and, typically, in set theory, a function and its graph are the same thing.[1] However, it is often useful to see functions as mappings[2], which consist not only of the relation between input and output, but also on which set is the domain, and which set is the co-domain. For example, to say that a function is onto (surjective) or not the co-domain should be taken into account. The graph of a function on its own doesn't determine the co-domain. It is common[3] to use both words, function and graph of a function, since even if considered the same object, they indicate viewing it from a different angle.
_%3D_x%5E3_%E2%88%92_9x.PNG)
Definition
Given a mapping , in other words a function together with its domain and co-domain , the graph of the mapping is[4] the set


- ,

which is a subset of . The graph of the function is the same set , which is, in the abstract definition of a function, the same as itself.


Examples
Functions of one variable
The graph of the function defined by


is the set the subset of


From the graph, the domain is recovered as the set of first component of each pair in the graph . Similarly, the range can be recovered as . The codomain , however, cannot be determined from the graph alone.


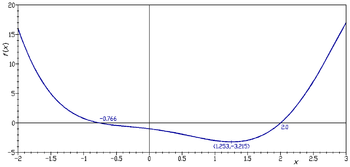
The graph of the cubic polynomial on the real line

is

If this set is plotted on a Cartesian plane, the result is a curve (see figure).
Functions of two variables
%3D%E2%88%92((cosx)%5E2_%2B_(cosy)%5E2)%5E2.PNG)
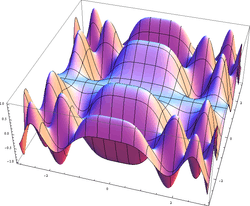
The graph of the trigonometric function

is

If this set is plotted on a three dimensional Cartesian coordinate system, the result is a surface (see figure).
Oftentimes it is helpful to show with the graph, the gradient of the function and several level curves. The level curves can be mapped on the function surface or can be projected on the bottom plane. The second figure shows such a drawing of the graph of the function:

Generalizations
The graph of a function is contained in a Cartesian product of sets. An X–Y plane is a cartesian product of two lines, called X and Y, while a cylinder is a cartesian product of a line and a circle, whose height, radius, and angle assign precise locations of the points. Fibre bundles are not Cartesian products, but appear to be up close. There is a corresponding notion of a graph on a fibre bundle called a section.
Tools for plotting function graphs
Hardware
Software
See also
References
- ↑ Charles C Pinter (2014) [1971]. A Book of Set Theory. Dover Publications. p. 49. ISBN 978-0-486-79549-2.
- ↑ T. M. Apostol (1981). Mathematical Analysis. Addison-Wesley. p. 35.
- ↑ P. R. Halmos (1982). A Hilbert Space Problem Book. Springer-Verlag. p. 31. ISBN 0-387-90685-1.
- ↑ D. S. Bridges (1991). Foundations of Real and Abstract Analysis. Springer. p. 285. ISBN 0-387-98239-6.
External links
| Wikimedia Commons has media related to Function plots. |
- Weisstein, Eric W. "Function Graph." From MathWorld—A Wolfram Web Resource.