Spokane–Coeur d'Alene combined statistical area
| Spokane–Coeur d'Alene Combined Statistical Area | |
|---|---|
| Spokane–Spokane Valley–Coeur d'Alene | |
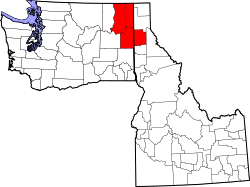 A map of the Spokane–Coeur d'Alene CSA in the U.S. states of Idaho and Washington. | |
| Country | United States |
| State(s) | Washington & Idaho |
| Largest city | Spokane (217,300) |
| Other cities |
- Spokane Valley (96,340) - Coeur d'Alene (50,285) - Post Falls (31,865) - Hayden (14,344) - Cheney (12,237) - Liberty Lake (9,910) - Rathdrum (6,826) - Airway Heights (6,672) - Dalton Gardens (2,335) - Huetter (111) - Stateline (44) |
| Area | |
| • Total | 6,885.7 sq mi (17,834 km2) |
| Highest elevation | 7,320 ft (2,230 m) |
| Lowest elevation | 1,273 ft (338 m) |
| Population | |
| • Total | 721,873 |
| • Density | 103.2/sq mi (39.9/km2) |
Spokane–Spokane Valley–Coeur d'Alene, WA–ID CSA is the United States Census Bureau's official name for the combined statistical area that includes the Spokane metro area as well as the Coeur d'Alene metro area. The population was 710,946 as of 2016.[1] It is the 69th largest Combined Statistical Area in the United States, and is the economic and cultural center of the Inland Northwest. The CSA is Anchored by Spokane, and its largest satellite Coeur d'Alene, which are separated by suburbs that primarily follow the path of Interstate 90.[2]
Demographics
According to the American Community Survey 1-year estimates (ACS 2016), as of 2016, there were 710,575 and 276,473 households residing within the CSA. The racial makeup of the MSA was 85.5% White, 1.4% African American, 1.5% Native American, 1.9% Asian, 0.4% Pacific Islander, 0.1% from other races, and 3.2% from two or more races. Hispanic or Latino of any race were 5% of the population.
The median income for a household in the MSA was $52,596, and about 13.7% of the population lived below the poverty line (including 17.3% of people under the age of 18 and 7.9% of people over the age of 65). The per capita income for the CSA was $27,860.
| Historical population | |||
|---|---|---|---|
| Census | Pop. | %± | |
| 1880 | 6,025 | — | |
| 1890 | 45,936 | 662.4% | |
| 1900 | 78,301 | 70.5% | |
| 1910 | 187,448 | 139.4% | |
| 1920 | 187,135 | −0.2% | |
| 1930 | 195,651 | 4.6% | |
| 1940 | 213,336 | 9.0% | |
| 1950 | 272,501 | 27.7% | |
| 1960 | 332,687 | 22.1% | |
| 1970 | 346,249 | 4.1% | |
| 1980 | 439,164 | 26.8% | |
| 1990 | 470,991 | 7.2% | |
| 2000 | 578,438 | 22.8% | |
| 2010 | 666,247 | 15.2% | |
| Est. 2017 | 721,873 | 8.3% | |
References
- ↑ "Census Reporter". United States Census Bureau. Retrieved April 10, 2018.
- ↑ "RITZVILLE 1 SSE, WASHINGTON (457059)". Western Regional Climate Center. Retrieved June 6, 2016.