Demographic history of New York City

The racial and ethnic history of New York City has varied widely; from its sale to the Dutch by Native American residents, to the modern multi-cultural period.
New York City has had a largely white population, and most foreign born immigrants to the city before the end of World War II were from Europe. However, this changed in the decades after World War II, when all of the boroughs became more diverse, and when immigration from places outside Europe was increased thanks to the Immigration and Nationality Act of 1965 .
Overview
The population of New York City was Non-Hispanic White until the post-World War II era.[1] Large numbers of non-whites only began settling in Manhattan in the 1920s and in the rest of NYC after World War II.[1] The slowest area in the city to change its racial makeup was Staten Island, which was the only borough of New York City to retain a Non-Hispanic White majority after the 1980s.[1] Between 1900 and 2010, New York City's total black population increased by about thirty-five times, while its Asian population increased by over one-hundred-and-fifty times over the same period.[1] The large black migration to New York City helped cause the Harlem Renaissance, a rich cultural period for the African Americans living in New York (especially in Harlem neighborhood, the namesake) between the end of World War I and the Great Depression. New York's Hispanic population increased by almost twenty times between 1940 and 2010, while its total Non-Hispanic White population decreased by over 60% over the same time period.[1]
New York's five boroughs have had different settlement histories. The Bronx and Brooklyn were the most popular destinations for blacks to settle, while Queens was the most popular destination for Asian migrants to NYC and the Bronx was the most popular destination for Hispanic migrants to move to.[1] New York City's total population more than doubled between 1900 and 2010 (with a period of population stagnation between 1950 and 1990).[1] The Bronx, Queens, and Staten Island experienced enormous population growth between 1900 and 2010, much higher than New York's average population growth.[1] Brooklyn's population grew at a much slower rate during this time period, while Manhattan actually had fewer people in 2010 than in 1900.[1]
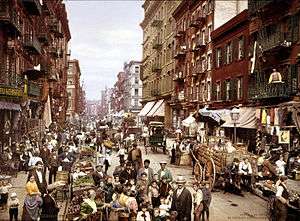
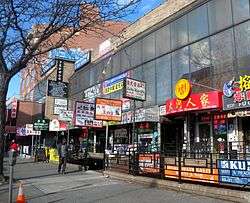
New York City has always had a much greater percentage of immigrants as part of its total population than the whole United States has.[2][3] Right before World War I over 40% of New York City's total population was composed of immigrants.[2] After immigration restrictions were passed in the 1920s, immigrants as a percentage of New York's total population dropped to 18% in 1970, before bouncing back up to 36% in 2000.[2] The recorded increase in the city's immigrant percentage after 1970 occurred after the passage of the Immigration Act of 1965 (which took effect in 1968) and at a time when a greater number of immigrants than before were coming to the United States.[2][4] Most of the earlier immigrants to New York City were from Europe (initially from Western Europe, and then more from Eastern Europe).[5] A large percentage of the immigrants that came to New York City after 1965 were from non-European countries.[5] Large numbers of Irish people arrived in New York City during the Irish potato famine in the 1840s, while Germans, Italians, Jews, and other European ethnic groups arrived in NYC mostly during the late 19th and early 20th centuries.[5] Because of the abolition of the National Origins Formula, a large percentage of the immigrants that came to New York City after 1965 were from non-European countries.[5] Of the immigrants in the state, about three million live in New York City.[6] The number of immigrants living in New York City increased only slightly from 2000 to 2011, with an increase from 2,871,032 to 3,066,599 residents being born outside the United States.[7]:10
Citywide
The following tables present a consolidated demographic profile of race and ethnicity in New York City which includes all five boroughs.[1][8][9][10][11][12][13][14][15][16]
| Year | Population | White (includes White Hispanics) | % W | Non-Hispanic Whites | % ANG | Black | % B | Asian | % A | Other or Mixed | % O/M | Hispanic/ Latino | % H/L | Foreign born | % FB |
|---|---|---|---|---|---|---|---|---|---|---|---|---|---|---|---|
| 1900 | 3,437,202 | 3,369,898 | 98.04 | N/A | N/A | 60,666 | 1.76 | 6,607 | 0.19 | 31 | 0 | N/A | N/A | 1,270,080 | 36.95 |
| 1910 | 4,766,883 | 4,669,162 | 97.95 | N/A | N/A | 91,709 | 1.92 | 5,669 | 0.12 | 343 | 0.01 | N/A | N/A | 1,944,357 | 40.79 |
| 1920 | 5,620,048 | 5,459,463 | 97.14 | N/A | N/A | 152,467 | 2.71 | 7,969 | 0.14 | 149 | 0 | N/A | N/A | 2,028,160 | 36.09 |
| 1930 | 6,930,446 | 6,589,377 | 95.08 | N/A | N/A | 327,706 | 4.73 | 12,972 | 0.19 | 391 | 0.01 | N/A | N/A | 2,358,686 | 34.03 |
| 1940 | 7,454,995 | 6,977,501 | 93.59 | 6,856,586 | 91.97 | 458,444 | 6.15 | 17,986 | 0.24 | 1,064 | 0.01 | 120,915 | 1.62 | 2,138,657 | 28.69 |
| 1950 | 7,891,957 | 7,116,441 | 90.17 | N/A | N/A | 747,608 | 9.47 | 21,441 | 0.27 | 6,467 | 0.08 | N/A | N/A | 1,784,206 | 22.61 |
| 1960 | 7,781,984 | 6,640,662 | 85.33 | N/A | N/A | 1,087,931 | 13.98 | 43,103 | 0.55 | 10,288 | 0.13 | N/A | N/A | 1,558,690 | 20.03 |
| 1970 | 7,894,862 | 6,048,841 | 76.62 | 4,969,749 | 62.95 | 1,668,115 | 21.13 | 94,499 | 1.20 | 83,407 | 1.06 | 1,278,630 | 16.20 | 1,437,058 | 18.20 |
| 1980 | 7,071,639 | 4,294,075 | 60.72 | 3,668,945 | 51.88 | 1,784,337 | 25.23 | 231,501 | 3.27 | 761,762 | 10.77 | 1,406,024 | 19.88 | 1,670,199 | 23.62 |
| 1990 | 7,322,564 | 3,827,088 | 52.26 | 3,163,125 | 43.20 | 2,102,512 | 28.71 | 512,719 | 7.00 | 880,245 | 12.02 | 1,783,511 | 24.36 | 2,082,931 | 28.45 |
| 2000 | 8,008,278 | 3,576,385 | 44.66 | 2,801,267 | 34.98 | 2,129,762 | 26.59 | 792,477 | 9.90 | 1,509,654 | 18.85 | 2,160,554 | 26.98 | 2,871,032 | 35.85 |
| 2010 | 8,175,133 | 3,597,341 | 44.00 | 2,722,904 | 33.31 | 2,088,510 | 25.55 | 1,043,535 | 12.77 | 1,445,747 | 17.68 | 2,336,076 | 28.58 | 3,066,599 | 37.51 |
By borough
The Bronx
| Year | Population | White (includes White Hispanics) | % W | Non-Hispanic Whites | % ANG | Black | % B | Asian | % A | Other or Mixed | % O/M | Hispanic/ Latino | % H/L | Foreign born | % FB |
|---|---|---|---|---|---|---|---|---|---|---|---|---|---|---|---|
| 1900 | 200,507 | 197,923 | 98.71 | N/A | N/A | 2,370 | 1.18 | 208 | 0.10 | 6 | 0 | N/A | N/A | 61,258 | 30.55 |
| 1910 | 430,980 | 426,650 | 99.00 | N/A | N/A | 4,117 | 0.96 | 189 | 0.04 | 24 | 0.01 | N/A | N/A | 149,427 | 34.67 |
| 1920 | 732,016 | 726,990 | 99.31 | N/A | N/A | 4,803 | 0.66 | 215 | 0.03 | 8 | 0 | N/A | N/A | 267,742 | 36.58 |
| 1930 | 1,265,258 | 1,251,823 | 98.94 | N/A | N/A | 12,930 | 1.02 | 476 | 0.04 | 29 | 0 | N/A | N/A | 479,451 | 37.89 |
| 1940 | 1,394,711 | 1,370,319 | 98.25 | N/A | N/A | 23,529 | 1.69 | 801 | 0.06 | 62 | 0 | N/A | N/A | 463,453 | 33.23 |
| 1950 | 1,451,277 | 1,351,662 | 93.14 | N/A | N/A | 97,752 | 6.74 | 1,249 | 0.09 | 614 | 0.04 | N/A | N/A | 373,894 | 25.76 |
| 1960 | 1,424,815 | 1,256,284 | 88.17 | N/A | N/A | 163,896 | 11.50 | 3,544 | 0.25 | 1,091 | 0.08 | N/A | N/A | 306,592 | 21.52 |
| 1970 | 1,471,701 | 1,080,859 | 73.44 | N/A | N/A | 357,681 | 24.30 | 7,792 | 0.53 | 25,369 | 1.72 | N/A | N/A | 229,210 | 15.57 |
| 1980 | 1,168,972 | 554,046 | 47.40 | 396,836 | 33.95 | 371,926 | 31.82 | 15,163 | 1.30 | 227,837 | 19.49 | 396,353 | 33.91 | 215,313 | 18.42 |
| 1990 | 1,203,789 | 430,077 | 35.73 | 272,503 | 22.64 | 449,399 | 37.33 | 35,562 | 2.95 | 288,751 | 23.99 | 523,111 | 43.46 | 274,793 | 22.83 |
| 2000 | 1,332,650 | 398,003 | 29.87 | 193,651 | 14.53 | 475,007 | 35.64 | 41,503 | 3.11 | 418,137 | 31.38 | 644,705 | 48.38 | 385,827 | 28.95 |
| 2010 | 1,385,108 | 386,497 | 27.90 | 151,209 | 10.92 | 505,200 | 36.47 | 50,897 | 3.68 | 442,514 | 31.95 | 741,413 | 53.53 | 518,353 | 37.42 |
Brooklyn
| Year | Population | White (includes White Hispanics) | % W | Non-Hispanic Whites | % ANG | Black | % B | Asian | % A | Other or Mixed | % O/M | Hispanic/ Latino | % H/L | Foreign born | % FB |
|---|---|---|---|---|---|---|---|---|---|---|---|---|---|---|---|
| 1900 | 1,166,582 | 1,146,909 | 98.31 | N/A | N/A | 18,367 | 1.57 | 1,300 | 0.11 | 6 | 0 | N/A | N/A | 355,697 | 30.49 |
| 1910 | 1,634,351 | 1,610,487 | 98.54 | N/A | N/A | 22,708 | 1.39 | 1,010 | 0.06 | 146 | 0.01 | N/A | N/A | 574,730 | 35.17 |
| 1920 | 2,018,356 | 1,984,953 | 98.35 | N/A | N/A | 31,912 | 1.58 | 1,459 | 0.07 | 32 | 0 | N/A | N/A | 666,188 | 33.01 |
| 1930 | 2,560,401 | 2,488,815 | 97.20 | N/A | N/A | 68,921 | 2.69 | 2,539 | 0.10 | 126 | 0 | N/A | N/A | 881,571 | 34.43 |
| 1940 | 2,698,285 | 2,587,951 | 95.91 | N/A | N/A | 107,263 | 3.98 | 2,608 | 0.10 | 463 | 0.02 | N/A | N/A | 778,054 | 28.84 |
| 1950 | 2,738,175 | 2,525,118 | 92.22 | N/A | N/A | 208,478 | 7.61 | 2,514 | 0.09 | 2,065 | 0.08 | N/A | N/A | 630,526 | 23.03 |
| 1960 | 2,627,319 | 2,245,859 | 85.48 | N/A | N/A | 371,405 | 14.14 | 6,540 | 0.25 | 3,515 | 0.13 | N/A | N/A | 516,349 | 19.65 |
| 1970 | 2,602,012 | 1,905,788 | 73.24 | N/A | N/A | 656,194 | 25.22 | 16,138 | 0.62 | 23,892 | 0.92 | N/A | N/A | 456,636 | 17.55 |
| 1980 | 2,230,936 | 1,249,486 | 56.01 | 1,085,233 | 48.64 | 722,812 | 32.40 | 42,965 | 1.93 | 215,673 | 9.67 | 392,118 | 17.58 | 530,973 | 23.80 |
| 1990 | 2,300,664 | 1,078,549 | 46.88 | 923,229 | 40.13 | 872,305 | 37.92 | 111,251 | 4.84 | 238,559 | 10.37 | 462,411 | 20.10 | 672,569 | 29.23 |
| 2000 | 2,465,326 | 1,015,728 | 41.20 | 854,532 | 34.66 | 898,350 | 36.44 | 187,283 | 7.60 | 363,965 | 14.76 | 487,878 | 19.79 | 931,769 | 37.79 |
| 2010 | 2,504,700 | 1,072,041 | 42.80 | 893,306 | 35.67 | 860,083 | 34.34 | 263,519 | 10.52 | 309,057 | 12.34 | 496,285 | 19.81 | 912,793 | 36.44 |
Manhattan
| Year | Population | White (includes White Hispanics) | % W | Non-Hispanic Whites | % ANG | Black | % B | Asian | % A | Other or Mixed | % O/M | Hispanic/ Latino | % H/L | Foreign born | % FB |
|---|---|---|---|---|---|---|---|---|---|---|---|---|---|---|---|
| 1900 | 1,850,093 | 1,808,968 | 97.78 | N/A | N/A | 36,246 | 1.96 | 4,861 | 0.26 | 18 | 0 | N/A | N/A | 789,626 | 42.68 |
| 1910 | 2,331,542 | 2,266,578 | 97.21 | N/A | N/A | 60,534 | 2.60 | 4,260 | 0.18 | 170 | 0.01 | N/A | N/A | 1,116,477 | 47.89 |
| 1920 | 2,284,103 | 2,168,906 | 94.96 | N/A | N/A | 109,133 | 4.78 | 6,003 | 0.26 | 61 | 0 | N/A | N/A | 950,264 | 41.60 |
| 1930 | 1,867,312 | 1,633,329 | 87.47 | N/A | N/A | 224,670 | 12.03 | 9,124 | 0.49 | 189 | 0.01 | N/A | N/A | 689,506 | 36.93 |
| 1940 | 1,889,924 | 1,577,625 | 83.48 | N/A | N/A | 298,365 | 15.79 | 13,467 | 0.71 | 467 | 0.02 | N/A | N/A | 582,895 | 30.84 |
| 1950 | 1,960,101 | 1,556,599 | 79.41 | N/A | N/A | 384,482 | 19.62 | 16,083 | 0.82 | 2,937 | 0.15 | N/A | N/A | 461,102 | 23.52 |
| 1960 | 1,698,281 | 1,271,822 | 74.89 | N/A | N/A | 397,101 | 23.38 | 25,487 | 1.50 | 3,871 | 0.23 | N/A | N/A | 374,698 | 22.06 |
| 1970 | 1,539,233 | 1,089,302 | 70.77 | N/A | N/A | 380,442 | 24.72 | 47,332 | 3.08 | 22,157 | 1.44 | N/A | N/A | 307,630 | 19.99 |
| 1980 | 1,428,285 | 841,204 | 58.90 | 713,854 | 49.98 | 309,854 | 21.69 | 72,884 | 5.10 | 204,343 | 14.31 | 336,247 | 23.54 | 348,581 | 24.41 |
| 1990 | 1,487,536 | 867,227 | 58.30 | 726,755 | 48.86 | 326,967 | 21.98 | 110,629 | 7.44 | 182,713 | 12.28 | 386,630 | 25.99 | 383,866 | 25.81 |
| 2000 | 1,537,195 | 835,610 | 54.36 | 703,873 | 45.79 | 267,302 | 17.39 | 145,607 | 9.47 | 288,676 | 18.78 | 417,816 | 27.18 | 452,440 | 29.43 |
| 2010 | 1,585,872 | 911,073 | 57.45 | 761,493 | 48.02 | 246,687 | 15.55 | 180,425 | 11.38 | 247,688 | 15.62 | 403,577 | 25.45 | 470,305 | 29.66 |
Queens
| Year | Population | White (includes White Hispanics) | % W | Non-Hispanic Whites | % ANG | Black | % B | Asian | % A | Other or Mixed | % O/M | Hispanic/ Latino | % H/L | Foreign born | % FB |
|---|---|---|---|---|---|---|---|---|---|---|---|---|---|---|---|
| 1900 | 152,999 | 150,235 | 98.19 | N/A | N/A | 2,611 | 1.71 | 152 | 0.10 | 1 | 0 | N/A | N/A | 44,812 | 29.29 |
| 1910 | 284,041 | 280,691 | 98.82 | N/A | N/A | 3,198 | 1.13 | 149 | 0.05 | 3 | 0 | N/A | N/A | 79,329 | 27.93 |
| 1920 | 469,042 | 463,661 | 98.85 | N/A | N/A | 5,120 | 1.09 | 214 | 0.05 | 47 | 0.01 | N/A | N/A | 112,171 | 23.91 |
| 1930 | 1,079,129 | 1,059,804 | 98.21 | N/A | N/A | 18,609 | 1.72 | 679 | 0.06 | 37 | 0 | N/A | N/A | 268,358 | 24.87 |
| 1940 | 1,297,634 | 1,270,731 | 97.93 | N/A | N/A | 25,890 | 2.00 | 947 | 0.07 | 66 | 0.01 | N/A | N/A | 278,937 | 21.50 |
| 1950 | 1,550,849 | 1,497,126 | 96.54 | N/A | N/A | 51,524 | 3.32 | 1,444 | 0.09 | 755 | 0.05 | N/A | N/A | 288,197 | 18.58 |
| 1960 | 1,809,578 | 1,654,959 | 91.46 | N/A | N/A | 145,855 | 8.06 | 7,084 | 0.39 | 1,680 | 0.09 | N/A | N/A | 335,623 | 18.55 |
| 1970 | 1,986,473 | 1,695,288 | 85.34 | N/A | N/A | 258,006 | 12.99 | 21,940 | 1.10 | 11,239 | 0.57 | N/A | N/A | 416,887 | 20.99 |
| 1980 | 1,891,325 | 1,335,805 | 70.63 | 1,172,511 | 61.99 | 354,129 | 18.72 | 93,780 | 4.96 | 107,611 | 5.69 | 262,422 | 13.88 | 540,818 | 28.59 |
| 1990 | 1,951,598 | 1,129,192 | 57.86 | 937,557 | 48.04 | 423,211 | 21.69 | 238,336 | 12.21 | 160,859 | 8.24 | 381,120 | 19.53 | 707,153 | 36.23 |
| 2000 | 2,229,379 | 982,725 | 44.08 | 732,895 | 32.87 | 446,189 | 20.01 | 392,831 | 17.62 | 407,634 | 18.28 | 556,605 | 24.97 | 1,028,339 | 46.13 |
| 2010 | 2,230,722 | 1,060,000 | 45.72 | 616,727 | 27.65 | 426,683 | 19.13 | 513,317 | 23.01 | 404,669 | 18.14 | 613,750 | 27.51 | 1,059,593 | 47.50 |
Staten Island
| Year | Population | White (includes White Hispanics) | % W | Non-Hispanic Whites | % ANG | Black | % B | Asian | % A | Other or Mixed | % O/M | Hispanic/ Latino | % H/L | Foreign born | % FB |
|---|---|---|---|---|---|---|---|---|---|---|---|---|---|---|---|
| 1900 | 67,021 | 65,863 | 98.27 | N/A | N/A | 1,072 | 1.60 | 86 | 0.13 | 0 | 0 | N/A | N/A | 18,687 | 27.88 |
| 1910 | 85,969 | 84,756 | 98.59 | N/A | N/A | 1,152 | 1.34 | 61 | 0.07 | 0 | 0 | N/A | N/A | 24,394 | 28.38 |
| 1920 | 116,531 | 114,953 | 98.65 | N/A | N/A | 1,499 | 1.29 | 78 | 0.07 | 1 | 0 | N/A | N/A | 31,795 | 27.28 |
| 1930 | 158,346 | 155,606 | 98.27 | N/A | N/A | 2,576 | 1.63 | 154 | 0.10 | 10 | 0.01 | N/A | N/A | 39,799 | 25.13 |
| 1940 | 174,441 | 170,875 | 97.96 | N/A | N/A | 3,397 | 1.95 | 163 | 0.09 | 6 | 0 | N/A | N/A | 35,318 | 20.25 |
| 1950 | 191,555 | 185,936 | 97.07 | N/A | N/A | 5,372 | 2.80 | 153 | 0.08 | 94 | 0.05 | N/A | N/A | 30,487 | 15.92 |
| 1960 | 221,991 | 211,738 | 95.38 | N/A | N/A | 9,674 | 4.36 | 448 | 0.20 | 131 | 0.06 | N/A | N/A | 25,428 | 11.45 |
| 1970 | 295,443 | 277,604 | 93.96 | N/A | N/A | 15,792 | 5.35 | 1,297 | 0.44 | 750 | 0.25 | N/A | N/A | 26,695 | 9.04 |
| 1980 | 352,121 | 313,534 | 89.04 | 300,511 | 85.34 | 25,616 | 7.27 | 6,709 | 1.91 | 6,262 | 1.78 | 18,884 | 5.36 | 34,514 | 9.80 |
| 1990 | 378,977 | 322,043 | 84.98 | 303,081 | 79.97 | 30,630 | 8.08 | 16,941 | 4.47 | 9,363 | 2.47 | 30,239 | 7.98 | 44,550 | 11.76 |
| 2000 | 443,728 | 344,319 | 77.60 | 316,316 | 71.29 | 42,914 | 9.67 | 25,253 | 5.69 | 31,242 | 7.04 | 53,550 | 12.07 | 72,657 | 16.37 |
| 2010 | 468,730 | 341,677 | 72.89 | 300,169 | 64.04 | 49,857 | 10.64 | 35,377 | 7.55 | 41,819 | 8.92 | 81,051 | 17.29 | 110,142 | 23.50 |
See also
References
- 1 2 3 4 5 6 7 8 9 10 "New York – Race and Hispanic Origin for Selected Large Cities and Other Places: Earliest Census to 1990" (PDF). Retrieved January 4, 2012.
- 1 2 3 4 Gibson, Campbell; Jung, Kay (February 2006). "Table 23. Nativity of the Population for the 50 Largest Urban Places: 1870 to 2000" (Historical Census Statistics on the Foreign-Born Population of the United States: 1850-2000). Washington, DC 20233-8800: U.S. Census Bureau Population Division. Retrieved February 10, 2013.
- ↑ Gibson, Campbell; Jung, Kay (February 2006). "Table 14. Nativity of the Population, for Regions, Divisions, and States: 1850 to 2000" (Historical Census Statistics on the Foreign-Born Population of the United States: 1850-2000). Washington, DC 20233-8800: U.S. Census Bureau Population Division. Retrieved February 10, 2013.
- ↑ "Legal Immigration to the United States: Fiscal Years 1820 to 2011 (in millions)". Migration Policy Institute. 2012. Archived from the original on February 2, 2013. Retrieved February 10, 2013.
- 1 2 3 4 Bloch, Matthew; Gebeloff, Robert (March 10, 2009), "Immigration Explorer", The New York Times, retrieved January 21, 2013
- ↑ "Working for a Better Life: A Profile of Immigrants in the New York State Economy" (PDF). Fiscal Policy Institute. 2007.
- ↑ Bloomberg, Michael R.; Burden, Amanda M.; Shama, Fatima (2013). The Newest New Yorkers (PDF) (2013 ed.). New York City Department of City Planning.
- ↑ American FactFinder, United States Census Bureau. "New York City Profile of General Demographic Characteristics: 2000". Factfinder.census.gov. Retrieved January 4, 2012.
- ↑ "New York City Race, Hispanic or Latino, Age, and Housing Occupancy: 2010". Factfinder2.census.gov. October 5, 2010. Archived from the original on May 20, 2011. Retrieved January 4, 2012.
- ↑ "Total and Foreign-born Population: New York Metropolitan Region by Subregion and County, 1900–2000" (PDF). Archived from the original (PDF) on June 28, 2011. Retrieved January 4, 2012.
- ↑ "Bronx County Population by Race". Censusscope.org. Retrieved January 4, 2012.
- ↑ "Kings County Population by Race". Censusscope.org. Retrieved January 4, 2012.
- ↑ "New York County Population by Race". Censusscope.org. Retrieved January 4, 2012.
- ↑ "Queens County Population by Race". Censusscope.org. Retrieved January 4, 2012.
- ↑ "Richmond County Population by Race". Censusscope.org. Retrieved January 4, 2012.
- ↑ "Race/Ethnicity Counts: Counties" (PDF). Retrieved January 4, 2012.
| By topic |  | |
|---|---|---|
| Boroughs |
| |
| Government | ||
| Emergency services | ||
| Transportation | ||
| Culture | ||
| Education | ||
| ||