Past sea level
Global or eustatic sea level has fluctuated significantly over the Earth's history. The main factors affecting sea level are the amount and volume of available water and the shape and volume of the ocean basins. The primary influences on water volume are the temperature of the seawater, which affects density, and the amounts of water retained in other reservoirs like rivers, aquifers, lakes, glaciers, polar ice caps and sea ice. Over geological timescales, changes in the shape of the oceanic basins and in land/sea distribution affect sea level. In addition to eustatic changes, local changes in sea level are caused by tectonic uplift and subsidence.
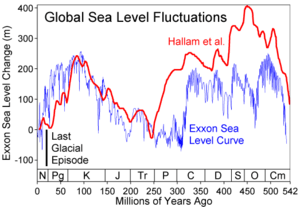
Over geologic time sea level has fluctuated by more than 300 metres, possibly more than 400 metres. The main reason for sea level fluctuations is the Antarctic ice sheet and Antarctic post-glacial rebound during warm periods.
The current sea level is about 130 metres higher than the historical minimum, and more than 200 metres lower than the historical maximum, about 100 million years ago. Historically low levels were reached during the Last Glacial Maximum (LGM), about 20,000 years ago. The last time the sea level was higher than today was during the Eemian, about 130,000 years ago.[2]
Over a shorter timescale, the low level reached during the LGM rebounded in the early Holocene, between about 14,000 and 6,000 years ago, and sea levels have been comparably stable over the past 6,000 years. Observational and modeling studies of mass loss from glaciers and ice caps indicate a contribution to a sea-level rise of 2 to 4 cm over the 20th century. Based on orbital models, the cooling trend initiated about 6,000 years ago will continue for another 23,000 years. It is possible, however, that a "next glacial maximum" will be reached only in about 100,000 years, with a possible warm period in 60,000 years.[3][4]
Glaciers and ice caps
Each year about 8 mm (0.3 inches) of water from the entire surface of the oceans falls onto the Antarctica and Greenland ice sheets as snowfall. If no ice returned to the oceans, sea level would drop 8 mm (0.3 in) every year. To a first approximation, the same amount of water appeared to return to the ocean in icebergs and from ice melting at the edges. Scientists previously had estimated which is greater, ice going in or coming out, called the mass balance, important because it causes changes in global sea level. High-precision gravimetry from satellites in low-noise flight has since determined that in 2006, the Greenland and Antarctic ice sheets experienced a combined mass loss of 475 ± 158 Gt/yr, equivalent to 1.3 ± 0.4 mm/yr sea level rise. Notably, the acceleration in ice sheet loss from 1988–2006 was 21.9 ± 1 Gt/yr² for Greenland and 14.5 ± 2 Gt/yr² for Antarctica, for a combined total of 36.3 ± 2 Gt/yr². This acceleration is 3 times larger than for mountain glaciers and ice caps (12 ± 6 Gt/yr²).[5]
Ice shelves float on the surface of the sea and, if they melt, to first order they do not change sea level. Likewise, the melting of the northern polar ice cap which is composed of floating pack ice would not significantly contribute to rising sea levels. However, because floating ice pack is lower in salinity than seawater, their melting would cause a very small increase in sea levels, so small that it is generally neglected.
- Scientists previously lacked knowledge of changes in terrestrial storage of water. Surveying of water retention by soil absorption and by artificial reservoirs ("impoundment") show that a total of about 10,800 cubic kilometres (2,591 cubic miles) of water (just under the size of Lake Huron) has been impounded on land to date. Such impoundment masked about 30 mm (1.2 in) of sea level rise in that time.[6]
- Conversely estimates of excess global groundwater extraction during 1900–2008 totals ∼4,500 km3, equivalent to a sea-level rise of 12.6 mm (0.50 in) (>6% of the total). Furthermore, the rate of groundwater depletion has increased markedly since about 1950, with maximum rates occurring during the most recent period (2000–2008), when it averaged ∼145 km3/yr (equivalent to 0.40 mm/yr of sea-level rise, or 13% of the reported rate of 3.1 mm/yr during this recent period).[7]
- If small glaciers and polar ice caps on the margins of Greenland and the Antarctic Peninsula melt, the projected rise in sea level will be around 0.5 m (1 ft 7.7 in). Melting of the Greenland ice sheet would produce 7.2 m (23.6 ft) of sea-level rise, and melting of the Antarctic ice sheet would produce 61.1 m (200.5 ft) of sea level rise.[8] The collapse of the grounded interior reservoir of the West Antarctic Ice Sheet would raise sea level by 5 m (16.4 ft) - 6 m (19.7 ft).[9]
- The snowline altitude is the altitude of the lowest elevation interval in which minimum annual snow cover exceeds 50%. This ranges from about 5,500 metres (18,045 feet) above sea-level at the equator down to sea level at about 70° N&S latitude, depending on regional temperature amelioration effects. Permafrost then appears at sea level and extends deeper below sea level polewards.
- As most of the Greenland and Antarctic ice sheets lie above the snowline and/or base of the permafrost zone, they cannot melt in a timeframe much less than several millennia; therefore it is likely that they will not, through melting, contribute significantly to sea level rise in the coming century. They can, however, do so through acceleration in flow and enhanced iceberg calving.
- Climate changes during the 20th century are estimated from modelling studies to have led to contributions of between −0.2 and 0.0 mm/yr from Antarctica (the results of increasing precipitation) and 0.0 to 0.1 mm/yr from Greenland (from changes in both precipitation and runoff).
- Estimates suggest that Greenland and Antarctica have contributed 0.0 to 0.5 mm/yr over the 20th century as a result of long-term adjustment to the end of the last ice age.
The current rise in sea level observed from tide gauges, of about 1.8 mm/yr, is within the estimate range from the combination of factors above,[10] but active research continues in this field. The terrestrial storage term, thought to be highly uncertain, is no longer positive, and shown to be quite large.
Geological influences
At times during Earth's long history, the configuration of the continents and sea floor has changed due to plate tectonics. This affects global sea level by altering the depths of various ocean basins and also by altering glacier distribution with resulting changes in glacial-interglacial cycles. Changes in glacial-interglacial cycles are at least partially affected by changes in glacier distributions across the a Earth.
The depth of the ocean basins is a function of the age of oceanic lithosphere (the tectonic plates beneath the floors of the world's oceans). As older plates age, they become denser and sink, allowing newer plates to rise and take their place. Therefore, a configuration with many small oceanic plates that rapidly recycle the oceanic lithosphere would produce shallower ocean basins and (all other things being equal) higher sea levels. A configuration with fewer plates and more cold, dense oceanic lithosphere, on the other hand, would result in deeper ocean basins and lower sea levels.
When there was much continental crust near the poles, the rock record shows unusually low sea levels during ice ages, because there was much polar land mass on which snow and ice could accumulate. During times when the land masses clustered around the equator, ice ages had much less effect on sea level.
Over most of geologic time, the long-term mean sea level has been higher than today (see graph above). Only at the Permian-Triassic boundary ~250 million years ago was the long-term mean sea level lower than today. Long term changes in the mean sea level are the result of changes in the oceanic crust, with a downward trend expected to continue in the very long term.[11]
During the glacial-interglacial cycles over the past few million years, the mean sea level has varied by somewhat more than a hundred metres. This is primarily due to the growth and decay of ice sheets (mostly in the northern hemisphere) with water evaporated from the sea.
The Mediterranean Basin's gradual growth as the Neotethys basin, begun in the Jurassic, did not suddenly affect ocean levels. While the Mediterranean was forming during the past 100 million years, the average ocean level was generally 200 metres above current levels. However, the largest known example of marine flooding was when the Atlantic breached the Strait of Gibraltar at the end of the Messinian Salinity Crisis about 5.2 million years ago. This restored Mediterranean sea levels at the sudden end of the period when that basin had dried up, apparently due to geologic forces in the area of the Strait.
| Long-term causes | Range of effect | Vertical effect |
|---|---|---|
| Change in volume of ocean basins | ||
| Plate tectonics and seafloor spreading (plate divergence/convergence) and change in seafloor elevation (mid-ocean volcanism) | Eustatic | 0.01 mm/yr |
| Marine sedimentation | Eustatic | < 0.01 mm/yr |
| Change in mass of ocean water | ||
| Melting or accumulation of continental ice | Eustatic | 10 mm/yr |
| • Climate changes during the 20th century | ||
| •• Antarctica | Eustatic | 0.39 to 0.79 mm/yr[12] |
| •• Greenland (from changes in both precipitation and runoff) | Eustatic | 0.0 to 0.1 mm/yr |
| • Long-term adjustment to the end of the last ice age | ||
| •• Greenland and Antarctica contribution over 20th century | Eustatic | 0.0 to 0.5 mm/yr |
| Release of water from earth's interior | Eustatic | |
| Release or accumulation of continental hydrologic reservoirs | Eustatic | |
| Uplift or subsidence of Earth's surface (Isostasy) | ||
| Thermal-isostasy (temperature/density changes in earth's interior) | Local effect | |
| Glacio-isostasy (loading or unloading of ice) | Local effect | 10 mm/yr |
| Hydro-isostasy (loading or unloading of water) | Local effect | |
| Volcano-isostasy (magmatic extrusions) | Local effect | |
| Sediment-isostasy (deposition and erosion of sediments) | Local effect | < 4 mm/yr |
| Tectonic uplift/subsidence | ||
| Vertical and horizontal motions of crust (in response to fault motions) | Local effect | 1–3 mm/yr |
| Sediment compaction | ||
| Sediment compression into denser matrix (particularly significant in and near river deltas) | Local effect | |
| Loss of interstitial fluids (withdrawal of groundwater or oil) | Local effect | ≤ 55 mm/yr |
| Earthquake-induced vibration | Local effect | |
| Departure from geoid | ||
| Shifts in hydrosphere, aesthenosphere, core-mantle interface | Local effect | |
| Shifts in earth's rotation, axis of spin and precession of equinox | Eustatic | |
| External gravitational changes | Eustatic | |
| Evaporation and precipitation (if due to a long-term pattern) | Local effect | |
Changes through geologic time
Sea level has changed over geologic time. As the graph shows, sea level today is very near the lowest level ever attained (the lowest level occurred at the Permian-Triassic boundary about 250 million years ago).
During the most recent ice age (at its maximum about 20,000 years ago) the world's sea level was about 130 m lower than today, due to the large amount of sea water that had evaporated and been deposited as snow and ice, mostly in the Laurentide ice sheet. Most of this had melted by about 10,000 years ago.
Hundreds of similar glacial cycles have occurred throughout the Earth's history. Geologists who study the positions of coastal sediment deposits through time have noted dozens of similar basinward shifts of shorelines associated with a later recovery. This results in sedimentary cycles which in some cases can be correlated around the world with great confidence. This relatively new branch of geological science linking eustatic sea level to sedimentary deposits is called sequence stratigraphy.
The most up-to-date chronology of sea level change through the Phanerozoic shows the following long-term trends:[13]
- Gradually rising sea level through the Cambrian
- Relatively stable sea level in the Ordovician, with a large drop associated with the end-Ordovician glaciation
- Relative stability at the lower level during the Silurian
- A gradual fall through the Devonian, continuing through the Mississippian to long-term low at the Mississippian/Pennsylvanian boundary
- A gradual rise until the start of the Permian, followed by a gentle decrease lasting until the Mesozoic.
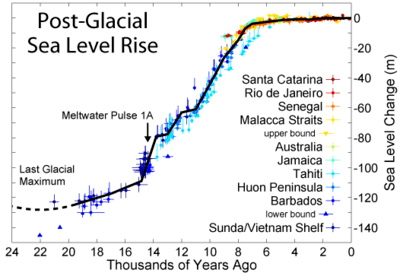
Sea level rise since the last glacial maximum
During deglaciation between about 19–8 ka, sea level rose at extremely high rates as the result of the rapid melting of the British-Irish Sea, Fennoscandian, Laurentide, Barents-Kara, Patagonian, Innuitian ice sheets and parts of the Antarctic ice sheet. At the onset of deglaciation about 19,000 calendar years ago, a brief, at most 500-year long, glacio-eustatic event may have contributed as much as 10 m to sea level with an average rate of about 20 mm/yr. During the rest of the early Holocene, the rate of sea level rise varied from a low of about 6.0–9.9 mm/yr to as high as 30–60 mm/yr during brief periods of accelerated sea level rise.[14][15]
Solid geological evidence, based largely upon analysis of deep cores of coral reefs, exists only for 3 major periods of accelerated sea level rise, called meltwater pulses, during the last deglaciation. They are Meltwater pulse 1A between circa 14,600 and 14,300 calendar years ago; Meltwater pulse 1B between circa 11,400 and 11,100 calendar years ago; and Meltwater pulse 1C between 8,200 and 7,600 calendar years ago. Meltwater pulse 1A was a 13.5 m rise over about 290 years centered at 14,200 calendar years ago and Meltwater pulse 1B was a 7.5 m rise over about 160 years centered at 11,000 years calendar years ago. In sharp contrast, the period between 14,300 and 11,100 calendar years ago, which includes the Younger Dryas interval, was an interval of reduced sea level rise at about 6.0–9.9 mm/yr. Meltwater pulse 1C was centered at 8,000 calendar years and produced a rise of 6.5 m in less than 140 years.[15][16][17] Such rapid rates of sea level rising during meltwater events clearly implicate major ice-loss events related to ice sheet collapse. The primary source may have been meltwater from the Antarctic ice sheet. Other studies suggest a Northern Hemisphere source for the meltwater in the Laurentide ice sheet.[17]
Recently, it has become widely accepted that late Holocene, 3,000 calendar years ago to present, sea level was nearly stable prior to an acceleration of rate of rise that is variously dated between 1850 and 1900 AD. Late Holocene rates of sea level rise have been estimated using evidence from archaeological sites and late Holocene tidal marsh sediments, combined with tide gauge and satellite records and geophysical modeling. For example, this research included studies of Roman wells in Caesarea and of Roman piscinae in Italy. These methods in combination suggest a mean eustatic component of 0.07 mm/yr for the last 2000 years.[14]
Since 1880, the ocean began to rise briskly, climbing a total of 210 mm (8.3 in) through 2009 causing extensive erosion worldwide and costing billions.[18][19]
Sea level rose by 6 cm during the 19th century and 19 cm in the 20th century.[20] Evidence for this includes geological observations, the longest instrumental records and the observed rate of 20th century sea level rise. For example, geological observations indicate that during the last 2,000 years, sea level change was small, with an average rate of only 0.0–0.2 mm per year. This compares to an average rate of 1.7 ± 0.5 mm per year for the 20th century.[21] Baart et al. (2012) show that it is important to account for the effect of the 18.6-year lunar nodal cycle before acceleration in sea level rise should be concluded.[22] Based on tide gauge data, the rate of global average sea level rise during the 20th century lies in the range 0.8 to 3.3 mm/yr, with an average rate of 1.8 mm/yr.[23]
References
| The Wikibook Historical Geology has a page on the topic of: Sea level variations |
- ↑ Hallam et al. (1983) and "Exxon", composite from several reconstructions published by the Exxon corporation (Haq et al. 1987, Ross & Ross 1987, Ross & Ross 1988). Both curves are adjusted to the 2004 ICS geologic timescale. Hallam et al. and Exxon use very different techniques to measuring global sea level changes. Hallam's approach is qualitative and relies on regional scale observations from exposed geologic sections and estimates of the areas of flooded continental interiors. Exxon's approach relies on the interpretation of seismic profiles to determine the extent of coastal onlap in subsequently buried sedimentary basins.
- ↑ Murray-Wallace, C. V., & Woodroffe, C. D. (n.d.). Pleistocene sea-level changes. Quaternary Sea-Level Changes, 256–319. doi:10.1017/cbo9781139024440.007.
- ↑ J Imbrie; J Z Imbrie (1980). "Modeling the Climatic Response to Orbital Variations". Science. 207 (4434): 943–953. Bibcode:1980Sci...207..943I. doi:10.1126/science.207.4434.943. PMID 17830447. "NOAA Paleoclimatology Program – Orbital Variations and Milankovitch Theory".
- ↑ Berger A, Loutre MF (2002). "Climate: An exceptionally long interglacial ahead?". Science. 297 (5585): 1287–8. doi:10.1126/science.1076120. PMID 12193773. A. Ganopolski, R. Winkelmann & H. J. Schellnhuber (2016). "Critical insolation–CO2 relation for diagnosing past and future glacial inception". Nature. 529: 200–203. Bibcode:2016Natur.529..200G. doi:10.1038/nature16494. PMID 26762457. M. F. Loutre, A. Berger, "Futurew Climatic Changes: Are We Entering an Exceptionally Long Interglacial?", Climatic Change 46 (2000), 61-90.
- ↑ Rignot, Eric; I. Velicogna; M. R. van den Broeke; A. Monaghan; J. T. M. Lenaerts (March 2011). "Acceleration of the contribution of the Greenland and Antarctic ice sheets to sea level rise". Geophysical Research Letters. 38 (5). Bibcode:2011GeoRL..38.5503R. doi:10.1029/2011GL046583. Retrieved 25 April 2013.
- ↑ Chao, B. F.; Y. H. Wu; Y. S. Li (April 2008). "Impact of Artificial Reservoir Water Impoundment on Global Sea Level". Science. 320 (5873): 212–214. Bibcode:2008Sci...320..212C. doi:10.1126/science.1154580. PMID 18339903.
- ↑ Konikow (September 2011). "Contribution of global groundwater depletion since 1900 to sea-level rise". Geophysical Research Letters. 38 (17). Bibcode:2011GeoRL..3817401K. doi:10.1029/2011GL048604.
- ↑ "Climate Change 2001: The Scientific Basis".
|contribution=ignored (help) - ↑ Geologic Contral on Fast Ice Flow – West Antarctic Ice Sheet Archived 2016-03-04 at the Wayback Machine.. by Michael Studinger, Lamont-Doherty Earth Observatory
- ↑ GRID-Arendal. "Climate Change 2001: The Scientific Basis". Archived from the original on 2011-05-14. Retrieved 2005-12-19.
|contribution=ignored (help) - ↑ Müller, R. Dietmar; et al. (2008-03-07). "Long-Term Sea-Level Fluctuations Driven by Ocean Basin Dynamics". Science. 319 (5868): 1357–1362. Bibcode:2008Sci...319.1357M. doi:10.1126/science.1151540. PMID 18323446.
- ↑ Shepherd A, Ivins ER, A G, Barletta VR, Bentley MJ, Bettadpur S, Briggs KH, Bromwich DH, Forsberg R, Galin N, Horwath M, Jacobs S, Joughin I, King MA, Lenaerts JT, Li J, Ligtenberg SR, Luckman A, Luthcke SB, McMillan M, Meister R, Milne G, Mouginot J, Muir A, Nicolas JP, Paden J, Payne AJ, Pritchard H, Rignot E, Rott H, Sørensen LS, Scambos TA, Scheuchl B, Schrama EJ, Smith B, Sundal AV, van Angelen JH, van de Berg WJ, van den Broeke MR, Vaughan DG, Velicogna I, Wahr J, Whitehouse PL, Wingham DJ, Yi D, Young D, Zwally HJ (Nov 30, 2012). "A reconciled estimate of ice-sheet mass balance". Science. 338 (6111): 1183–1189. Bibcode:2012Sci...338.1183S. doi:10.1126/science.1228102. PMID 23197528. Retrieved 23 Mar 2013.
- ↑ Haq, B. U.; Schutter, SR (2008). "A Chronology of Paleozoic Sea-Level Changes". Science. 322 (5898): 64–8. Bibcode:2008Sci...322...64H. doi:10.1126/science.1161648. PMID 18832639.
- 1 2 Cronin, T. M. (2012) Invited review: Rapid sea-level rise. Quaternary Science Reviews. 56:11-30.
- 1 2 Blanchon, P. (2011a) Meltwater Pulses. In: Hopley, D. (Ed), Encyclopedia of Modern Coral Reefs: Structure, form and process. Springer-Verlag Earth Science Series, p. 683-690. ISBN 978-90-481-2638-5
- ↑ Blanchon, P. (2011b) Backstepping. In: Hopley, D. (Ed), Encyclopedia of Modern Coral Reefs: Structure, form and process. Springer-Verlag Earth Science Series, p. 77-84. ISBN 978-90-481-2638-5
- 1 2 Blanchon, P., and Shaw, J. (1995) Reef drowning during the last deglaciation: evidence for catastrophic sea-level rise and icesheet collapse. Geology, 23:4–8.
- ↑ Church, John A.; White, Neil J. "Sea-Level Rise from the Late 19th to the Early 21st Century". Surveys in Geophysics. 32 (4–5). doi:10.1007/s10712%20%20-011-9119-1. ISSN 0169-3298.
- ↑ GILLIS, JUSTIN (22 February 2016). "Seas Are Rising at Fastest Rate in Last 28 Centuries". New York Times. Retrieved 29 February 2016.
- ↑ Jevrejeva, Svetlana; J. C. Moore; A. Grinsted; P. L. Woodworth (April 2008). "Recent global sea level acceleration started over 200 years ago?". Geophysical Research Letters. 35 (8). Bibcode:2008GeoRL..35.8715J. doi:10.1029/2008GL033611.
- ↑ Bindoff et al., Chapter 5: Observations: Oceanic Climate Change and Sea Level, Executive summary, in IPCC AR4 WG1 2007.
- ↑ BAART, F.; VAN GELDER, P.H.A.J.M.; DE RONDE, J.; VAN KONINGSVELD, M., & WOUTERS, B. (September 20, 2011). "The effect of the 18.6-year lunar nodal cycle on regional sea-level rise estimates".
- ↑ Anisimov et al., Chapter 11: Changes in Sea Level, Table 11.9, in IPCC TAR WG1 2001.