Number of Electoral Votes Per Popular Vote
(This does not include numbers for 3rd-Party Candidates)
For each set of 3 columns, column 3 = column 1 divided by column 2 (and then multiply by 10^6 to get a more user-friendly number).
Chronological Table
| Election Year |
1832[1] | 2004 | 2008 | 2012 | 2016 | ||||||||||||
|---|---|---|---|---|---|---|---|---|---|---|---|---|---|---|---|---|---|
| # of Electoral Votes | # of Popular Votes | # of electoral votes Per million popular vote |
# of Electoral Votes | # of Popular Votes | # of electoral votes Per million popular vote |
# of Electoral Votes | # of Popular Votes | # of electoral votes Per million popular vote |
# of Electoral Votes | # of Popular Votes | # of electoral votes Per million popular vote |
# of Electoral Votes | # of Popular Votes | # of electoral votes Per million popular vote | |||
| State | |||||||||||||||||
| Alabama | 7 | 14,291 | 489.81877 | 9 | 1,870,327 | 4.81199 | 9 | 2,080,025 | 4.32687 | 9 | 2,051,621 | 4.38678 | 9 | 2,040,135 | 4.41147 | ||
| Alaska | 3 | 301,914 | 9.93660 | 3 | 317,435 | 9.45075 | 3 | 287,316 | 10.44147 | 3 | 223,422 | 13.42750 | |||||
| Arizona | 10 | 1,997,818 | 5.00546 | 10 | 2,264,818 | 4.41537 | 11 | 2,258,886 | 4.86966 | 11 | 2,342,635 | 4.69557 | |||||
| Arkansas | 6 | 1,042,851 | 5.75346 | 6 | 1,060,327 | 5.65863 | 6 | 1,042,153 | 5.75731 | 6 | 1,056,680 | 5.67816 | |||||
| California | 55 | 12,255,311 | 4.48785 | 55 | 13,286,254 | 4.13962 | 55 | 12,694,243 | 4.33267 | 55 | 10,190,815 | 5.39702 | |||||
| Colorado | 9 | 2,102,987 | 4.27963 | 9 | 2,362,262 | 3.80991 | 9 | 2,508,344 | 3.58802 | 9 | 2,515,916 | 3.57723 | |||||
| Connecticut | 8 | 32,833 | 243.65730 | 7 | 1,551,314 | 4.51230 | 7 | 1,627,200 | 4.30187 | 7 | 1,539,975 | 4.54553 | 7 | 1,568,290 | 4.46346 | ||
| Delaware | 3 | 8,386 | 357.73909 | 3 | 371,812 | 8.06859 | 3 | 407,833 | 7.35595 | 3 | 408,068 | 7.35172 | 3 | 420,684 | 7.13124 | ||
| Florida | 27 | 7,548,066 | 3.57708 | 27 | 8,327,698 | 3.24219 | 29 | 8,401,203 | 3.45189 | 29 | 9,117,365 | 3.18074 | |||||
| Georgia | 11 | 20,750 | 530.12048 | 15 | 3,280,403 | 4.57261 | 15 | 3,892,882 | 3.85319 | 16 | 3,852,515 | 4.15313 | 16 | 3,966,973 | 4.03330 | ||
| Hawaii | 4 | 425,899 | 9.39190 | 4 | 446,437 | 8.95983 | 4 | 427,673 | 9.35294 | 4 | 395,642 | 10.11015 | |||||
| Idaho | 4 | 590,333 | 6.77584 | 4 | 639,452 | 6.25536 | 4 | 633,698 | 6.31216 | 4 | 596,876 | 6.70156 | |||||
| Illinois | 5 | 21,481 | 232.76384 | 21 | 5,237,496 | 4.00955 | 21 | 5,450,527 | 3.85284 | 20 | 5,154,728 | 3.87993 | 20 | 5,095,677 | 3.92490 | ||
| Indiana | 9 | 47,023 | 191.39570 | 11 | 2,448,449 | 4.49264 | 11 | 2,719,687 | 4.04458 | 11 | 2,573,430 | 4.27445 | 11 | 2,588,173 | 4.25010 | ||
| Iowa | 7 | 1,493,855 | 4.68586 | 7 | 1,511,319 | 4.63172 | 6 | 1,553,161 | 3.86309 | 6 | 1,453,102 | 4.12910 | |||||
| Kansas | 6 | 1,171,449 | 5.12186 | 6 | 1,214,420 | 4.94063 | 6 | 1,133,360 | 5.29399 | 6 | 1,070,797 | 5.60330 | |||||
| Kentucky | 15 | 79,741 | 188.10900 | 8 | 1,782,172 | 4.48890 | 8 | 1,800,447 | 4.44334 | 8 | 1,766,560 | 4.52858 | 8 | 1,831,776 | 4.36735 | ||
| Louisiana | 5 | 6,337 | 789.01689 | 9 | 1,922,468 | 4.68148 | 9 | 1,931,264 | 4.66016 | 8 | 1,961,403 | 4.07871 | 8 | 1,957,539 | 4.08676 | ||
| Maine | 10 | 62,153 | 160.89328 | 4 | 727,043 | 5.50174 | 4 | 717,196 | 5.57728 | 4 | 693,582 | 5.76716 | 4 | 689,711 | 5.79953 | ||
| Maryland | 10 | 38,316 | 260.98758 | 10 | 2,359,196 | 4.23873 | 10 | 2,589,329 | 3.86200 | 10 | 2,649,713 | 3.77399 | 10 | 2,371,597 | 4.21657 | ||
| Massachusetts | 14 | 60,588 | 231.06886 | 12 | 2,874,909 | 4.17405 | 12 | 3,012,951 | 3.98281 | 11 | 3,109,604 | 3.53743 | 11 | 3,047,837 | 3.60912 | ||
| Michigan | 17 | 4,792,929 | 3.54689 | 17 | 4,921,218 | 3.45443 | 16 | 4,679,825 | 3.41893 | 16 | 4,542,721 | 3.52212 | |||||
| Minnesota | 10 | 2,791,709 | 3.58204 | 10 | 2,848,763 | 3.51030 | 10 | 2,866,392 | 3.48871 | 10 | 2,690,350 | 3.71699 | |||||
| Mississippi | 4 | 5,750 | 695.65217 | 6 | 1,143,075 | 5.24900 | 6 | 1,279,259 | 4.69022 | 6 | 1,273,695 | 4.71070 | 6 | 1,140,401 | 5.26131 | ||
| Missouri | 4 | 5,192 | 770.41602 | 11 | 2,714,884 | 4.05174 | 11 | 2,887,725 | 3.80923 | 10 | 2,706,236 | 3.69517 | 10 | 2,640,642 | 3.78696 | ||
| Montana | 3 | 439,773 | 6.82170 | 3 | 474,430 | 6.32338 | 3 | 469,767 | 6.38614 | 3 | 448,641 | 6.68686 | |||||
| Nebraska | 5 | 767,142 | 6.51770 | 5 | 786,298 | 6.35891 | 5 | 777,145 | 6.43381 | 5 | 759,677 | 6.58174 | |||||
| Nevada | 5 | 815,880 | 6.12835 | 5 | 946,563 | 5.28227 | 6 | 994,940 | 6.03051 | 6 | 1,049,072 | 5.71934 | |||||
| New Hampshire | 7 | 43,793 | 159.84290 | 4 | 671,748 | 5.95461 | 4 | 701,360 | 5.70321 | 4 | 699.479 | 5.71854 | 4 | 694,307 | 5.76114 | ||
| New Jersey | 8 | 47,760 | 167.50419 | 15 | 3,581,433 | 4.18827 | 15 | 3,828,629 | 3.91785 | 14 | 3,602,669 | 3.88601 | 14 | 3,477,132 | 4.02631 | ||
| New Mexico | 5 | 747,872 | 6.68564 | 5 | 819,254 | 6.10311 | 5 | 751,123 | 6.65670 | 5 | 704,880 | 7.09341 | |||||
| New York | 42 | 323,393 | 129.87294 | 31 | 7,276,847 | 4.26009 | 31 | 7,557,716 | 4.10177 | 29 | 6,976,172 | 4.15701 | 29 | 6,789,494 | 4.27131 | ||
| North Carolina | 15 | 29,799 | 503.37260 | 15 | 3,487,015 | 4.30167 | 15 | 4,271,125 | 3.51196 | 15 | 4,448,786 | 3.37171 | 15 | 4,529,651 | 3.31151 | ||
| North Dakota | 3 | 307,703 | 9.74966 | 3 | 309,879 | 9.68120 | 3 | 312,990 | 9.58497 | 3 | 310,552 | 9.66022 | |||||
| Ohio | 21 | 158,294 | 132.66454 | 20 | 5,600,935 | 3.57083 | 20 | 5,617,864 | 3.56007 | 18 | 5,489,143 | 3.27920 | 18 | 5,088,985 | 3.53705 | ||
| Oklahoma | 7 | 1,463,758 | 4.78221 | 7 | 1,462,661 | 4.78580 | 7 | 1,334,872 | 5.24395 | 7 | 1,367,722 | 5.11800 | |||||
| Oregon | 7 | 1,809,994 | 3.86742 | 7 | 1,775,766 | 3.94196 | 7 | 1,724,663 | 4.05876 | 7 | 1,763,061 | 3.97037 | |||||
| Pennsylvania | 30 | 158,638 | 189.10980 | 21 | 5,731,942 | 3.66368 | 21 | 5,932,248 | 3.53997 | 20 | 5,670,708 | 3.52690 | 20 | 5,745,002 | 3.48129 | ||
| Rhode Island | 4 | 4,936 | 810.37277 | 4 | 428,811 | 9.32812 | 4 | 461,962 | 8.65872 | 4 | 436,881 | 9.15581 | 4 | 432,780 | 9.24257 | ||
| South Carolina | [2] | 8 | 1,599,673 | 5.00102 | 8 | 1,897,345 | 4.21642 | 9 | 1,937,586 | 4.64496 | 9 | 1,993,080 | 4.51562 | ||||
| South Dakota | 3 | 381,828 | 7.85694 | 3 | 373,978 | 8.02186 | 3 | 355,649 | 8.43528 | 3 | 345,143 | 8.69205 | |||||
| Tennessee | 15 | 29,425 | 509.77060 | 11 | 2,420,852 | 4.54385 | 11 | 2,566,615 | 4.28580 | 11 | 2,423,039 | 4.53975 | 11 | 2,384,512 | 4.61310 | ||
| Texas | 34 | 7,359,621 | 4.61980 | 34 | 8,004,961 | 4.24737 | 38 | 7,877,967 | 4.82358 | 38 | 8,551,643 | 4.44359 | |||||
| Utah | 5 | 904,941 | 5.52522 | 5 | 923,700 | 5.41301 | 6 | 992,413 | 6.04587 | 6 | 670,012 | 8.95506 | |||||
| Vermont | 7 | 32,128 | 217.87849 | 3 | 305,247 | 9.82811 | 3 | 318,236 | 9.42697 | 3 | 291,937 | 10.27619 | 3 | 273,942 | 10.95122 | ||
| Virginia | 23 | 45,682 | 503.48058 | 13 | 3,171,701 | 4.09875 | 13 | 3,684,537 | 3.52826 | 13 | 3,794,342 | 3.42615 | 13 | 3,750,916 | 3.46582 | ||
| Washington | 11 | 2,815,095 | 3.90751 | 11 | 2,980,064 | 3.69120 | 12 | 3,046,066 | 3.93951 | 12 | 2,939,891 | 4.08178 | |||||
| Washington, D.C. | 3 | 224,226 | 13.37936 | 3 | 263,167 | 11.39961 | 3 | 288,451 | 10.40038 | 3 | 271,776 | 11.03850 | |||||
| West Virginia | 5 | 750,319 | 6.66383 | 5 | 701,323 | 7.12938 | 5 | 655,924 | 7.62283 | 5 | 673,655 | 7.42220 | |||||
| Wisconsin | 10 | 2,967,624 | 3.36970 | 10 | 2,939,604 | 3.40182 | 10 | 3,028,651 | 3.30147 | 10 | 2,791,175 | 3.58272 | |||||
| Wyoming | 3 | 238,405 | 12.58363 | 3 | 247,826 | 12.10527 | 3 | 240,248 | 12.48710 | 3 | 230,392 | 13.02129 | |||||
| TOTALS | 277 | 1,276,689 | 216.9675 | 538 | 121,069,054 | 4.44374 | 538 | 129,443,839 | 4.15624 | 538 | 126,150,215 | 4.24126 | 538 | 123,592,849 | 4.35300 | ||
Graphs
Graphing the numbers in the above table, we obtain the following graphs for each year:

Line graph of the number of electoral votes per million popular votes, 1832 US Presidential Election

Line graph of the number of electoral votes per million popular votes, 2004 US Presidential Election
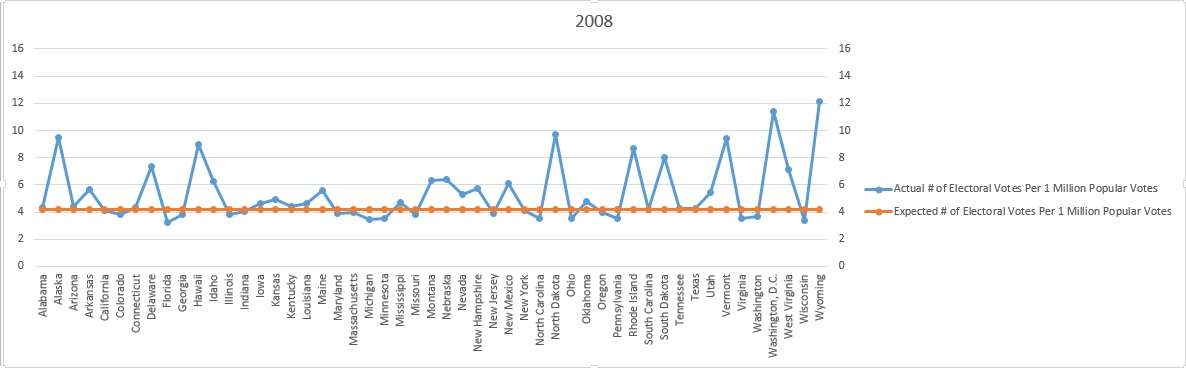
Line graph of the number of electoral votes per million popular votes, 2008 US Presidential Election
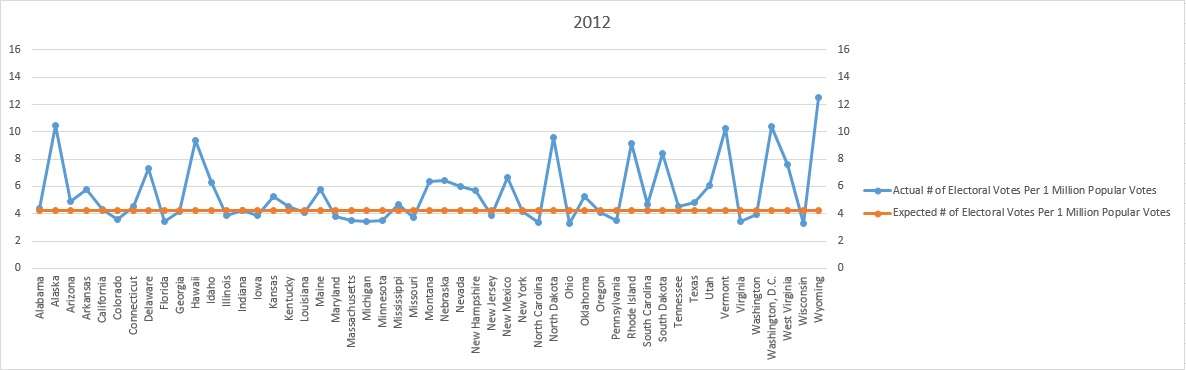
Line graph of the number of electoral votes per million popular votes, 2012 US Presidential Election

Line graph of the number of electoral votes per million popular votes, 2016 US Presidential Election
References
This article is issued from
Wikipedia.
The text is licensed under Creative Commons - Attribution - Sharealike.
Additional terms may apply for the media files.