Northwest Territories Northwest Territories electoral district Northwest Territories electoral district |
|---|
 |
| Federal electoral district |
|---|
| Legislature |
House of Commons |
|---|
| MP |
Michael McLeod
Liberal |
|---|
| District created |
1976 |
|---|
| First contested |
1979 |
|---|
| Last contested |
2015 |
|---|
| District webpage |
profile, map |
|---|
| Demographics |
|---|
| Population (2011)[1] |
41,462 |
|---|
| Electors (2015) |
28,795 |
|---|
| Area (km²)[2] |
1,346,106 |
|---|
| Pop. density (per km²) |
0.03 |
|---|
| Census divisions |
Region 1, Region 2, Region 3, Region 4, Region 5, Region 6 |
|---|
| Census subdivisions |
Yellowknife, Hay River, Inuvik, Fort Smith, Behchokò, Fort Simpson, Tuktoyaktuk, Fort McPherson, Norman Wells, Fort Providence |
|---|
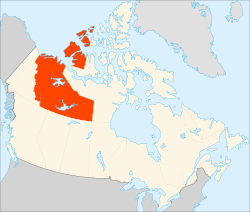
Northwest Territories (French: Territoires du Nord-Ouest) is a federal electoral district represented in the House of Commons of Canada.
This riding was created in 1962 from Mackenzie River riding. It was composed of the entire territory of the Northwest Territories. In 1979, the riding was divided into the ridings of Western Arctic and Nunatsiaq (later Nunavut). Following the creation of the territory of Nunavut in 1999, the riding of Western Arctic was made coterminous with the new Northwest Territories.
After 1999, Western Arctic was an anomaly in that, unlike Nunavut and Yukon, it did not share the name of the territory with which it was coterminous. This did not change with subsequent representation orders because the electoral boundaries revision process did not affect the territories and the territorial riding names were specified in law. In 2014, at the behest of Western Arctic MP Dennis Bevington, the riding name was changed to Northwest Territories by Bill C-37, which also changed the names of several other ridings scheduled to come into effect with the representation order for the next election. Unlike those names, the change to Northwest Territories came into effect immediately as it involved amending the Electoral Boundaries Readjustment Act itself.[3][4]
From 1887 to 1905, the only areas of the NWT with representation in Parliament were those areas that became part of present-day provinces (Alberta, Saskatchewan and western Manitoba). From 1905 to 1947, the NWT was not represented in Parliament. From 1947 to 1962, the southwestern NWT was represented only by the electoral district of Yukon—Mackenzie River and then Mackenzie River. In 1962, the electoral district of NWT was created to represent the entire territory, for the first time giving all Canadian territory a representative in Parliament.
This riding's boundaries remained the same following the 2012 redistribution.
Demographics
- According to the Canada 2016 Census
- Twenty most common mother tongue languages (2016) : 78.3% English, 3.9% Dogrib, 2.9% French, 1.9% North Slavey, 1.8% South Slavey, 1.8% Tagalog, 1.2% Inuinnaqtun, 1.1% Dene, 0.4% German, 0.4% Vietnamese, 0.3% Gwich'in, 0.3% Arabic, 0.3% Cree, 0.3% Cantonese, 0.3% Inuktitut, 0.3% Spanish, 0.2% Ilocano, 0.2% Bengali, 0.2% Japanese, 0.2% Cebuano, 0.2% Mandarin[5]
Members of Parliament
Following the division into Western Arctic and Nunatsiaq, the riding's first MP was Progressive Conservative MP Dave Nickerson, who was first elected in 1979 and re-elected twice. In the 1988 election, Nickerson was defeated by Liberal Ethel Blondin-Andrew who went on to serve as the riding's MP for eighteen years, including two years as Minister of State for Northern Development. In 2006, Blondin-Andrew was defeated by New Democrat Dennis Bevington. The earlier riding of Northwest Territories had been represented by New Democrat Wally Firth from 1972 to 1979.
This riding has elected the following Members of Parliament:
Election results
Northwest Territories (2014–present)
| Canadian federal election, 2015 |
| Party |
Candidate |
Votes | % | ±% | Expenditures |
|
Liberal | Michael McLeod | 9,172 | 48.34 | +29.90 | $71,207.71 |
|
New Democratic | Dennis Bevington | 5,783 | 30.48 | -15.36 | $37,599.86 |
|
Conservative | Floyd Roland | 3,481 | 18.35 | -13.76 | – |
|
Green | John Moore | 537 | 2.83 | -0.23 | – |
| Total valid votes/Expense limit |
18,973 | 100.00 | | $214,028.20 |
| Total rejected ballots |
104 | 0.55 | – |
| Turnout |
19,077 | 64.82 | – |
| Eligible voters |
29,432 |
|
Liberal gain from New Democratic |
Swing |
+22.63
|
| Source: Elections Canada[6][7] |
Western Arctic (1979–2014)
| Canadian federal election, 2008 |
| Party |
Candidate |
Votes | % | ±% | Expenditures |
|
New Democratic | Dennis Bevington | 5,669 | 41.44 | -0.99 | $39,961 |
|
Conservative | Brendan Bell | 5,146 | 37.62 | +17.14 | $84,329 |
|
Liberal | Gabrielle Mackenzie-Scott | 1,858 | 13.58 | -21.7 | $37,884 |
|
Green | Sam Gamble | 752 | 5.49 | +3.65 | $9,010 |
|
First Peoples National | Noeline Villebrun | 252 | 1.84 | – | – |
| Total valid votes |
13,677 | 100.0 |
| Total rejected ballots |
56 | 0.41 |
| Turnout |
13,733 | 47.71 |
| Eligible voters |
28,787 |
|
New Democratic hold |
Swing |
-9.06
|
| Canadian federal election, 2004 |
| Party |
Candidate |
Votes | % | ±% | Expenditures |
|
Liberal | Ethel Blondin-Andrew | 5,317 | 39.44 | -6.15 | $58,782 |
|
New Democratic | Dennis Bevington | 5,264 | 39.05 | +12.34 | $39,504 |
|
Conservative | Sean Mandeville | 2,314 | 17.16 | -10.52 | $16,863 |
|
Green | Chris O'Brien | 583 | 4.32 | – | $2,754 |
| Total valid votes |
13,478 | 100.0 |
| Total rejected ballots |
69 | 0.51 |
| Turnout |
13,547 | 47.33 |
|
Liberal hold |
Swing |
-9.24
|
| Change for the Conservatives is based on the combined totals of the Canadian Alliance and the Progressive Conservatives. |
| Canadian federal election, 2000 |
| Party |
Candidate |
Votes | % | ±% | Expenditures |
|
Liberal | Ethel Blondin-Andrew | 5,855 | 45.59 | +3.96 | $56,498 |
|
New Democratic | Dennis Bevington | 3,430 | 26.71 | +7.42 | $27,323 |
|
Alliance | Fred Turner | 2,273 | 17.70 | +2.99 | $15,406 |
|
Progressive Conservative | Bruce McLaughlin | 1,687 | 9.98 | -2.64 | $8,374 |
| Total valid votes |
12,840 | 100.0 |
| Total rejected ballots |
72 | 0.56 |
| Turnout |
12,912 | 52.24 |
|
Liberal hold |
Swing |
-1.73
|
| Change for the Canadian Alliance is based on the Reform Party. |
| Canadian federal election, 1997 |
| Party |
Candidate |
Votes | % | ±% | Expenditures |
|
Liberal | Ethel Blondin-Andrew | 5,564 | 41.63 | -20.84 | $56,834 |
|
New Democratic | Mary Beth Levan | 2,579 | 19.29 | +12.98 | $22,393 |
|
Reform | Mike Watt | 1,966 | 14.71 | +0.62 | $4,546 |
|
Progressive Conservative | Bob Dowdall | 1,687 | 12.62 | -0.71 | $16,020 |
|
Independent | Wally Firth | 1,567 | 11.72 | – | $8,857 |
| Total valid votes |
13,363 | 100.0 |
| Total rejected ballots |
94 | 0.70 |
| Turnout |
13,457 | 58.37 |
|
Liberal hold |
Swing |
-16.91
|
Northwest Territories (1962–1974)
Federal riding associations
Riding associations are the local branches of the national political parties:
| Party |
Association Name |
CEO |
HQ Address |
HQ City |
|
Conservative |
Western Arctic Conservative Association |
Bill Aho |
5523 44th Street |
Yellowknife |
|
Green |
Green Party of Canada — Western Arctic |
Jessica Gamble |
15 Gitzel Street |
Yellowknife |
|
Liberal |
Northwest Territories Federal Liberal Association |
Chuck Blyth |
PO BOX 965 |
Yellowknife |
|
New Democratic |
Western Arctic Federal NDP Riding Association |
Shane Pyke |
PO BOX 2185 |
Yellowknife |