Northumberland County Council election, 2013
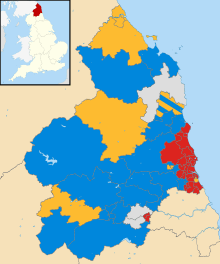
Map of the results of the 2013 local election.
Elections to Northumberland County Council were held on 2 May 2013. The full council was up for election, with each successful candidate serving a four-year term of office, expiring in 2017.
The council remained in no overall control with the Labour Party becoming the largest party, holding 32 out of 67 seats on the council. Of the remaining 35 seats on the council, the Conservative Party won the 21 seats, the Liberal Democrats won 11 seats and Independents won 3 seats. [1]
Results
| Party | Seats | Gains | Losses | Net gain/loss | Seats % | Votes % | Votes | +/− | |
|---|---|---|---|---|---|---|---|---|---|
| Labour | 32 | 47.76 | 35.07 | 29,793 | |||||
| Conservative | 21 | 31.34 | 30.74 | 26,123 | |||||
| Liberal Democrat | 11 | 16.42 | 21.15 | 17,964 | |||||
| Independent | 3 | 4.48 | 5.75 | 4,881 | |||||
| UKIP | 0 | 6.79 | 5,764 | ||||||
| Green | 0 | 0.50 | 424 | ||||||
The overall turnout was 34.03% with a total of 84,949 valid votes cast. A total of 726 ballots were rejected.
Council Composition
Following the election, the composition of the council was:
| 32 | 21 | 11 | 3 |
| Labour | Conservative | Liberal Democrat | IND |
IND - Independent
Ward results
[2].
Alnwick
| Party | Candidate | Votes | % | ± | |
|---|---|---|---|---|---|
| Conservative | Gordon Castle | 1,128 | 20.03 | ||
| Liberal Democrat | Lydia Heather Cairns | 1,008 | 17.90 | ||
| Liberal Democrat | Clare Margaret Mills | 929 | 16.50 | ||
| Conservative | Bruce Hewison | 767 | 13.62 | ||
| UKIP | Michael John Weatheritt | 594 | 10.55 | ||
| UKIP | Margaret Weatheritt | 482 | 8.56 | ||
| Labour | William Grisdale | 461 | 8.19 | ||
| Labour | Mary Pidcock | 262 | 4.65 | ||
| Majority | 79 | 1.40 | |||
| Turnout | 5,631 | 37.2 | |||
| Conservative hold | Swing | ||||
| Liberal Democrat hold | Swing | ||||
Amble
| Party | Candidate | Votes | % | ± | |
|---|---|---|---|---|---|
| Labour | George Robert Arckless | 575 | 69.87 | ||
| Conservative | Peter Robinson | 162 | 19.68 | ||
| Liberal Democrat | Roger Cashmore | 86 | 10.45 | ||
| Majority | 413 | 50.19 | |||
| Turnout | 823 | ||||
| Labour hold | Swing | ||||
Amble West with Warkworth
| Party | Candidate | Votes | % | ± | |
|---|---|---|---|---|---|
| Conservative | Amble West with Warkworth | 432 | 27.73 | ||
| Liberal Democrat | Juliet Hedda Pörksen | 431 | 27.66 | ||
| UKIP | Leslie George Herbert Bilboe | 260 | 16.69 | ||
| Independent | Dorothy Ann Burke | 222 | 14.25 | ||
| Labour | Paul Claridge | 213 | 13.67 | ||
| Majority | 1 | 0.07 | |||
| Turnout | 1,558 | 45.5 | |||
| Conservative hold | Swing | ||||
Ashington Central
| Party | Candidate | Votes | % | ± | |
|---|---|---|---|---|---|
| Labour | Thomas Sinclair Wilson | 795 | 90.34 | ||
| Conservative | John Ridley Wearmouth | 85 | 9.66 | ||
| Majority | 710 | 80.68 | |||
| Turnout | 880 | 23.87 | |||
| Labour hold | Swing | ||||
Bamburgh
| Party | Candidate | Votes | % | ± | |
|---|---|---|---|---|---|
| Conservative | John Crawford Woodman | 813 | 56.85 | ||
| Liberal Democrat | David John Holwell | 463 | 32.38 | ||
| Labour | Nicola Morrison | 154 | 10.77 | ||
| Majority | 350 | 24.47 | |||
| Turnout | 1,430 | 39.9 | |||
| Conservative hold | Swing | ||||
Bedlington Central
| Party | Candidate | Votes | % | ± | |
|---|---|---|---|---|---|
| Labour | Alyson Wallace | 606 | 57.55 | ||
| Liberal Democrat | Arthur Holland Pegg | 234 | 22.22 | ||
| Conservative | Paul Robert Aynsley | 213 | 20.23 | ||
| Majority | 372 | 35.33 | |||
| Turnout | 1,053 | 28.64 | |||
| Labour hold | Swing | ||||
Bedlington East
| Party | Candidate | Votes | % | ± | |
|---|---|---|---|---|---|
| Labour | Valerie Tyler | 701 | 85.28 | ||
| Conservative | Edna Elizabeth Rixon | 74 | 9.00 | ||
| Liberal Democrat | Joan Carol Tebbutt | 47 | 5.72 | ||
| Majority | 627 | 76.28 | |||
| Turnout | 822 | 23.84 | |||
| Labour hold | Swing | ||||
Bedlington West
| Party | Candidate | Votes | % | ± | |
|---|---|---|---|---|---|
| Labour | Terence Johnstone | 530 | 46.99 | ||
| Independent | Malcolm Robinson | 286 | 25.35 | ||
| Conservative | Tracy Aynsley | 166 | 14.72 | ||
| Liberal Democrat | Anthony Barrett | 146 | 12.94 | ||
| Majority | 244 | 21.64 | |||
| Turnout | 1,128 | 30.43 | |||
| Labour hold | Swing | ||||
Bellingham
| Party | Candidate | Votes | % | ± | |
|---|---|---|---|---|---|
| Conservative | John Robert Riddle | 867 | 69.03 | ||
| Labour | Alexandra Norah Richards | 228 | 18.15 | ||
| Liberal Democrat | Angus David McCraken | 161 | 12.82 | ||
| Majority | 639 | 50.88 | |||
| Turnout | 1,256 | 39.57 | |||
| Conservative hold | Swing | ||||
Berwick East
| Party | Candidate | Votes | % | ± | |
|---|---|---|---|---|---|
| Liberal Democrat | James Edward Smith | 342 | 45.18 | ||
| Conservative | Georgina Emma Rowley Hill | 253 | 33.42 | ||
| Labour | John Paul Hewit | 162 | 21.40 | ||
| Majority | 89 | 11.76 | |||
| Turnout | 757 | 21.80 | |||
| Liberal Democrat hold | Swing | ||||
Berwick North
| Party | Candidate | Votes | % | ± | |
|---|---|---|---|---|---|
| Liberal Democrat | Gavin William Jones | 456 | 36.6 | ||
| Independent | Brian Alexander Douglas | 365 | 29.29 | ||
| Conservative | Thomas Reginald Forrester | 318 | 25.52 | ||
| Labour | Keith Trobe | 107 | 8.59 | ||
| Majority | 91 | 7.31 | |||
| Turnout | 1,246 | 37.8 | |||
| Liberal Democrat hold | Swing | ||||
Berwick West with Ord
| Party | Candidate | Votes | % | ± | |
|---|---|---|---|---|---|
| Liberal Democrat | Elizabeth Isabel Hunter | 558 | 57.76 | ||
| Conservative | John William Stephenson | 296 | 30.64 | ||
| Labour | Anthony George Reay | 112 | 11.60 | ||
| Majority | 262 | 27.12 | |||
| Turnout | 966 | 31.90 | |||
| Liberal Democrat hold | Swing | ||||
Bothal
| Party | Candidate | Votes | % | ± | |
|---|---|---|---|---|---|
| Labour | Lynne Grimshaw | 666 | 54.37 | ||
| Liberal Democrat | Simon Luke Reed | 479 | 39.10 | ||
| Conservative | Jack Alexander Gebhard | 80 | 6.53 | ||
| Majority | 187 | 15.27 | |||
| Turnout | 1,225 | 34.33 | |||
| Labour hold | Swing | ||||
Bywell
| Party | Candidate | Votes | % | ± | |
|---|---|---|---|---|---|
| Independent | Paul Kelly | 559 | 38.66 | ||
| Conservative | Fiona Mary Hunter | 423 | 29.26 | ||
| Liberal Democrat | Andrew Haddon | 232 | 16.04 | ||
| Labour | John Robert Temple | 232 | 16.04 | ||
| Majority | 136 | 9.41 | |||
| Turnout | 1,446 | 40.52 | |||
| Independent hold | Swing | ||||
Choppington
| Party | Candidate | Votes | % | ± | |
|---|---|---|---|---|---|
| Labour | David Ledger | 688 | 81.90 | ||
| Conservative | Rachel Elizabeth Moore | 152 | 18.10 | ||
| Majority | 536 | 63.80 | |||
| Turnout | 840 | 22.86 | |||
| Labour hold | Swing | ||||
College
| Party | Candidate | Votes | % | ± | |
|---|---|---|---|---|---|
| Labour | James Sawyer | 878 | 90.70 | ||
| Conservative | Charlotte Elizabeth Peacock | 90 | 9.30 | ||
| Majority | 788 | 81.40 | |||
| Turnout | 968 | 25.50 | |||
| Labour hold | Swing | ||||
Corbridge
| Party | Candidate | Votes | % | ± | |
|---|---|---|---|---|---|
| Conservative | Jean Barbara Fearon | 704 | 61.06 | ||
| Labour | Gillian Richardson | 286 | 24.80 | ||
| Liberal Democrat | Philip Ronald Latham | 163 | 14.14 | ||
| Majority | 418 | 36.26 | |||
| Turnout | 1,153 | 33.32 | |||
| Conservative hold | Swing | ||||
Cowpen
| Party | Candidate | Votes | % | ± | |
|---|---|---|---|---|---|
| Labour | Susan Davey | 483 | 52.16 | ||
| UKIP | Barry William Elliott | 380 | 41.04 | ||
| Conservative | Connor Graham Rumble | 32 | 3.45 | ||
| Liberal Democrat | Alisdair Lindsey Gibbs-Barton | 31 | 3.35 | ||
| Majority | 103 | 11.12 | |||
| Turnout | 926 | 28.20 | |||
| Labour hold | Swing | ||||
Cramlington East
| Party | Candidate | Votes | % | ± | |
|---|---|---|---|---|---|
| Labour | Ian Carr Fry Swithenbank | 588 | 78.19 | ||
| Conservative | Anne Charlotte Waggitt | 83 | 11.04 | ||
| Liberal Democrat | Brenda Brechany | 81 | 10.77 | ||
| Majority | 505 | 67.15 | |||
| Turnout | 752 | 24.34 | |||
| Labour hold | Swing | ||||
Cramlington Eastfield
| Party | Candidate | Votes | % | ± | |
|---|---|---|---|---|---|
| Labour | Laura Barbara Pidcock | 665 | 49.04 | ||
| Liberal Democrat | Barrie Crowther | 428 | 31.56 | ||
| Conservative | Christopher Wallis | 263 | 19.40 | ||
| Majority | 237 | 17.48 | |||
| Turnout | 1,356 | 32.16 | |||
| Labour hold | Swing | ||||
Cramlington North
| Party | Candidate | Votes | % | ± | |
|---|---|---|---|---|---|
| Conservative | Wayne Daley | 1,127 | 78.59 | ||
| Labour | Martin John Wright | 267 | 18.62 | ||
| Liberal Democrat | Sandra Armstrong | 40 | 2.79 | ||
| Majority | 860 | 59.97 | |||
| Turnout | 1,434 | 34.86 | |||
| Conservative hold | Swing | ||||
Cramlington South East
| Party | Candidate | Votes | % | ± | |
|---|---|---|---|---|---|
| Labour | Allan Hepple | 742 | 47.26 | ||
| Independent | William Bowers | 300 | 19.11 | ||
| Liberal Democrat | Thomas Brechany | 280 | 17.83 | ||
| Conservative | Lynn Rixon | 248 | 15.80 | ||
| Majority | 442 | 28.15 | |||
| Turnout | 1,570 | 40.21 | |||
| Labour hold | Swing | ||||
Cramlington Village
| Party | Candidate | Votes | % | ± | |
|---|---|---|---|---|---|
| Labour | Kathleen Olivia Graham | 492 | 37.13 | ||
| Liberal Democrat | Alan Rockcliffe Armstrong | 374 | 28.23 | ||
| Conservative | Christopher Patrick Desmond Dorman-O'Gowan | 317 | 23.92 | ||
| Independent | Susan Mary Bryce Johnston | 142 | 10.72 | ||
| Majority | 118 | 8.90 | |||
| Turnout | 1,325 | 36.65 | |||
| Labour hold | Swing | ||||
Cramlington West
| Party | Candidate | Votes | % | ± | |
|---|---|---|---|---|---|
| Conservative | Barry Malcolm Flux | 719 | 54.89 | ||
| Labour | Ian Ayres | 531 | 40.53 | ||
| Liberal Democrat | Michael Robert Gerard Emmett | 60 | 4.58 | ||
| Majority | 188 | 14.36 | |||
| Turnout | 1,310 | 32.52 | |||
| Conservative hold | Swing | ||||
Croft
| Party | Candidate | Votes | % | ± | |
|---|---|---|---|---|---|
| Labour | Kathleen Nisbet | 582 | 71.24 | ||
| Independent | Vincent Coils | 114 | 13.95 | ||
| Conservative | Sheila O'Sullivan | 62 | 7.59 | ||
| Liberal Democrat | Sylvia Calvert | 59 | 7.22 | ||
| Majority | 468 | 57.29 | |||
| Turnout | 817 | 23.76 | |||
| Labour hold | Swing | ||||
Dudridge Bay
| Party | Candidate | Votes | % | ± | |
|---|---|---|---|---|---|
| Labour | Scott James Dickinson | 786 | 63.13 | ||
| Conservative | Daniel John Hedley | 287 | 23.05 | ||
| Liberal Democrat | Carole Lindsay Arkley | 172 | 13.82 | ||
| Majority | 499 | 40.08 | |||
| Turnout | 1,245 | 29.90 | |||
| Labour hold | Swing | ||||
Haltwhistle
| Party | Candidate | Votes | % | ± | |
|---|---|---|---|---|---|
| Conservative | James Ian Hutchinson | 651 | 43.03 | ||
| Labour | Eric David Watson | 554 | 36.61 | ||
| UKIP | Graham Edward Young | 228 | 15.07 | ||
| Liberal Democrat | Niall Alasdair Munro Deas | 80 | 5.29 | ||
| Majority | 97 | 6.42 | |||
| Turnout | 1,513 | 42.06 | |||
| Conservative hold | Swing | ||||
Hartley
| Party | Candidate | Votes | % | ± | |
|---|---|---|---|---|---|
| Labour | Susan Elizabeth Dungworth | 947 | 58.03 | ||
| Liberal Democrat | Anita Cynthia Romer | 423 | 25.92 | ||
| Conservative | Daniel James Carr | 262 | 16.05 | ||
| Majority | 524 | 32.11 | |||
| Turnout | 1,632 | 41.43 | |||
| Labour hold | Swing | ||||
Haydon & Hadrian
| Party | Candidate | Votes | % | ± | |
|---|---|---|---|---|---|
| Liberal Democrat | Alan Sharp | 696 | 45.52 | ||
| Conservative | William Joseph Green | 464 | 30.35 | ||
| UKIP | Melanie Hurst | 205 | 13.41 | ||
| Labour | Mary Annette McGlade Wright | 164 | 10.72 | ||
| Majority | 232 | 15.17 | |||
| Turnout | 1,529 | 44.40 | |||
| Liberal Democrat hold | Swing | ||||
Haydon
| Party | Candidate | Votes | % | ± | |
|---|---|---|---|---|---|
| Labour | Brian Gallacher | 857 | 72.69 | ||
| Liberal Democrat | Andrew Rupert McGregor | 249 | 21.12 | ||
| Conservative | Nicola Ann Bawn | 73 | 6.19 | ||
| Majority | 608 | 51.57 | |||
| Turnout | 1,179 | 32.58 | |||
| Labour hold | Swing | ||||
Hexham Central with Acomb
| Party | Candidate | Votes | % | ± | |
|---|---|---|---|---|---|
| Conservative | Terence Robson | 755 | 48.46 | ||
| Labour | Jane Caroline Wrigley | 537 | 34.47 | ||
| UKIP | Jason Osvaldo Fiori | 177 | 11.36 | ||
| Liberal Democrat | Peter John Arnold | 89 | 5.71 | ||
| Majority | 218 | 13.99 | |||
| Turnout | 1,558 | 44.41 | |||
| Conservative hold | Swing | ||||
Hexham East
| Party | Candidate | Votes | % | ± | |
|---|---|---|---|---|---|
| Conservative | Catherine Robson Homer | 623 | 46.67 | ||
| Labour | Lorna Jane Boyd | 300 | 22.47 | ||
| UKIP | Alan Philipson | 207 | 15.50 | ||
| Liberal Democrat | Judith Elizabeth Lloyd | 205 | 15.36 | ||
| Majority | 323 | 24.20 | |||
| Turnout | 1,335 | 39.17 | |||
| Conservative hold | Swing | ||||
Hexham West
| Party | Candidate | Votes | % | ± | |
|---|---|---|---|---|---|
| Conservative | Colin Cessford | 848 | 48.34 | ||
| Liberal Democrat | Derek Kennedy | 540 | 30.79 | ||
| Labour | David Crockit | 261 | 14.88 | ||
| UKIP | Zoe Philipson | 105 | 5.99 | ||
| Majority | 308 | 17.55 | |||
| Turnout | 1,754 | 52.49 | |||
| Conservative hold | Swing | ||||
Hirst
| Party | Candidate | Votes | % | ± | |
|---|---|---|---|---|---|
| Labour | Kenneth Parry | 518 | 60.73 | ||
| Independent | Pauline Thompson | 306 | 35.87 | ||
| Conservative | Richard Wearmouth | 29 | 3.40 | ||
| Majority | 212 | 24.86 | |||
| Turnout | 853 | 22.76 | |||
| Labour hold | Swing | ||||
Holywell
| Party | Candidate | Votes | % | ± | |
|---|---|---|---|---|---|
| Labour | Bernard Pidcock | 733 | 46.25 | ||
| Liberal Democrat | Robert Marshall Nixon | 449 | 28.33 | ||
| Independent | Robert Watson | 282 | 17.79 | ||
| Conservative | Simon Troy Hartland | 121 | 7.63 | ||
| Majority | 284 | 17.92 | |||
| Turnout | 1,585 | 37.26 | |||
| Labour hold | Swing | ||||
Humshaugh
| Party | Candidate | Votes | % | ± | |
|---|---|---|---|---|---|
| Conservative | Rupert McLure Gibson | 807 | 66.80 | ||
| Labour | Milo Jasper Barnett | 264 | 21.85 | ||
| Liberal Democrat | Paul Steven Harrison | 137 | 11.34 | ||
| Majority | 543 | 44.95 | |||
| Turnout | 1,208 | 35.94 | |||
| Conservative hold | Swing | ||||
Isabella
| Party | Candidate | Votes | % | ± | |
|---|---|---|---|---|---|
| Labour | Gordon Webb | 649 | 80.42 | ||
| Liberal Democrat | Gordon Calvert | 85 | 10.53 | ||
| Conservative | Aaron Spence | 73 | 9.05 | ||
| Majority | 564 | 69.89 | |||
| Turnout | 807 | 24.19 | |||
| Labour hold | Swing | ||||
Kitty Brewster
| Party | Candidate | Votes | % | ± | |
|---|---|---|---|---|---|
| Labour | James Grant Davey | 685 | 73.58 | ||
| Conservative | Katherine McVicar | 131 | 14.07 | ||
| Liberal Democrat | Walter Rickerby | 115 | 12.35 | ||
| Majority | 554 | 59.51 | |||
| Turnout | 931 | 22.80 | |||
| Labour hold | Swing | ||||
Longhorsley
| Party | Candidate | Votes | % | ± | |
|---|---|---|---|---|---|
| Labour | Hugh Glen Howard Sanderson | 994 | 72.35 | ||
| UKIP | David Malcolm Cox | 152 | 11.06 | ||
| Labour | Otis Gilbert | 127 | 9.24 | ||
| Liberal Democrat | Charles Jevon | 101 | 7.35 | ||
| Majority | 842 | 61.29 | |||
| Turnout | 1,374 | 42.7 | |||
| Labour hold | Swing | ||||
Longhoughton
| Party | Candidate | Votes | % | ± | |
|---|---|---|---|---|---|
| Independent | John Anthony Taylor | 705 | 51.01 | ||
| Conservative | David James Campbell Rixon | 315 | 22.79 | ||
| Independent | Ian James Ramsey Sutherland | 184 | 13.32 | ||
| UKIP | Geoffrey Watson | 178 | 12.88 | ||
| Majority | 390 | 28.22 | |||
| Turnout | 1,382 | 43.00 | |||
| Independent hold | Swing | ||||
Lynemouth
| Party | Candidate | Votes | % | ± | |
|---|---|---|---|---|---|
| Labour | Milburn Irving Douglas | 661 | 61.60 | ||
| Liberal Democrat | Barry Kent | 342 | 31.87 | ||
| Conservative | Jeremy Lewis Wilcock | 70 | 6.53 | ||
| Majority | 319 | 29.73 | |||
| Turnout | 1,073 | 32.20 | |||
| Labour hold | Swing | ||||
Morpeth Kirkhill
| Party | Candidate | Votes | % | ± | |
|---|---|---|---|---|---|
| Liberal Democrat | Andrew Tebbutt | 710 | 45.75 | ||
| Conservative | David Herne | 464 | 29.90 | ||
| Labour | Adrian Martin James Slassor | 378 | 24.35 | ||
| Majority | 246 | 15.85 | |||
| Turnout | 1,552 | 38.30 | |||
| Liberal Democrat hold | Swing | ||||
Morpeth North
| Party | Candidate | Votes | % | ± | |
|---|---|---|---|---|---|
| Conservative | David Lee Bawn | 523 | 31.79 | ||
| Green | Nicholas Francis Best | 424 | 25.78 | ||
| Liberal Democrat | Kenneth Brown | 385 | 23.40 | ||
| Labour | Colin Taylor | 313 | 19.03 | ||
| Majority | 99 | 6.01 | |||
| Turnout | 1,645 | 43.80 | |||
| Conservative hold | Swing | ||||
Morpeth Stobhill
| Party | Candidate | Votes | % | ± | |
|---|---|---|---|---|---|
| Liberal Democrat | Ian Paul Lindley | 553 | 37.57 | ||
| Conservative | John Ace Beynon | 472 | 32.06 | ||
| Labour | Debra Belinda Davies | 447 | 30.37 | ||
| Majority | 81 | 5.51 | |||
| Turnout | 1,472 | 40.20 | |||
| Liberal Democrat hold | Swing | ||||
Newbiggin Central & East
| Party | Candidate | Votes | % | ± | |
|---|---|---|---|---|---|
| Labour | Elizabeth Mary Simpson | 751 | 67.29 | ||
| Liberal Democrat | James Alan Thompson | 265 | 23.75 | ||
| Conservative | Dorothy Anne Wonnacott | 100 | 8.96 | ||
| Majority | 486 | 43.54 | |||
| Turnout | 1,116 | 30.18 | |||
| Labour hold | Swing | ||||
Newsham
| Party | Candidate | Votes | % | ± | |
|---|---|---|---|---|---|
| Labour | Deirdre Campbell | 441 | 45.94 | ||
| UKIP | Richard William Hall | 352 | 36.67 | ||
| Liberal Democrat | Elizabeth Marina Vuyk | 112 | 11.66 | ||
| Conservative | Nicola Swinburn | 55 | 5.73 | ||
| Majority | 89 | 9.27 | |||
| Turnout | 960 | 27.65 | |||
| Labour hold | Swing | ||||
Norham & Islandshires
| Party | Candidate | Votes | % | ± | |
|---|---|---|---|---|---|
| Liberal Democrat | Richard John Douglas Watkin | 808 | 54.85 | ||
| Conservative | Steven John Purvis | 533 | 36.19 | ||
| Labour | Sandra Dawn Dickinson | 132 | 8.96 | ||
| Majority | 275 | 18.66 | |||
| Turnout | 1,473 | 42.10 | |||
| Liberal Democrat hold | Swing | ||||
Pegswood
| Party | Candidate | Votes | % | ± | |
|---|---|---|---|---|---|
| Labour | Alan George Sambrook | 510 | 40.38 | ||
| Liberal Democrat | David George Woodard | 323 | 25.58 | ||
| Conservative | Sheila Luck | 226 | 17.89 | ||
| UKIP | Muriel Brown | 204 | 16.15 | ||
| Majority | 187 | 14.80 | |||
| Turnout | 1,263 | 32.10 | |||
| Labour hold | Swing | ||||
Plessey
| Party | Candidate | Votes | % | ± | |
|---|---|---|---|---|---|
| Liberal Democrat | Jeffrey Stewart Reid | 580 | 42.21 | ||
| Labour | Gordon Thomas Knox | 501 | 36.46 | ||
| UKIP | Revell Cornell | 254 | 18.49 | ||
| Conservative | Karl David McLean | 39 | 2.84 | ||
| Majority | 79 | 5.75 | |||
| Turnout | 1,374 | 39.24 | |||
| Liberal Democrat hold | Swing | ||||
Ponteland East & Stannington
| Party | Candidate | Votes | % | ± | |
|---|---|---|---|---|---|
| Conservative | Eileen Armstrong | 896 | 83.19 | ||
| UKIP | John Collin Dickinson | 181 | 16.81 | ||
| Majority | 715 | 66.38 | |||
| Turnout | 1,077 | 33.43 | |||
| Conservative hold | Swing | ||||
Ponteland North
| Party | Candidate | Votes | % | ± | |
|---|---|---|---|---|---|
| Conservative | Richard Dodd | Uncontested | |||
| Conservative hold | Swing | ||||
Ponteland South with Heddon
| Party | Candidate | Votes | % | ± | |
|---|---|---|---|---|---|
| Conservative | Peter Alan Jackson | 836 | 81.40 | ||
| Liberal Democrat | Ian Shepherd Sotheran | 191 | 18.60 | ||
| Majority | 645 | 62.80 | |||
| Turnout | 1,027 | 30.72 | |||
| Conservative hold | Swing | ||||
Ponteland West
| Party | Candidate | Votes | % | ± | |
|---|---|---|---|---|---|
| Conservative | Veronica Jones | 907 | 80.48 | ||
| UKIP | David Nicholson | 220 | 19.52 | ||
| Majority | 687 | 60.96 | |||
| Turnout | 1,127 | 34.51 | |||
| Conservative hold | Swing | ||||
Prudhoe North
| Party | Candidate | Votes | % | ± | |
|---|---|---|---|---|---|
| Labour | Eileen Burt | 587 | 49.12 | ||
| UKIP | Alan Keith Piper | 300 | 25.10 | ||
| Conservative | Gerald Bernard Price | 257 | 21.51 | ||
| Liberal Democrat | John Michael Womersley Williams | 51 | 4.27 | ||
| Majority | 287 | 24.02 | |||
| Turnout | 1,195 | 27.54 | |||
| Labour hold | Swing | ||||
Prudhoe South
| Party | Candidate | Votes | % | ± | |
|---|---|---|---|---|---|
| Labour | Anthony William Reid | 549 | 52.74 | ||
| UKIP | Geraldine Margaret Welton | 264 | 25.36 | ||
| Conservative | Jade Marie Scott | 179 | 17.19 | ||
| Liberal Democrat | Darren William Levitt | 49 | 4.71 | ||
| Majority | 285 | 27.38 | |||
| Turnout | 1,041 | 26.15 | |||
| Labour hold | Swing | ||||
Rothbury
| Party | Candidate | Votes | % | ± | |
|---|---|---|---|---|---|
| Liberal Democrat | Steven Christopher Bridgett | 1,544 | 70.86 | ||
| Conservative | Brian Hesler | 540 | 24.78 | ||
| Labour | Thelma Morse | 95 | 4.36 | ||
| Majority | 1,004 | 46.08 | |||
| Turnout | 2,179 | 54.20 | |||
| Liberal Democrat hold | Swing | ||||
Seaton with Newbiggin West
| Party | Candidate | Votes | % | ± | |
|---|---|---|---|---|---|
| Labour | James Aidan Lang | 842 | 78.33 | ||
| UKIP | Gary James Leighton | 120 | 11.16 | ||
| Liberal Democrat | Malcolm Peden | 71 | 6.60 | ||
| Conservative | Timothy James Nichol | 42 | 3.91 | ||
| Majority | 722 | 67.17 | |||
| Turnout | 1,075 | 29.55 | |||
| Labour hold | Swing | ||||
Seghill with Seaton Delaval
| Party | Candidate | Votes | % | ± | |
|---|---|---|---|---|---|
| Labour | Margaret Evelyn Richards | 840 | 73.23 | ||
| Conservative | Alastair John Ion | 181 | 15.78 | ||
| Liberal Democrat | Anna Jane Reid | 126 | 10.99 | ||
| Majority | 659 | 57.45 | |||
| Turnout | 1,147 | 28.20 | |||
| Labour hold | Swing | ||||
Shilbottle
| Party | Candidate | Votes | % | ± | |
|---|---|---|---|---|---|
| Conservative | Trevor Norman Thorne | 765 | 45.40 | ||
| Labour | Brenda Trobe | 476 | 28.25 | ||
| UKIP | John Anderson Curry | 342 | 20.30 | ||
| Liberal Democrat | Gregah Alan Roughead | 102 | 6.05 | ||
| Majority | 289 | 17.15 | |||
| Turnout | 1,685 | 41.90 | |||
| Conservative hold | Swing | ||||
Sleekburn
| Party | Candidate | Votes | % | ± | |
|---|---|---|---|---|---|
| Labour | John James Gobin | 498 | 57.31 | ||
| Liberal Democrat | Mark David Owen | 310 | 35.67 | ||
| Conservative | David Gavin Moffatt | 61 | 7.02 | ||
| Majority | 188 | 21.64 | |||
| Turnout | 869 | 16.51 | |||
| Labour hold | Swing | ||||
South Blyth
| Party | Candidate | Votes | % | ± | |
|---|---|---|---|---|---|
| Liberal Democrat | Lesley Jennifer Rickerby | 551 | 46.11 | ||
| UKIP | Peter Potts | 287 | 24.02 | ||
| Labour | Heidrun Hedwig Knox | 278 | 23.26 | ||
| Conservative | Jamie Wyatt | 79 | 6.61 | ||
| Majority | 264 | 22.09 | |||
| Turnout | 1,195 | ||||
| Liberal Democrat hold | Swing | ||||
South Tynedale
| Party | Candidate | Votes | % | ± | |
|---|---|---|---|---|---|
| Conservative | Colin William Horncastle | 1,069 | 71.41 | ||
| Labour | Catherine Anne Hedley | 310 | 20.71 | ||
| Liberal Democrat | Stuart Alan Rowlands | 118 | 7.88 | ||
| Majority | 759 | 50.70 | |||
| Turnout | 1,497 | 38.23 | |||
| Conservative hold | Swing | ||||
Stakeford
| Party | Candidate | Votes | % | ± | |
|---|---|---|---|---|---|
| Labour | Julie Denise Foster | 878 | 78.32 | ||
| Conservative | Chris Galley | 243 | 21.68 | ||
| Majority | 635 | 56.64 | |||
| Turnout | 1,121 | 30.01 | |||
| Labour hold | Swing | ||||
Stocksfield & Boomhaugh
| Party | Candidate | Votes | % | ± | |
|---|---|---|---|---|---|
| Independent | Patricia Anne Mary Dale | 1,416 | 73.10 | ||
| Conservative | Paul Vickers | 344 | 17.76 | ||
| Labour | Karen Louise Pollock | 177 | 9.14 | ||
| Majority | 1,072 | 55.34 | |||
| Turnout | 1,937 | 48.62 | |||
| Independent hold | Swing | ||||
Wensleydale
| Party | Candidate | Votes | % | ± | |
|---|---|---|---|---|---|
| Labour | Eileen Cartie | 650 | 69.52 | ||
| Liberal Democrat | Penelope Anne Reid | 204 | 21.82 | ||
| Conservative | Margaret Mary Ion | 81 | 8.66 | ||
| Majority | 446 | 47.70 | |||
| Turnout | 935 | ||||
| Labour hold | Swing | ||||
Wooler
| Party | Candidate | Votes | % | ± | |
|---|---|---|---|---|---|
| Conservative | Anthony Harkness Murray | 850 | 64.25 | ||
| UKIP | Gavin William Thomas Egdell | 272 | 20.56 | ||
| Liberal Democrat | Rosemary Cott | 110 | 8.31 | ||
| Labour | David Buchanan Williams | 91 | 6.88 | ||
| Majority | 578 | 43.69 | |||
| Turnout | 1,323 | 38.80 | |||
| Conservative hold | Swing | ||||
References
- ↑ "Councillors". Northumberland County Council. Retrieved 30 January 2012.
- ↑ http://www.northumberland.gov.uk/Councillors/Vote.aspx
External links
| Northumberland County Council | |
|---|---|
| Alnwick District Council | |
| Berwick-upon-Tweed Borough Council |
|
| Blyth Valley Borough Council |
|
| Castle Morpeth Borough Council |
|
| Tynedale District Council | |
| Wansbeck District Council |
|
| |
This article is issued from
Wikipedia.
The text is licensed under Creative Commons - Attribution - Sharealike.
Additional terms may apply for the media files.