North Carolina's 2nd congressional district
| North Carolina's 2nd congressional district | |
|---|---|
.tif.png) North Carolina's 2nd congressional district - since January 3, 2017. | |
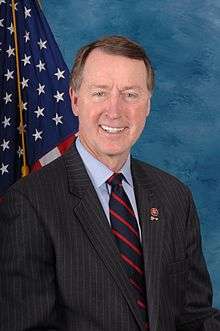
| Current Representative | George Holding (R–Raleigh) |
| Distribution |
|
| Population (2016) | 819,899[2] |
| Median income | 36,510 |
| Ethnicity |
|
| Cook PVI | R+7[3] |
North Carolina's 2nd congressional district is located in the central and eastern parts of the state. Today, the district, which is represented by Republican Rep. George Holding, now includes southern and eastern Wake County, northern Johnston County, southern Nash County, far western Wilson County, and all of Franklin and Harnett counties.
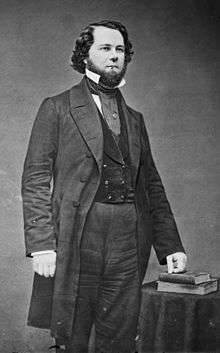
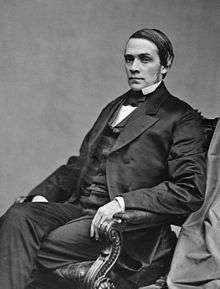
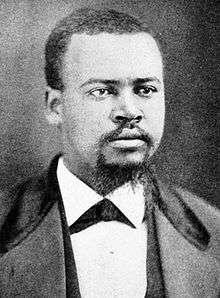
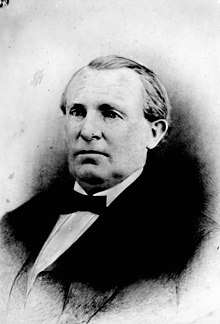
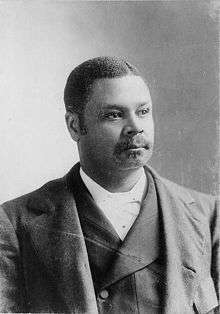
Established by the state legislature after the American Civil War, the district was known as "The Black Second;" counties included in the district were mostly majority-black in population. All four of North Carolina's Republican African-American congressmen elected in the post-Civil War era (ending with George Henry White) represented this district,[4][5] as did white yeoman farmer Curtis Hooks Brogden of Wayne County, a Republican ally of former Governor William Woods Holden.
After North Carolina Democrats regained control of the state legislature in the 1870s (using intimidation by the Red Shirts and other paramilitary groups to reduce the number of blacks voting), they passed voter registration and electoral laws that restricted voter rolls. Blacks continued to get elected to local and state offices. The state legislature passed a new constitutional amendment in 1900, which effectively disfranchised blacks altogether.[6] This ended the election of blacks to local, state or Congressional offices until after passage of federal civil rights legislation in the mid-1960s, which enforced constitutional voting rights.
Thousands of blacks migrated north from the state in the Great Migration during the first half of the twentieth century, seeking job opportunities and education. By the later twentieth century, before the 1990s, the 2nd district was roughly 40% black. While it had the highest percentage of black residents of any congressional district in North Carolina, African-American candidates were unable to get elected to Congress from the majority-white district.
State redistricting following census changes led to the creation of the black-majority 1st and 12th districts and drew off some black population from the 2nd. Today the proportion of African-American residents is about 30.4% in the 2nd District.
List of representatives
| Representative | Party | Years | Note | ||
|---|---|---|---|---|---|
 |
Anti-Administration | March 19, 1790 – March 3, 1791 | Redistricted to the 4th district | ||
 |
Anti-Administration | March 4, 1791 – March 3, 1793 | Redistricted to the 5th district | ||
 |
Anti-Administration | March 4, 1793 – March 3, 1795 | Lost re-election | ||
| Democratic-Republican | March 4, 1795 – March 3, 1799 | ||||
|
Federalist | March 4, 1799 – March 3, 1803 | |||
|
Democratic-Republican | March 4, 1803 – March 3, 1815 | Redistricted from the 9th district | ||
|
Democratic-Republican | March 4, 1815 – March 3, 1819 | |||
| Vacant | March 4, 1819 – December 5, 1819 | ||||
 |
Democratic-Republican | December 6, 1819 – March 3, 1823 | Resigned after being elected Governor of North Carolina | ||
| Crawford D-R | March 4, 1823 – March 23, 1824 | ||||
| Vacant | March 24, 1824 – January 18, 1825 | ||||
|
Crawford D-R | January 19, 1825 – March 3, 1825 | |||
|
Jacksonian | March 4, 1825 – March 3, 1831 | |||
 |
Jacksonian | May 12, 1831 – March 3, 1833 | |||
|
Jacksonian | March 4, 1833 – March 3, 1837 | |||
| Democratic | March 4, 1837 – March 3, 1841 | ||||
|
Democratic | March 4, 1841 – March 3, 1843 | Redistricted to the 7th district | ||
|
Whig | March 4, 1843 – March 3, 1847 | Redistricted to the 3rd district | ||
 |
Whig | March 4, 1847 – March 3, 1849 | Retired | ||
|
Whig | March 4, 1849 – March 3, 1853 | Retired | ||
 |
Democratic | March 4, 1853 – March 3, 1861 | |||
| Civil War and Reconstruction | |||||
 |
Republican | July 25, 1868 – June 25, 1870 | Died | ||
| Vacant | June 26, 1870 – December 4, 1870 | ||||
|
Republican | December 5, 1870 – March 3, 1871 | Retired | ||
|
Republican | March 4, 1871 – March 3, 1875 | Lost renomination | ||
 |
Republican | March 4, 1875 – March 3, 1877 | Lost renomination to immediate past governor | ||
 |
Republican | March 4, 1877 – March 3, 1879 | Retired | ||
|
Democratic | March 4, 1879 – March 3, 1881 | Lost re-election | ||
 |
Republican | March 4, 1881 – March 3, 1883 | Retired | ||
 |
Republican | March 4, 1883 – March 3, 1887 | Lost re-election | ||
 |
Democratic | March 4, 1887 – March 3, 1889 | Lost re-election | ||
 |
Republican | March 4, 1889 – March 3, 1893 | Lost re-election | ||
|
Democratic | March 4, 1893 – March 3, 1897 | Lost re-election | ||
 |
Republican | March 4, 1897 – March 3, 1901 | Retired after state passage of 1900 disfranchisement constitution, which suppressed black voters for more than 60 years | ||
 |
Democratic | March 4, 1901 – May 31, 1923 | Died | ||
| Vacant | June 1, 1923 – November 5, 1923 | ||||
 |
Democratic | November 6, 1923 – January 3, 1953 | Lost renomination | ||
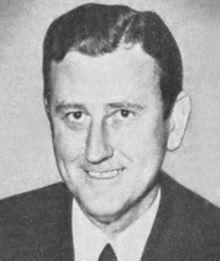 |
Democratic | January 3, 1953 – January 3, 1983 | Retired | ||
 |
Democratic | January 3, 1983 – January 3, 1995 | Retired | ||
 |
Republican | January 3, 1995 – January 3, 1997 | Lost re-election | ||
 |
Democratic | January 3, 1997 – January 3, 2011 | Lost re-election | ||
 |
Republican | January 3, 2011 – January 3, 2017 | Lost renomination | ||
 |
Republican | January 3, 2017 – Present | |||
Historical district boundaries

.tif.png)
Election results
2002
| Party | Candidate | Votes | % | |
|---|---|---|---|---|
| Democratic | Bob Etheridge | 100,121 | 65.36 | |
| Republican | Joseph L. Ellen | 50,965 | 33.27 | |
| Libertarian | Gary Minter | 2,098 | 1.37 | |
| Total votes | 153,184 | 100 | ||
2004
| Party | Candidate | Votes | % | |
|---|---|---|---|---|
| Democratic | Bob Etheridge | 145,079 | 62.3 | |
| Republican | Billy J. Creech | 87,811 | 37.7 | |
| Total votes | 232,890 | 100 | ||
2006
| Party | Candidate | Votes | % | |
|---|---|---|---|---|
| Democratic | Bob Etheridge | 85,993 | 66.53 | |
| Republican | Dan Mansell | 43,271 | 33.47 | |
| Total votes | 129,264 | 100 | ||
2008
| Party | Candidate | Votes | % | |
|---|---|---|---|---|
| Democratic | Bob Etheridge | 199,730 | 66.93 | |
| Republican | Dan Mansell | 93,323 | 31.27 | |
| Libertarian | Will Adkins | 5,377 | 1.8 | |
| Total votes | 298,430 | 100 | ||
2010
| Party | Candidate | Votes | % | |
|---|---|---|---|---|
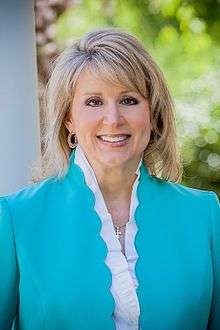
| Republican | Renee Ellmers | 93,876 | 49.47 | |
| Democratic | Bob Etheridge | 92,393 | 48.69 | |
| Libertarian | Tom Rose | 3,505 | 1.85 | |
| Total votes | 189,774 | 100 | ||
2012
| Party | Candidate | Votes | % | |
|---|---|---|---|---|
| Republican | Renee Ellmers | 174,066 | 55.9 | |
| Democratic | Steve Wilkins | 128,973 | 41.42 | |
| Libertarian | Brian Irving | 8,358 | 2.68 | |
| Total votes | 311,397 | 100 | ||
2014
| Party | Candidate | Votes | % | |
|---|---|---|---|---|
| Republican | Renee Ellmers | 122,128 | 58.83 | |
| Democratic | Clay Aiken | 85,479 | 41.17 | |
| Total votes | 207,607 | 100 | ||
2016
| Party | Candidate | Votes | % | |
|---|---|---|---|---|
| Republican | George Holding | 221,485 | 56.71 | |
| Democratic | John P. McNeil | 169,082 | 43.29 | |
| Total votes | 390,567 | 100 | ||
See also
References
- ↑ https://www.census.gov/geo/maps-data/data/cd_state.html
- ↑ https://www.census.gov/mycd/?st=37&cd=01
- ↑ "Partisan Voting Index – Districts of the 115th Congress" (PDF). The Cook Political Report. April 7, 2017. Retrieved April 7, 2017.
- ↑ Black Americans in Congress
- ↑ Eric Anderson, Race and Politics in North Carolina, 1872-1901: The Black Second
- ↑ NCpedia: Disfranchisement
- ↑ "11/05/2002 Official General Election Results - Statewide". North Carolina State Board of Elections. November 15, 2002. Retrieved December 24, 2017.
- ↑ "11/02/2004 Official General Election Results - Statewide". North Carolina State Board of Elections. November 12, 2004. Retrieved December 24, 2017.
- ↑ "11/07/2006 Official General Election Results - Statewide". North Carolina State Board of Elections. November 17, 2006. Retrieved December 24, 2017.
- ↑ "11/04/2008 Official General Election Results - Statewide". North Carolina State Board of Elections. November 14, 2008. Retrieved December 24, 2017.
- ↑ "11/02/2010 Official General Election Results - Statewide". North Carolina State Board of Elections. November 12, 2010. Retrieved December 24, 2017.
- ↑ "11/06/2012 Official General Election Results - Statewide". North Carolina State Board of Elections. November 16, 2012. Retrieved December 24, 2017.
- ↑ "11/04/2014 Official General Election Results - Statewide". North Carolina State Board of Elections. November 25, 2014. Retrieved December 24, 2017.
- ↑ "11/06/2016 Official General Election Results - Statewide". North Carolina State Board of Elections. December 13, 2016. Retrieved December 24, 2017.
- Martis, Kenneth C. (1989). The Historical Atlas of Political Parties in the United States Congress. New York: Macmillan Publishing Company.
- Martis, Kenneth C. (1982). The Historical Atlas of United States Congressional Districts. New York: Macmillan Publishing Company.
- Congressional Biographical Directory of the United States 1774–present
External links
Coordinates: 35°26′47″N 79°17′52″W / 35.44639°N 79.29778°W