Nepean—Carleton (provincial electoral district)
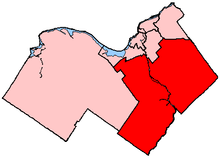 Nepean—Carleton in relation to other Ottawa electoral districts | |
| Defunct provincial electoral district | |
| Legislature | Legislative Assembly of Ontario |
| District created | 1999 |
| District abolished | 2015 |
| First contested | 1999 |
| Last contested | 2014 |
| Demographics | |
| Population (2006) | 133,245 |
| Electors (2007) | 97,757 |
| Area (km²) | 1,178 |
| Census divisions | Ottawa |
| Census subdivisions | Ottawa |
Nepean-Carleton was a provincial electoral district in eastern Ontario, Canada. It elected one member to the Legislative Assembly of Ontario from 1999 to 2014.
The riding was represented in the Ontario legislature by Progressive Conservative John Baird since it became a provincial riding in 1999 until he resigned in 2005 to run in the 2006 federal election. PC candidate Lisa MacLeod won the provincial by-election to fill the vacancy that was held on March 30, 2006.
Following the 2018 election, the district was dissolved into Nepean, Carleton, Orléans, and Kanata—Carleton.
History
The riding was created in 1999, to match its federal counterpart. It was made up of 62% of Nepean, 43% of Carleton and 11% of Ottawa—Rideau.
Members of Provincial Parliament
| Nepean | ||||
|---|---|---|---|---|
| Assembly | Years | Member | Party | |
| Riding created from Nepean, Carleton, and Ottawa–Rideau. |
||||
| 37th | 1999–2003 | John Baird | Progressive Conservative | |
| 38th | 2003–2005 | |||
| 2005–2007 | Lisa MacLeod | |||
| 39th | 2007–2011 | |||
| 40th | 2011–2014 | |||
| 41st | 2014–2018 | |||
| Riding dissolved into Nepean, Carleton, Orléans, and Kanata—Carleton. |
||||
Election results
| Ontario general election, 2014 | ||||||||
|---|---|---|---|---|---|---|---|---|
| Party | Candidate | Votes | % | ±% | ||||
| Progressive Conservative | Lisa MacLeod | 30,901 | 46.77 | −7.71 | ||||
| Liberal | Jack Uppal | 21,974 | 33.26 | +6.29 | ||||
| New Democratic | Ric Dagenais | 8,628 | 13.06 | −1.71 | ||||
| Green | Gordon Kubanek | 3,630 | 5.49 | +2.51 | ||||
| Libertarian | Coreen Corcoran | 940 | 1.42 | +1.01 | ||||
| Total valid votes | 66,073 | 100.0 | +20.00 | |||||
| Progressive Conservative hold | Swing | −7.00 | ||||||
Source(s)
Elections Ontario (2014). "Official result from the records – 052, Nepean—Carleton" (PDF). Retrieved 27 June 2015.
| ||||||||
| Ontario general election, 2011 | ||||||||
|---|---|---|---|---|---|---|---|---|
| Party | Candidate | Votes | % | ±% | Expenditures | |||
| Progressive Conservative | Lisa MacLeod | 29,985 | 54.48 | +4.20 | $ 61,855.47 | |||
| Liberal | Don Dransfield | 14,844 | 26.97 | −5.97 | 20,300.63 | |||
| New Democratic | Ric Dagenais | 8,127 | 14.77 | +7.34 | 18,039.80 | |||
| Green | Gordon Kubanek | 1,641 | 2.98 | −5.38 | 2,855.87 | |||
| Libertarian | Roger Toutant | 223 | 0.41 | 0.00 | ||||
| Freedom | Marco Rossi | 217 | 0.39 | 0.00 | ||||
| Total valid votes / Expense limit | 55,037 | 100.0 | +2.23 | $ 131,703.25 | ||||
| Total rejected, unmarked and declined ballots | 193 | 0.35 | −0.17 | |||||
| Turnout | 55,230 | 49.91 | −4.70 | |||||
| Eligible voters | 110,662 | +11.69 | ||||||
| Progressive Conservative hold | Swing | +5.09 | ||||||
Source(s)
"Summary of Valid Votes Cast for Each Candidate – October 6, 2011 General Election" (PDF).
"Statistical Summary – General Elections 2011" ( "2011 Candidate Campaign Returns (CR-1)". Elections Ontario. Retrieved May 31, 2014. | ||||||||
| Ontario general election, 2007 | ||||||||
|---|---|---|---|---|---|---|---|---|
| Party | Candidate | Votes | % | ±% | Expenditures | |||
| Progressive Conservative | Lisa MacLeod | 27,070 | 50.28 | −7.29 | $ 58,239.69 | |||
| Liberal | Jai Aggarwal | 17,731 | 32.94 | +1.50 | 35,359.08 | |||
| Green | Gordon Kubanek | 4,500 | 8.36 | +6.25 | 3,130.46 | |||
| New Democratic | Tristan Maack | 4,000 | 7.43 | −0.84 | 11,543.93 | |||
| Family Coalition | Suzanne Fortin | 533 | 0.99 | 0.00 | ||||
| Total valid votes/Expense limit | 53,834 | 100.0 | +79.01 | $ 107,004.24 | ||||
| Total rejected ballots | 277 | 0.52 | +0.20 | |||||
| Turnout | 54,111 | 54.61 | +26.09 | |||||
| Eligible voters | 99,078 | −6.36 | ||||||
Source(s)
"Summary of Valid Votes Cast for Each Candidate – October 10, 2007 General Election" (PDF).
"Statistical Summary – General Elections 2007" (PDF). Elections Ontario. Retrieved May 28, 2014. "2007 Candidate Campaign Returns (CR-1)". Retrieved May 31, 2014. | ||||||||
| Ontario provincial by-election, March 30, 2006 | ||||||||
|---|---|---|---|---|---|---|---|---|
| Party | Candidate | Votes | % | ±% | Expenditures | |||
| Progressive Conservative | Lisa MacLeod | 17,312 | 57.57 | +3.51 | $ 89,547.03 | |||
| Liberal | Brian Ford | 9,455 | 31.44 | −4.21 | 58,560.17 | |||
| New Democratic | Laurel Gibbons | 2,487 | 8.27 | +1.73 | 32,687.68 | |||
| Green | Peter V. Tretter | 634 | 2.11 | −1.65 | 852.94 | |||
| Independent | John Turmel | 112 | 0.37 | 0.00 | ||||
| Freedom | Jurgen Vollrath | 73 | 0.24 | 0.00 | ||||
| Total valid votes/Expense Limit | 30,073 | 100.0 | −48.65 | $ 114,226.16 | ||||
| Total rejected ballots | 97 | 0.32 | −0.13 | |||||
| Turnout | 30,170 | 28.52 | −33.71 | |||||
| Eligible voters | 105,802 | +11.91 | ||||||
Source(s)
"By-Election 2006 – Summary of Valid Ballots Cast for Each Candidate". Elections Ontario. March 30, 2006. Retrieved May 28, 2014.
"By-Election 2006 – Poll by Poll Results". Elections Ontario. Retrieved May 28, 2014. "CR-1 Campaign Returns". Elections Ontario. Retrieved May 28, 2014. | ||||||||
| Ontario general election, 2003 | ||||||||
|---|---|---|---|---|---|---|---|---|
| Party | Candidate | Votes | % | ±% | Expenditures | |||
| Progressive Conservative | John Baird | 31,662 | 54.06 | −8.25 | $ 89,484.81 | |||
| Liberal | Rod Vanier | 20,878 | 35.65 | +2.45 | 59,182.48 | |||
| New Democratic | Liam McCarthy | 3,828 | 6.54 | +3.28 | 7,619.96 | |||
| Green | Matt Takach | 2,200 | 3.76 | 4,820.88 | ||||
| Total valid votes/Expense Limit | 58,568 | 100.0 | +15.69 | $ 90,762.24 | ||||
| Total rejected ballots | 263 | 0.45 | −0.13 | |||||
| Turnout | 58,831 | 62.23 | +1.21 | |||||
| Eligible voters | 94,544 | +13.30 | ||||||
Source(s)
"General Election of October 2, 2003 — Summary of Valid Ballots by Candidate". Elections Ontario. Retrieved May 28, 2014.
"General Election of October 2, 2003 — Statistical Summary". Elections Ontario. Retrieved May 28, 2014. "2003 Election Returns - Candidate and Association" ( | ||||||||
| Ontario general election, 1999 | ||||||||
|---|---|---|---|---|---|---|---|---|
| Party | Candidate | Votes | % | Expenditures | ||||
| Progressive Conservative | John Baird | 31,546 | 62.31 | $60,150.37 | ||||
| Liberal | Gord Hunter | 16,809 | 33.20 | 56,229.71 | ||||
| New Democratic | Craig Parsons | 1,647 | 3.25 | 8,231.29 | ||||
| Freedom | Bill Frampton | 386 | 0.76 | 0.00 | ||||
| Natural Law | Brian E. Jackson | 239 | 0.47 | 0.00 | ||||
| Total valid votes/Expense Limit | 50,627 | 100.0 | $ 80,110.08 | |||||
| Total rejected ballots | 294 | 0.58 | ||||||
| Turnout | 50,921 | 61.02 | ||||||
| Eligible voters | 83,448 | |||||||
Source(s)
"General Election of June 3 1999 — Summary of Valid Ballots by Candidate". Elections Ontario. Retrieved May 28, 2014.
"General Election of June 3 1999 — Statistical Summary". Elections Ontario. Retrieved May 28, 2014. "1999 Election and Annual Returns - Candidate and Constituency Association Returns". Retrieved May 28, 2014. | ||||||||
2007 electoral reform referendum
| Ontario electoral reform referendum, 2007 | |||
|---|---|---|---|
| Side | Votes | % | |
| First Past the Post | 36,569 | 68.5 | |
| Mixed member proportional | 16,821 | 31.5 | |
| Total valid votes | 53,390 | 100.0 | |
Sources
This article is issued from
Wikipedia.
The text is licensed under Creative Commons - Attribution - Sharealike.
Additional terms may apply for the media files.