Morris (electoral district)
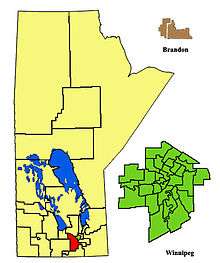 The 2011- boundaries of Morris highlighted in red. | |||
| Provincial electoral district | |||
| Legislature | Legislative Assembly of Manitoba | ||
| MLA |
Progressive Conservative | ||
| District created | 1879 | ||
| First contested | 1879 | ||
| Last contested | 2011 | ||
| Demographics | |||
| Population (2011) | 22,664 | ||
| Electors (2014) | 13,782 | ||
| Census divisions | Division No. 2, Division No. 3, Division No. 10, Division No. 11, | ||
| Census subdivisions | Cartier, Hanover, Headingley, Macdonald, Morris (RM), Morris (Town), Niverville, Ritchot, St. François Xavier | ||
Morris is a provincial electoral division in the Canadian province of Manitoba. It was created by redistribution in 1879, and has existed continuously since that time. The constituency is named after Alexander Morris, who served as Lieutenant Governor of Manitoba from 1872 to 1877.
Morris is a rural riding located in the Red River Valley in the south of the province. In is bordered to the south by Emerson, to the north by Lakeside, to the west by Midland and Portage la Prairie, and to the east by Steinbach, Dawson Trail, Assiniboia, Kirkfield Park and Charleswood.
The largest communities in the riding are Morris, Niverville and La Salle. Other communities include Elie, Oak Bluff, Sanford, Starbuck, Ste. Agathe, St. Eustache and St. Francois Xavier
In 1999, the average family income was $53,719, and the unemployment rate was 3.90%. Agriculture accounts for 23% of the riding's industry, followed by the retail trade at 10%.
Eighteen per cent of Morris's residents are of German background, and a further 17% are French. The riding has the third-highest percentage of francophones in Manitoba.
The Progressive Conservative Party of Manitoba has represented Morris since 1954, and the riding is generally regarded as safe for the party.
List of provincial representatives
| Name | Party | Took Office | Left Office |
|---|---|---|---|
| Joseph Taillefer | Independent, probably pro-Government | 1879 | 1883 |
| Henry Tennant | Cons | 1883 | 1886 |
| Alphonse Martin | Lib | 1886 | 1891 |
| Independent/Opposition | 1891 | 1896 | |
| Stewart Mulvey | Lib | 1896 | 1899 |
| Colin Campbell | Cons | 1899 | 1913 |
| Jacques Parent | Cons | 1914 | 1918 |
| William Clubb | Farmer | 1920 | 1922 |
| UFM | 1922 | 1932 | |
| Lib-Prog | 1932 | 1941 | |
| John Dryden | Independent, pro-coalition | 1941 | 1945 |
| Lib-Prog | 1945 | 1949 | |
| Harry Shewman | Independent, pro-coalition | 1949 | 1950 |
| Independent | 1950 | 1954(?) | |
| PC | 1954(?) | 1968 | |
| Warner Jorgenson | PC | 1969 | 1981 |
| Clayton Manness | PC | 1981 | 1995 |
| Frank Pitura | PC | 1995 | 2003 |
| Mavis Taillieu | PC | 2003 | 2013 |
| Shannon Martin | PC | 2014 |
Election results
| Manitoba general election, 2016 | ||||||||
|---|---|---|---|---|---|---|---|---|
| Party | Candidate | Votes | % | ±% | ||||
| Progressive Conservative | Shannon Martin | 6,980 | 75.45 | +5.46 | ||||
| Liberal | John Falk | 1,430 | 15.45 | +4.27 | ||||
| New Democratic | Mohamed Alli | 840 | 9.08 | -3.85 | ||||
| Total valid votes | 9,250 | 100.0 | ||||||
| Eligible voters | 15,991 | |||||||
| Source: Elections Manitoba[1][2] | ||||||||
| Manitoba provincial by-election, January 28, 2014 | ||||||||
|---|---|---|---|---|---|---|---|---|
| Party | Candidate | Votes | % | ±% | Expenditures | |||
| Progressive Conservative | Shannon Martin | 2,642 | 69.99 | -4.01 | 14,889.99 | |||
| New Democratic | Dean Harder | 488 | 12.93 | -6.44 | 5,522.35 | |||
| Liberal | Jeremy Barber | 422 | 11.18 | +4.55 | 4,504.42 | |||
| Independent | Ray Shaw | 138 | 3.66 | - | 5,556.36 | |||
| Green | Alain Landry | 85 | 2.25 | - | 143.45 | |||
| Total valid votes | 3775 | |||||||
| Rejected and declined votes | 17 | |||||||
| Turnout | 3792 | 27.51 | ||||||
| Electors on the lists | 13782 | |||||||
| Progressive Conservative hold | Swing | +1.21 | ||||||
| Manitoba general election, 2011 | ||||||||
|---|---|---|---|---|---|---|---|---|
| Party | Candidate | Votes | % | ±% | Expenditures | |||
| Progressive Conservative | Mavis Taillieu | 5,681 | 74.00 | +17.02 | $23,120.64 | |||
| New Democratic | Mohamed Alli | 1,487 | 19.37 | −13.20 | $0.00 | |||
| Liberal | Janelle Mailhot | 509 | 6.63 | −3.82 | $0.00 | |||
| Total valid votes | 7,677 | |||||||
| Rejected and declined ballots | 42 | |||||||
| Turnout | 7,719 | 50.69 | ||||||
| Electors on the lists | 15,228 | |||||||
| Progressive Conservative hold | Swing | +15.11 | ||||||
| Source: Elections Manitoba[3] | ||||||||
^ Change not based on redistributed results
| Manitoba general election, 2007 | ||||||||
|---|---|---|---|---|---|---|---|---|
| Party | Candidate | Votes | % | ±% | Expenditures | |||
| Progressive Conservative | Mavis Taillieu | 4,404 | 56.98 | $20,183.91 | ||||
| New Democratic | Kevin Stevenson | 2,517 | 32.57 | $3,146.85 | ||||
| Liberal | Michael Sherby | 808 | 10.45 | – | $340.30 | |||
| Total valid votes | 7,729 | 99.22 | ||||||
| Rejected and declined ballots | 61 | |||||||
| Turnout | 7,790 | 54.13 | ||||||
| Electors on the lists | 14,392 | |||||||
| Manitoba general election, 2003 | ||||||||
|---|---|---|---|---|---|---|---|---|
| Party | Candidate | Votes | % | ±% | Expenditures | |||
| Progressive Conservative | Mavis Taillieu | 3,996 | 57.16 | $30,319.43 | ||||
| New Democratic | John Auger | 1,588 | 22.71 | $859.97 | ||||
| Liberal | Michael Van Walleghem | 1,407 | 20.13 | $9,781.96 | ||||
| Total valid votes | 6,991 | |||||||
| Rejected and declined ballots | 28 | |||||||
| Turnout | 7,019 | 52.56 | ||||||
| Electors on the lists | 13,355 | |||||||
2003[5]
| Manitoba general election, 1999 | ||||||||
|---|---|---|---|---|---|---|---|---|
| Party | Candidate | Votes | % | Expenditures | ||||
| Progressive Conservative | Frank Pitura | 4,673 | 53.10 | $20,807.00 | ||||
| Liberal | Herm Martens | 2,179 | 24.76 | $9,869.40 | ||||
| New Democratic | Paul Hagen | 1,746 | 20.41 | $2,805.00 | ||||
| Libertarian | Dennis Rice | 107 | 1.22 | $341.37 | ||||
| Total valid votes | 8,753 | 99.40 | ||||||
| Rejected and declined ballots | 47 | |||||||
| Turnout | 8,800 | 52.56 | ||||||
| Electors on the lists | 13,120 | |||||||
| Manitoba general election, 1995 | ||||||||
|---|---|---|---|---|---|---|---|---|
| Party | Candidate | Votes | % | ±% | Expenditures | |||
| Progressive Conservative | Frank Pitura | 5,662 | 60.99 | |||||
| Liberal | Bill Roth | 2,329 | 25.09 | |||||
| New Democratic | Glenn Hallick | 1,158 | 12.47$ | |||||
| Libertarian | Dennis Rice | 135 | 1.45 | |||||
| Total valid votes | 9,284 | |||||||
| Rejected and declined ballots | 26 | |||||||
| Turnout | 9,310 | 71.05 | ||||||
| Electors on the lists | 13,104 | |||||||
| Manitoba general election, 1990 | ||||||||
|---|---|---|---|---|---|---|---|---|
| Party | Candidate | Votes | % | ±% | Expenditures | |||
| Progressive Conservative | Clayton Manness | 5,353 | 63.64 | |||||
| Liberal | Bill Roth | 2,036 | 24.20 | |||||
| New Democratic | Gary Nelson | 721 | 8.57$ | |||||
| Confederation of Regions | Mark Edmondson | 302 | 3.59 | |||||
| Total valid votes | 8,412 | |||||||
| Rejected and declined ballots | 15 | |||||||
| Turnout | 8,427 | 65.77 | ||||||
| Electors on the lists | 12,812 | |||||||
| Manitoba general election, 1988 | ||||||||
|---|---|---|---|---|---|---|---|---|
| Party | Candidate | Votes | % | ±% | Expenditures | |||
| Progressive Conservative | Clayton Manness | 4,578 | 60.93 | |||||
| Liberal | Barbara Plas | 1,832 | 24.38 | |||||
| Confederation of Regions | Raymond Switzer | 597 | 7.95 | |||||
| New Democratic | Clifford Hodgins | 449 | 4.98 | |||||
| Independent | Jeffrey Plas | 57 | 0.76 | |||||
| Total valid votes | 7,513 | |||||||
| Rejected and declined ballots | 11 | |||||||
| Turnout | 7,524 | 69.24 | ||||||
| Electors on the lists | 10,867 | |||||||
| Manitoba general election, 1986 | ||||||||
|---|---|---|---|---|---|---|---|---|
| Party | Candidate | Votes | % | ±% | Expenditures | |||
| Progressive Conservative | Clayton Manness | 4,378 | 68.78 | |||||
| New Democratic | Audreen House | 1,140 | 17.91 | |||||
| Liberal | Calvin Knaggs | 847 | 13.31 | |||||
| Total valid votes | 6,365 | |||||||
| Rejected and declined ballots | 17 | |||||||
| Turnout | 6,382 | 59.73 | ||||||
| Electors on the lists | 10,685 | |||||||
| Manitoba general election, 1981 | ||||||||
|---|---|---|---|---|---|---|---|---|
| Party | Candidate | Votes | % | ±% | Expenditures | |||
| Progressive Conservative | Clayton Manness | 4,579 | 71.55 | |||||
| New Democratic | Peter Francis | 1,821 | 28.45 | |||||
| Total valid votes | 6,400 | |||||||
| Rejected and declined ballots | 35 | |||||||
| Turnout | 6,435 | 64.82 | ||||||
| Electors on the lists | 9,927 | |||||||
| Manitoba general election, 1977 | ||||||||
|---|---|---|---|---|---|---|---|---|
| Party | Candidate | Votes | % | ±% | Expenditures | |||
| Progressive Conservative | Warner Jorgenson | 4,484 | 71.55 | |||||
| New Democratic | Alphonse Lenz | 1,152 | 18.73 | |||||
| Liberal | Donald Macgillivray | 516 | 8.39 | |||||
| Total valid votes | 6,152 | |||||||
| Rejected and declined ballots | 10 | |||||||
| Turnout | 6,162 | 68.84 | ||||||
| Electors on the lists | 8,951 | |||||||
| Manitoba general election, 1973 | ||||||||
|---|---|---|---|---|---|---|---|---|
| Party | Candidate | Votes | % | ±% | Expenditures | |||
| Progressive Conservative | Warner Jorgenson | 3,650 | 60.06 | |||||
| New Democratic | Lawrence Lewco | 1,602 | 26.36 | |||||
| Liberal | Norm Dashevsky | 825 | 13.58 | |||||
| Total valid votes | 6,077 | |||||||
| Rejected and declined ballots | 25 | |||||||
| Turnout | 6,102 | 74.54 | ||||||
| Electors on the lists | 8,186 | |||||||
| Manitoba general election, 1969 | ||||||||
|---|---|---|---|---|---|---|---|---|
| Party | Candidate | Votes | % | |||||
| Progressive Conservative | Warner Jorgenson | 2,472 | 53.76 | |||||
| Liberal | Joseph Legault | 1,183 | 25.73 | |||||
| New Democratic | William T. Loftus | 712 | 15.48 | |||||
| Social Credit | Henry Funk | 231 | 5.02 | |||||
| Total valid votes | 4,598 | 100.00 | ||||||
| Rejected and discarded votes | 15 | |||||||
| Turnout | 4,613 | 61.20 | ||||||
| Electors on the lists | 7,537 | |||||||
| Manitoba provincial by-election, February 20, 1969 | ||||||||
|---|---|---|---|---|---|---|---|---|
| Party | Candidate | Votes | % | ±% | Expenditures | |||
| Progressive Conservative | Warner Jorgenson | 2,146 | 65.77 | $966.85 | ||||
| Liberal | Ralph Rasmussen | 841 | 25.77 | – | $526.56 | |||
| New Democratic | William T. Loftus | 276 | 8.46 | $770.61 | ||||
| Total valid votes | 3,263 | 100 | ||||||
| Rejected and discarded votes | 17 | |||||||
| Turnout | 3,280 | 62.07 | ||||||
| Electors on the lists | 5,284 | |||||||
| Manitoba general election, 1966 | ||||||||
|---|---|---|---|---|---|---|---|---|
| Party | Candidate | Votes | % | ±% | ||||
| Progressive Conservative | Harry Shewman | 1,518 | 47.80 | |||||
| Liberal | Bruce McKenzie | 1,288 | 40.55 | |||||
| New Democratic | William T. Loftus | 370 | 11.65 | |||||
| Total valid votes | 3,176 | 100.00 | ||||||
| Rejected and discarded votes | 33 | |||||||
| Turnout | 3,209 | 60.83 | ||||||
| Electors on the lists | 5,275 | |||||||
Previous boundaries

References
- ↑ "Candidates: 41st General Election". Elections Manitoba. 29 March 2016. Retrieved 31 March 2016.
- ↑ "41ST GENERAL ELECTION, APRIL 19, 2016 - OFFICIAL RESULTS". Elections Manitoba. 19 April 2016. Retrieved 16 November 2016.
- ↑ "Election Returns: 40th General Election". Elections Manitoba. 2011. Retrieved 13 September 2018.
- ↑ "Archived copy". Archived from the original on 2012-03-21. Retrieved 2010-11-25. - 2007 results
- ↑ http://www.electionsmanitoba.ca/downloads/PDF_Summary_GE2003.pdf
- ↑ "Archived copy". Archived from the original on 2012-03-06. Retrieved 2010-08-11. - 1999 Results