Elmwood (electoral district)
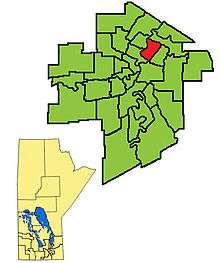 The 2011- boundaries for Elmwood highlighted in red | |||
| Provincial electoral district | |||
| Legislature | Legislative Assembly of Manitoba | ||
| MLA |
New Democratic | ||
| District created | 1957 | ||
| First contested | 1958 | ||
| Last contested | 2016 | ||
| Demographics | |||
| Census divisions | Winnipeg | ||
Elmwood is a provincial electoral division in the Canadian province of Manitoba.
1914-1920
The original Elmwood riding existed from 1914 to 1920, in what was then a suburban community in the north of Winnipeg. Its provincial Members of the Legislative Assembly (MLAs) were:
| Parliament | Years | Member | Party | |
|---|---|---|---|---|
| 14th | 1914-1915 | Harry Mewhirter | Conservative | |
| 15th | 1915–1920 | Thomas Hamilton | Liberal | |
1958-present
The modern Elmwood riding was created by redistribution in 1957, and has formally existed since the provincial election of 1958. It is located in the northeastern section of the amalgamated City of Winnipeg; the Red River forms its western and part of its southern boundary. The Elmwood riding existing from 1958 to 1969 was confined to the actual Elmwood area of the city of Winnipeg. In the redistribution of 1969 part of East Kildonan was added. Since 1981 the Elmwood riding has moved further north into East Kildonan taking in much of the old Kildonan riding (existing between 1958 and 1981) while the eastern part of the Elmwood area has been removed and added to the Concordia riding created in 1981.
Elmwood is mostly working-class and industrial. According to the 1999 Canadian census, manufacturing accounted for 18% of all industry in the riding. Thirty-one per cent of the riding's residents are listed as low-income. The average family income in Elmwood was $41,842, and the unemployment rate was 9.40%.
The riding has a significant immigrant population, including 9% of German background and 8% of Ukrainian background. 18% of the riding's residents over age 65.
The New Democratic Party of Manitoba (and its predecessor, the Manitoba Co-operative Commonwealth Federation) have won Elmwood in every provincial election since the riding's creation. It was one of just four Winnipeg seats retained by the NDP in the disastrous 1988 general election.
List of provincial representatives
| Parliament | Years | Member | Party | |
|---|---|---|---|---|
| 25th | 1958–1959 | Steve Peters | Co-operative Commonwealth | |
| 26th | 1959–1961 | |||
| 1961–1962 | New Democratic | |||
| 27th | 1962–1966 | |||
| 28th | 1966–1969 | Russell Doern | New Democratic | |
| 29th | 1969–1973 | |||
| 30th | 1973–1977 | |||
| 31st | 1977–1981 | |||
| 32nd | 1981–1984 | |||
| 1984–1986 | Independent | |||
| 33rd | 1986–1988 | Jim Maloway | New Democratic | |
| 34th | 1988-1990 | |||
| 35th | 1990-1995 | |||
| 36th | 1995-1999 | |||
| 37th | 1999-2003 | |||
| 38th | 2003-2007 | |||
| 39th | 2007–2008 | |||
| 2008–2011 | Bill Blaikie | New Democratic | ||
| 40th | 2011–present | Jim Maloway | New Democratic | |
Election results
| Manitoba general election, 2016 | ||||||||
|---|---|---|---|---|---|---|---|---|
| Party | Candidate | Votes | % | ±% | Expenditures | |||
| New Democratic | Jim Maloway | 2,993 | 46.34 | -7.81 | $29,589.01 | |||
| Progressive Conservative | Sarah Langevin | 2,886 | 44.68 | +11.06 | $6,843.54 | |||
| Manitoba | Albert Ratt | 579 | 8.96 | +8.96 | $619.01 | |||
| Total valid votes/Expense limit | 6,458 | 100.0 | ||||||
| Eligible voters | – | |||||||
| Source: Elections Manitoba[1][2][3] | ||||||||
| Manitoba general election, 2011 | ||||||||
|---|---|---|---|---|---|---|---|---|
| Party | Candidate | Votes | % | ±% | Expenditures | |||
| New Democratic | Jim Maloway | 3,864 | 54.15 | +0.39 | $29,133.44 | |||
| Progressive Conservative | David Hutten | 2,399 | 33.62 | +12.51 | $21,896.70 | |||
| Liberal | Anthony Dratowany | 467 | 6.54 | −13.74 | $4,024.51 | |||
| Green | Ray Eskritt | 346 | 4.85 | −0.01 | $84.00 | |||
| Total valid votes | 7,076 | |||||||
| Rejected and declined ballots | 60 | |||||||
| Turnout | 7,136 | 52.56 | ||||||
| Electors on the lists | 13,578 | |||||||
| Source: Elections Manitoba[4] | ||||||||
| Manitoba provincial by-election, March 24, 2009 | ||||||||
|---|---|---|---|---|---|---|---|---|
| Party | Candidate | Votes | % | ±% | Expenditures | |||
| New Democratic | Bill Blaikie | 2,325 | 53.76 | −7.75 | 17,603.25 | |||
| Progressive Conservative | Adrian Schulz | 913 | 21.11 | +0.10 | 15,919.78 | |||
| Liberal | Regan Wolfrom | 877 | 20.28 | +2.80 | 27,106.33 | |||
| Green | James Beddome | 210 | 4.86 | – | 1,115.73 | |||
| Total valid votes | 4,325 | 100 | ||||||
| Rejected and declined ballots | 14 | |||||||
| Turnout | 4,339 | 36.44 | −13.54 | |||||
| Electors on the lists | 11,907 | |||||||
| Manitoba general election, 2007 | ||||||||
|---|---|---|---|---|---|---|---|---|
| Party | Candidate | Votes | % | ±% | Expenditures | |||
| New Democratic | Jim Maloway | 3,873 | 61.51 | −4.41 | $20,096.25 | |||
| Progressive Conservative | Allister Carrington | 1,323 | 21.01 | +0.52 | $3,120.34 | |||
| Liberal | David Love | 1,101 | 17.48 | +5.01 | $7,994.14 | |||
| Total valid votes | 6,297 | 100.00 | ||||||
| Rejected and declined ballots | 61 | |||||||
| Turnout | 6,358 | 49.98 | +2.00 | |||||
| Electors on the lists | 12,720 | |||||||
| Manitoba general election, 2003 | ||||||||
|---|---|---|---|---|---|---|---|---|
| Party | Candidate | Votes | % | ±% | Expenditures | |||
| New Democratic | Jim Maloway | 3,954 | 65.92 | +3.06 | $12,707.20 | |||
| Progressive Conservative | Bryan McLeod | 1,229 | 20.49 | −11.80 | $255.88 | |||
| Liberal | Walt Roberts | 748 | 12.47 | – | $4,273.99 | |||
| Libertarian | Gavin Whittaker | 67 | 1.12 | −2.77 | $0.00 | |||
| Total valid votes | 5,998 | 100.00 | ||||||
| Rejected and declined ballots | 45 | |||||||
| Turnout | 6,043 | 47.98 | −16.31 | |||||
| Electors on the lists | 12,596 | |||||||
| Manitoba general election, 1999 | ||||||||
|---|---|---|---|---|---|---|---|---|
| Party | Candidate | Votes | % | ±% | Expenditures | |||
| New Democratic | Jim Maloway | 5,176 | 62.86 | $14,719.27 | ||||
| Progressive Conservative | Elsie Bordynuik | 2,659 | 32.29 | $18,447.73 | ||||
| Libertarian | Cameron Neumann | 320 | 3.89 | $0.00 | ||||
| Communist | James Hogaboam | 79 | 0.96 | $0.00 | ||||
| Total valid votes | 8,234 | 100.00 | ||||||
| Rejected and declined ballots | 97 | |||||||
| Turnout | 8,331 | 64.29 | ||||||
| Electors on the lists | 12,958 | |||||||
| Manitoba general election, 1995 | ||||||||
|---|---|---|---|---|---|---|---|---|
| Party | Candidate | Votes | % | ±% | Expenditures | |||
| New Democratic | Jim Maloway | 4,264 | 53.02 | +6.04 | $20,408.00 | |||
| Progressive Conservative | Clay McMurren | 2,552 | 31.73 | −2.82 | $17,550.20 | |||
| Liberal | John Petryshyn | 1,227 | 15.26 | −3.21 | $9,465.92 | |||
| Total valid votes | 8,043 | 100.00 | ||||||
| Rejected and declined ballots | 36 | |||||||
| Turnout | 8,079 | 68.85 | −2.78 | |||||
| Electors on the lists | 11,735 | |||||||
| Manitoba general election, 1990 | ||||||||
|---|---|---|---|---|---|---|---|---|
| Party | Candidate | Votes | % | ±% | ||||
| New Democratic | Jim Maloway | 4,127 | 46.98 | |||||
| Progressive Conservative | Vic Toews | 3,035 | 34.55 | |||||
| Liberal | Ed Price | 1,623 | 18.47 | |||||
| Total valid votes | 8,785 | 100.00 | ||||||
| Rejected ballots | 35 | |||||||
| Turnout | 8,820 | 71.63 | ||||||
| Registered voters | 12,313 | |||||||
| Manitoba general election, 1988 | ||||||||
|---|---|---|---|---|---|---|---|---|
| Party | Candidate | Votes | % | ±% | ||||
| New Democratic | Jim Maloway | 3,012 | 38.20 | −7.64 | ||||
| Liberal | Ed Price | 2,839 | 36.01 | +30.51 | ||||
| Progressive Conservative | Frank Syms | 1,920 | 24.35 | +4.06 | ||||
| Libertarian | Russ Letkeman | 113 | 1.43 | |||||
| Total valid votes | 7,884 | 100.00 | ||||||
| Rejected ballots | 30 | |||||||
| Turnout | 7,914 | 67.98 | +3.65 | |||||
| Registered voters | 11,641 | |||||||
| Manitoba general election, 1986 | ||||||||
|---|---|---|---|---|---|---|---|---|
| Party | Candidate | Votes | % | ±% | ||||
| New Democratic | Jim Maloway | 3,241 | 45.84 | −21.99 | ||||
| Independent | Russell Doern | 2,006 | 28.37 | |||||
| Progressive Conservative | Ray Brunka | 1,435 | 20.29 | −4.91 | ||||
| Liberal | Gilbert Benoit | 389 | 5.50 | +0.92 | ||||
| Total valid votes | 7,071 | 100.00 | ||||||
| Rejected ballots | 34 | |||||||
| Turnout | 7,105 | 64.33 | ||||||
| Registered voters | 11,044 | |||||||
| Manitoba general election, 1981 | ||||||||
|---|---|---|---|---|---|---|---|---|
| Party | Candidate | Votes | % | |||||
| New Democratic | Russell Doern | 5,140 | 67.83 | |||||
| Progressive Conservative | Eveline Holtmann | 1,910 | 25.20 | |||||
| Liberal | Eric Wood | 347 | 4.58 | |||||
| Progressive | Curtis Bloodworth | 181 | 2.39 | |||||
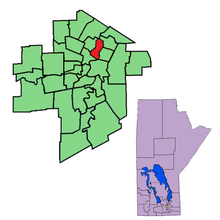
Previous boundaries
References
- ↑ "Candidates: 41st General Election". Elections Manitoba. 29 March 2016. Retrieved 31 March 2016.
- ↑ "41ST GENERAL ELECTION, APRIL 19, 2016 - OFFICIAL RESULTS". Elections Manitoba. 19 April 2016. Retrieved 16 November 2016.
- ↑ "Election Returns: 41st General Election". Elections Manitoba. 2016. Retrieved 10 September 2018.
- ↑ "Election Returns: 40th General Election". Elections Manitoba. 2011. Retrieved 10 September 2018.