List of towns and cities in Devon by population

This list is of towns and cities in Devon in order of their population, according to the 2011 census data from the Office for National Statistics. It comprises the Key Statistics for local authorities, civil parishes and wards that attempt to show their populations. The largest settlement in Devon is the city and unitary authority of Plymouth with a population of 256,720, whereas the smallest settlement was the town and civil parish of Beer with a population of 1,317. The city of Exeter, which is home to Exeter Cathedral, is the county town and headquarters of Devon County Council. The ceremonial county of Devon includes unitary authority areas such as Plymouth and Torbay, but the non-metropolitan county of Devon excludes such unitary authority areas. It is governed by Devon County Council, whereas Plymouth and Torbay can govern themselves on matters such as transport and education.
Traditionally a town is any settlement which has received a charter of incorporation, more commonly known as a town charter, approved by the monarch. However, since 1974, any civil parish has the right to declare itself as a town. Prior to 1888, city status was given to settlements home to a cathedral of the Church of England such as Exeter. After 1888 it was no longer a necessary condition, leading to Plymouth gaining city-status in 1928. Historical towns such as Plympton, Stonehouse and Devonport, which were merged into the city of Plymouth, have not been included, as well as Topsham, which became a part of Exeter's urban district, and St Marychurch, which was annexed by Torquay. However, the unitary authority area of Torbay recognises the three towns of Torquay, Paignton and Brixham. The ward for Ottery St Mary is also included, as it is titled Ottery St Mary Town.
Changes to population structures have, however, led to explosions in non-traditional settlements that do not fall into traditional, bureaucratic definitions of 'towns'. Several villages, which are not included in this list, have grown steadily and are more populous than many towns. For example, the ward of Fremington, with a population of 4,310.[1] would be ranked 34 whilst its neighbour Braunton civil parish, with a population of 8,128,[2] would be ranked 21.
| 2011 rank | Town/city | 2011 population[3] | 2001 population[4] | Increase since 2001 | Notes | Image |
|---|---|---|---|---|---|---|
| 1 | Plymouth | 256,384 | 240,720 | 6.1% | City and unitary authority, which includes the suburbs of Plympton and Plymstock. Plympton used to be a separate town and Plymstock is a parish. |  |
| 2 | Exeter | 117,773 | 111,076 | 5.7% | City, urban district and the county town (capital) of Devon | 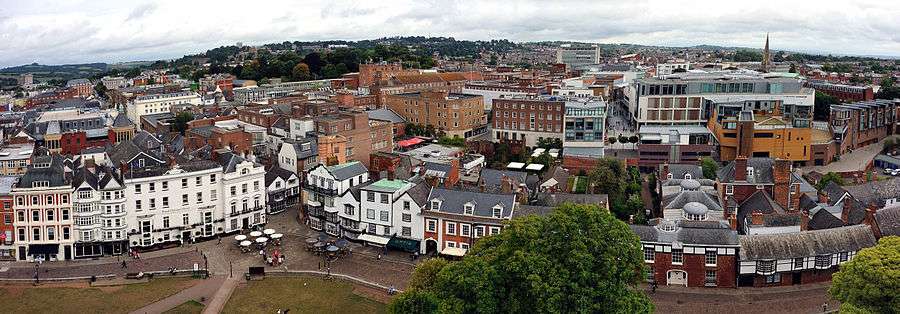 |
| 3 | Torquay | 65,245[5] | 63,998[6] | 1.9% | Part of the unitary authority of Torbay | 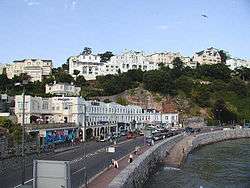 |
| 4 | Paignton | 49,021[5] | 48,251[6] | 1.6% | Part of the unitary authority of Torbay |  |
| 5 | Exmouth | 34,432 | 32,972 | 4.2% | Civil parish | 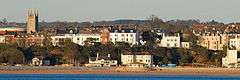 |
| 6 | Barnstaple | 24,033 | 20,724 | 13.8% | Civil parish | 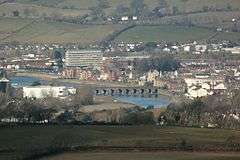 |
| 7 | Newton Abbot | 24,029 | 23,580 | 1.9% | Civil parish | 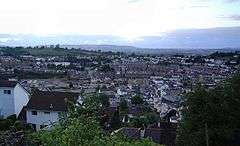 |
| 8 | Tiverton | 21,335 | 18,621 | 12.7% | Civil parish | 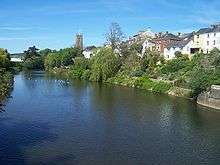 |
| 9 | Brixham | 16,693[5] | 17,457[6] | -4.6% | Civil parish; part of the unitary authority of Torbay.[7] |  |
| 10 | Bideford | 16,610 | 14,407 | 13.3% | Civil parish | 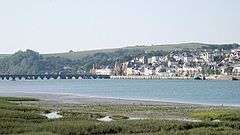 |
| 11 | Teignmouth | 14,749 | 14,413 | 2.3% | Civil parish | 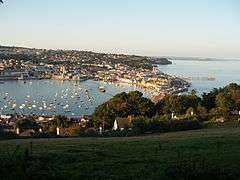 |
| 12 | Sidmouth | 13,737 | 13,135 | 4.4% | Civil parish |  |
| 13 | Dawlish | 13,161 | 13,135 | 0.2% | Civil parish |  |
| 14 | Tavistock | 12,280 | 11,604 | 5.5% | Civil parish |  |
| 15 | Northam | 12,062 | 11,018 | 8.7% | Civil parish | 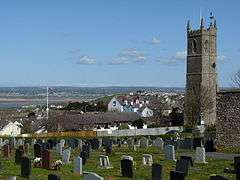 |
| 16 | Ivybridge | 11,851 | 12,056 | -1.7% | Civil parish |  |
| 17 | Ilfracombe | 11,509 | 10,840 | 5.8% | Civil parish | 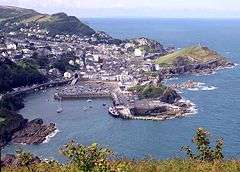 |
| 18 | Honiton | 11,156 | 10,857 | 2.7% | Civil parish |  |
| 19 | Kingsteignton | 10,451 | 10,615 | -1.6% | Civil parish |  |
| 20 | Cullompton | 8,499 | 7,609 | 10.5% | Civil parish |  |
| 21 | Crediton | 7,600 | 6,837 | 10.0% | Civil parish |  |
| 22 | Totnes | 7,456 | 7,444 | 0.2% | Civil parish |  |
| 23 | Bovey Tracey | 7,168 | 6,929 | 3.3% | Civil parish |  |
| 24 | Okehampton | 7,104 | 5,846 | 17.7% | Civil parish |  |
| 25 | Seaton | 7,096 | 6,798 | 4.2% | Civil parish | 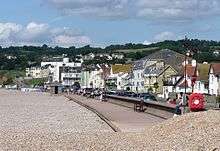 |
| 26 | Axminster | 6,557 | 5,626 | 14.2% | Civil parish |  |
| 27 | Kingsbridge | 5,887 | 5,521 | 6.2% | Civil parish |  |
| 28 | Great Torrington | 5,714 | 5,279 | 7.6% | Civil parish |  |
| 29 | Dartmouth | 5,605 | 5,512 | 1.7% | Civil parish |  |
| 30 | Budleigh Salterton | 5,185 | 4,801 | 7.4% | Civil parish | 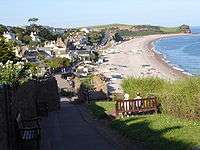 |
| 31 | Ottery St. Mary | 4,898 | 4,366 | 10.9% | Ward, which refers to Ottery St Mary as a "town". |  |
| 32 | South Molton | 4,875 | 4,093 | 16.0% | Civil parish | 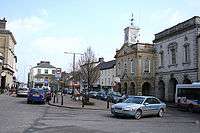 |
| 33 | Chudleigh | 4,378 | 3,846 | 12.2% | Civil parish |  |
| 34 | Ashburton | 4,087 | 3,909 | 4.4% | Civil parish |  |
| 35 | Buckfastleigh | 3,631 | 3,661 | -0.8% | Civil parish |  |
| 36 | Exminster | 3,616 | 3,310 | 8.5% | Civil parish |  |
| 37 | Colyton | 3,165 | 2,964 | 6.4% | Civil parish including Colyford | 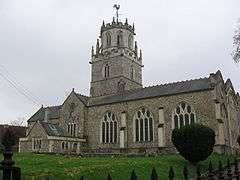 |
| 38 | Holsworthy | 2,641 | 2,256 | 14.6% | Civil parish |  |
| 39 | Bradninch | 2,206 | 1,916 | 13.1% | Civil parish |  |
| 40 | Salcombe | 1,909 | 1,893 | 0.8% | Civil parish | 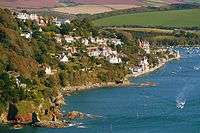 |
| 41 | North Tawton | 1,859 | 1,570 | 15.5% | Civil parish | 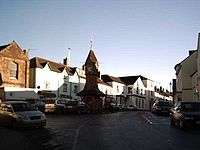 |
| 42 | Hatherleigh | 1,729 | 1,306 | 24.5% | Civil parish |  |
| 43 | Hartland | 1,724 | 1,676 | 2.8% | Civil parish | 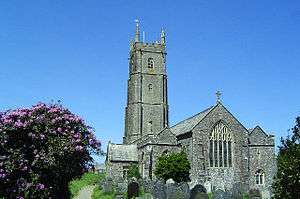 |
| 44 | Moretonhampstead | 1,703 | 1,536 | 9.8% | Civil parish |  |
| 45 | Chagford | 1,449 | 1,470 | -1.4% | Civil parish |  |
| 46 | Chulmleigh | 1,323 | 1,308 | 1.1% | Civil parish | 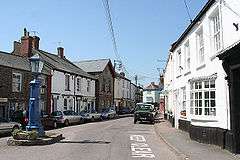 |
| 47 | Beer | 1,317 | 1,381 | -4.9% | Civil parish |  |
See also
- List of largest United Kingdom settlements by population
- List of English districts by population
- List of Scottish council areas by population (2004)
- List of Welsh principal areas by population
- Local Councils in Northern Ireland by population
- List of conurbations in the United Kingdom
- Travel to Work Area
References
- ↑ "Ward population 2011". Retrieved 19 February 2015.
- ↑ "Key Figures for 2011 Census: Key Statistics: Braunton". Neighbourhood Statistics. Office for National Statistics. 2011-03-28. Retrieved 2017-02-12.
- ↑ "2011 Population: All Usual Residents". Neighbourhood Statistics. Office for National Statistics. 2011-03-27. Archived from the original on 2009-01-06. Retrieved 2017-02-12.
- ↑ "Key Figures for 2001 Census: All people". Neighbourhood Statistics. Office for National Statistics. 2001-04-01. Archived from the original on 2009-01-06. Retrieved 2008-11-28.
- 1 2 3 "Census 2011 - Torbay Profile". Torbay Council. 3 July 2013. Archived from the original on 22 February 2014. Retrieved 12 February 2017. (Word document)
- 1 2 3 "Key Statistics for Tobray — May 2005" (PDF). Census 2001. The Consultation and Research Team, Torbay Council. p. 2. Retrieved 2008-11-28.
- ↑ "Brixham Town Council". Torbay Council. 2009-10-29. Retrieved 2009-10-29.