List of estimated death tolls from nuclear attacks on cities
| Nuclear weapons |
|---|
 |
| Background |
| Nuclear-armed states |
|
This is a list of estimated numbers of casualties should a nuclear weapon be detonated in a certain city or other population center.
Method
The effects of any nuclear explosion is dependent of a very large number of factors, including but not limited to type of nuclear device, delivery method, explosion type (whether air burst or surface burst), the target's structural anatomy, and atmospheric conditions. To estimate the number of casualties in addition to this poses an even greater challenge.
A nuclear explosion may not hit a city directly. If distinguished, this list uses the estimate with the shortest distance.
Any nuclear attack will have consequences far beyond the area directly affected by the explosion, and the people killed in the nuclear fireball and its immediate radiation. Aside from the political, military and tactical considerations of nuclear attacks on civilians, additional effects include the subsequent nuclear fallout which spreads radioactive particles across large distances, the potential of nuclear winter and other nuclear-related climate change, and the long-term effects of radioactive exposure on human health, such as radiation-induced cancer. If distinguished, this list takes into account immediate deaths and short-term deaths, and not long-term health complications.
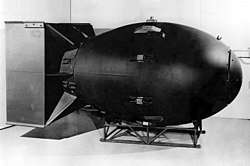
This list only includes estimates made from hypothetical nuclear scenarios and does not include death tolls from actual nuclear attacks. Nuclear weapons have only been used in combat twice throughout history, during the bombings of Hiroshima and Nagasaki during World War II, which killed approximately 120,000 (±30,000) and 60,000 (±20,000) people, respectively.[1]
Estimates of deaths after nuclear attacks were of especially high interest during the Cold War.
Estimated death tolls from nuclear attacks on cities
| City | Country | Population (millions)[Note 1] |
Estimated megadeaths from nuclear explosion |
Percent deaths | Date of estimation | Nuclear device used in estimate (yield in TNT equivalent) |
Source(s) |
|---|---|---|---|---|---|---|---|
| Detroit | 1.32 | 0.22 | 16.7 % | 1979 | unspecified 1 Mt weapon | [2] | |
| New York City | 8.2 | 3.0 | 36.6 % | 2005 | unspecified | [3] | |
| Washington, D.C. | 1.3 | 0.3 | 23.1 % | 2011 | unspecified 10 kt weapon | [4] | |
| Sydney | 4.1 | 1.75 | 42.7 % | 2005 | UR-100 (1 Mt) | [5] | |
| Tel Aviv | 1.4 | 0.22 | 16.7 % | 2013 | 2 unspecified warheads at 15 kt each | [6] | |
| Karaj | 1.1 | 0.89 | 79.2 % | 2013 | unspecified 500 kt weapon | [6] | |
| Tehran | 8.2 | 7.0 | 84.9 % | 2013 | 5 unspecified warheads at 500 kt each | [6] | |
| Tokyo | 37.9 | 3.2 | 8.4 % | 2017 | unspecified 250 kt weapon | [7] | |
| Seoul | 24.1 | 3.5 | 14.8 % | 2017 | unspecified 250 kt weapon | [7] | |
| Atlanta | 0.49 | 0.43 | 86.1 % | 1970 | 8 unspecified warheads | [8] | |
| Boston | 0.64 | 0.60 | 95 % | 1970 | 4 unspecified warheads | [8] | |
| Chicago | 3.4 | 0.43 | 12.6 % | 1970 | 4 unspecified warheads | [8] | |
| New York City | 7.9 | 3.2 | 40.4 % | 1970 | 8 unspecified warheads | [8] | |
| Pittsburgh | 0.52 | 0.38 | 72.1 % | 1970 | 4 unspecified warheads | [8] | |
| San Francisco Bay Area | 1.3 | 0.7 | 59 % | 1970 | 8 unspecified warheads | [8] | |
| Seattle | 0.5 | 0.34 | 64.2 % | 1970 | 4 unspecified warheads | [8] | |
| Washington, D.C. | 0.76 | 0.73 | 96.2 % | 1970 | 8 unspecified warheads | [8] |
Notes
- ↑ Here described is the population which was used during the death toll estimate, and may differ significantly from the current population. It may be completely wrong even for the relevant time period. If no population figure is given, the historical population count is acquired from another source.
See also
References
- ↑ Atomic bombings of Hiroshima and Nagasaki
- ↑ Office of Technology Assessment (1979). The Effects of Nuclear War. Office of Technology Assessment. LCCN 79-600080.
- ↑ Corsi, Jerome (2005). Atomic Iran. ISBN 978-1581824582.
- ↑ Buddemeier, B. R.; Valentine, J. E.; Millage, K. K.; Brandt, L. D. (2011). Key Response Planning Factors for the Aftermath of Nuclear Terrorism. Lawrence Livermore National Laboratory. LLNL-TR-512111.
- ↑ Dibb, Paul (September 10, 2005). "America has always kept us in the loop". The Australian.
- 1 2 3 Dallas, Cham E.; Bell, William C.; Stewart, David J.; Caruso, Antonio; Burkle, Jr., Frederick M. (May 10, 2013). "Nuclear war between Israel and Iran: lethality beyond the pale". Conflict and Health. 7 (10). doi:10.1186/1752-1505-7-10. Retrieved January 4, 2018.
- 1 2 Zagurek, Jr., Michael J. (October 3, 2017). "A Hypothetical Nuclear Attack on Seoul and Tokyo: The Human Cost of War on the Korean Peninsula". 38 North. Retrieved January 4, 2018.
- 1 2 3 4 5 6 7 8 https://www.dropbox.com/s/fk8gvq14ctp3gjv/nejm199804303381824_t1.jpeg?dl=0
External links
- NUKEMAP, a (non-scientific) interactive simulator for nuclear explosions and the effects and casualties thereof.