List of container shipping companies by ship fleets and containers
World’s top 50 liner shipping companies
This list provides details of the world's top 50 liner shipping companies ranked in order of the twenty-foot equivalent unit (TEU) capacity of their fleet as at 1 May 2017. The stated number of container ships includes both owned and chartered vessels.[1]
| Company | Number of ships | Capacity | Market share | Average vessel size | Container logo |
|---|---|---|---|---|---|
| Maersk Line | 763 | 4,100,871 | 18.0% | 5,753 |  |
| Mediterranean Shipping Company | 469 | 2,935,464 | 14.6% | 6,259 |  |
| CMA-CGM | 441 | 2,220,474 | 11.1% | 5,035 |  |
| China Ocean Shipping (Group) Company | 277 | 1,603,341 | 8.0% | 5,788 |  |
| Hapag-Lloyd | 219 | 1,038,483 | 5.2% | 5,769 | 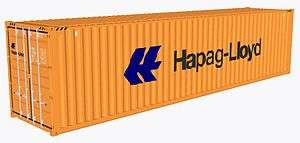 |
| Evergreen | 186 | 995,147 | 5.0% | 5,350 | 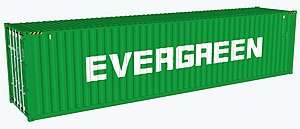 |
| Orient Overseas Container Line | 107 | 666,558 | 3.3% | 6,230 |  |
| Hamburg Süd | 116 | 594,008 | 3.0% | 5,121 | 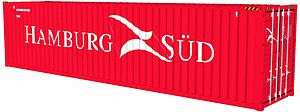 |
| Yang Ming | 100 | 588,389 | 2.9% | 5,884 |  |
| United Arab Shipping Company | 56 | 546,220 | 2.7% | 9,754 | _%E3%80%90_Pictures_taken_in_Japan_%E3%80%91.jpg) |
| Nippon Yusen Kaisha | 97 | 538,754 | 2.7% | 5,554 | 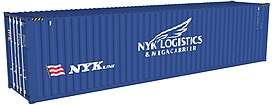 |
| Mitsui Osaka Shosen Kaisha Lines | 82 | 515,880 | 2.6% | 6,291 | 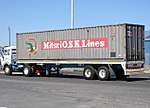 |
| Hyundai Merchant Marine | 69 | 458,247 | 2.3% | 6,641 | 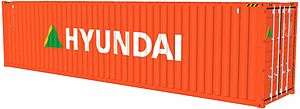 |
| Kawasaki Kisen Kaisha Limited – K Line | 64 | 363,019 | 1.8% | 5,672 |  |
| Pacific International Lines | 132 | 361,752 | 1.8% | 2,741 | _%E3%80%90_Container_pictures_taken_in_Japan_%E3%80%91.jpg) |
| Zim Integrated Shipping Services | 69 | 307,934 | 1.5% | 4,463 |  |
| Wan Hai Lines | 96 | 248,880 | 1.2% | 2,593 | 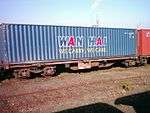 |
| X-Press Feeders | 92 | 145,454 | 0.7% | 1,581 | |
| Republic of Korea Marine Transport Company | 72 | 140,365 | 0.7% | 1,950 | |
| Shandong International Transportation Corporation | 75 | 100,195 | 0.5% | 1,336 | |
| Islamic Republic of Iran Shipping Lines | 26 | 89,374 | 0.4% | 3,437 | |
| Arkas Container Transport | 48 | 86,157 | 0.4% | 1,795 | |
| TS Lines | 38 | 74,188 | 0.4% | 1,952 | |
| Simatech Shipping | 25 | 70,602 | 0.4% | 2,824 | |
| Sinokor Merchant Marine | 42 | 59,533 | 0.3% | 1,417 | |
| Transworld Group of Companies | 33 | 57,588 | 0.3% | 1,745 | |
| Emirates Shipping Line | 9 | 48,450 | 0.2% | 5,383 | |
| Regional Container Lines | 24 | 47,782 | 0.2% | 1,991 | |
| China Merchants Group | 34 | 46,181 | 0.2% | 1,358 | |
| Unifeeder | 40 | 43,914 | 0.2% | 1,098 | |
| Heung-A Shipping | 34 | 41,959 | 0.2% | 1,234 | |
| SM Line | 11 | 41,406 | 0.2% | 3,764 | |
| Nile Dutch | 11 | 40,957 | 0.2% | 3,723 | |
| Matson | 19 | 39,806 | 0.2% | 2,095 | |
| Quanzhou Ansheng Shipping Company | 12 | 37,261 | 0.2% | 3,105 | |
| Zhonggu Shipping | 11 | 35,933 | 0.2% | 3,267 | |
| Samudera Indonesia | 26 | 32,038 | 0.2% | 1,232 | |
| Salam Pacific Indonesia Lines | 31 | 29,576 | 0.1% | 954 | |
| Seaboard Marine | 19 | 28,175 | 0.1% | 1,483 | |
| Temas Line | 33 | 25,671 | 0.1% | 778 | |
| Namsung Shipping Company | 26 | 24,900 | 0.1% | 958 | |
| Meratus Line | 27 | 23,795 | 0.1% | 881 | |
| Tanto Intim Line | 35 | 23,094 | 0.1% | 660 | |
| Shipping Corporation of India | 5 | 20,648 | 0.1% | 4,130 | |
| Swire Group | 13 | 20,318 | 0.1% | 1,563 | |
| National Transport and Overseas Services Company | 14 | 18,622 | 0.1% | 1,330 | |
| Far Eastern Shipping Company | 12 | 18,198 | 0.1% | 1,517 | |
| W.E.C. Lines | 19 | 17,979 | 0.1% | 946 | |
| Log-in Logistica Intermodal | 7 | 16,895 | 0.1% | 2,414 | |
| Far Shipping | 10 | 14,436 | 0.1% | 1,444 |
World's top 10 international container leasing companies
This is a list of the world's top 10 container leasing companies ranked in order of the twenty-foot equivalent unit (TEU) capacity of their fleet as at 31 December 2014. The data have been consolidated to reflect the subsequent merger of Triton Container and TAL International in 2016, and HNA / Bohai Group's 2015 acquisitions of Seaco and Cronos Group.[2]
| Leasing company ! | Capacity | Market Share | Image |
|---|---|---|---|
| Triton Container / TAL International | 4,550,000 | 25.2% | 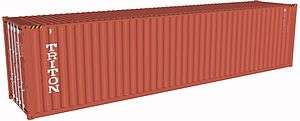 |
| Textainer Group | 3,230,000 | 17.9% |  |
| HNA / Bohai Group | 2,177,500 | 12.1% | 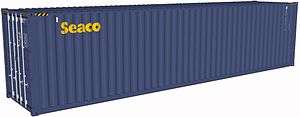
|
| Florens Container Leasing | 1,895,000 | 10.5% |  |
| SeaCube Container Leasing | 1,237,500 | 6.9% | 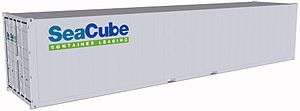 |
| CAI International | 1,165,000 | 6.5% |  |
| Dong Fang International | 755,000 | 4.2% | 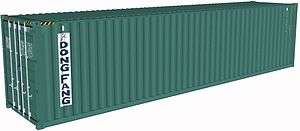 |
| Beacon Intermodal Leasing | 660,000 | 3.7% | |
| Touax Container Solutions | 630,000 | 3.5% |
See also
References
- ↑ "Review of Maritime Transport 2017" (PDF). United Nations Conference on Trade and Development. October 2017. p. 45. Retrieved 16 April 2018.
- ↑ Bert van Leeuwen (Jun 2016). "Intermodal Container Leasing". World Leasing Yearbook. Retrieved 16 April 2018.
External links
- Top 30 Container Shipping Lines In The World at the Wayback Machine (archived January 19, 2016)
This article is issued from
Wikipedia.
The text is licensed under Creative Commons - Attribution - Sharealike.
Additional terms may apply for the media files.
