List of Welsh areas by percentage of Welsh-speakers
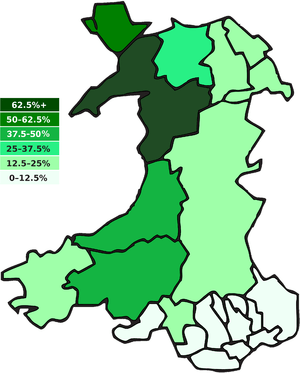
This is a list of subdivisions of Wales by the percentage of those professing some skills in the Welsh language in the 2011 UK census. The census did not record Welsh-speakers living outside Wales.
The census determined that 19.01% of the population could speak Welsh and 14.57% could speak, read and write in the language.[1]
Census breakdown
The Census produced a detailed breakdown of skills as:[2]
- Understands spoken Welsh (no other skills)
- Speaks but does not read or write Welsh
- Speaks and reads but does not write Welsh
- Speaks, reads and writes Welsh
- Other combination of skills; e.g. Can read but not speak.
- No knowledge of Welsh.
Those with knowledge of the Welsh language 2011
For the purpose of the first table, all combinations other than "no knowledge of Welsh" have been combined, giving a percentage of people that state they have some communication skills in the Welsh language rather than an ability to speak Welsh. The totals include children whose parents have filled in the Census details on their behalf.
| Area | Can communicate in Welsh | No knowledge of Welsh | Population total | % of those who have some knowledge of Welsh | % of those who have no knowledge of Welsh |
|---|---|---|---|---|---|
| Blaenau Gwent | 7,808 | 62,006 | 69,814 | 11.18% | 88.82% |
| Bridgend | 23,532 | 115,646 | 139,178 | 16.91% | 83.09% |
| Caerphilly | 28,059 | 150,747 | 178,806 | 15.69% | 84.31% |
| Cardiff | 54,504 | 291,586 | 346,090 | 15.74% | 84.25% |
| Carmarthenshire | 105,032 | 78,745 | 183,777 | 57.15% | 42.85% |
| Ceredigion | 43,366 | 32,556 | 75,922 | 57.12% | 42.88% |
| Conwy | 44,614 | 70,614 | 115,228 | 38.72% | 61.28% |
| Denbighshire | 32,528 | 61,206 | 93,734 | 34.70% | 65.30% |
| Flintshire | 30,455 | 122,051 | 152,506 | 19.97% | 80.03% |
| Gwynedd | 88,853 | 33,021 | 121,874 | 72.91% | 27.09% |
| Isle of Anglesey | 47,821 | 21,930 | 69,751 | 68.56% | 31.44% |
| Merthyr Tydfil | 8,640 | 50,162 | 58,802 | 14.69% | 85.31% |
| Monmouthshire | 12,500 | 78,823 | 91,323 | 13.69% | 86.31% |
| Neath Port Talbot | 33,896 | 105,916 | 139,812 | 24.24% | 75.76% |
| Newport | 18,490 | 127,246 | 145,736 | 12.69% | 87.31% |
| Pembrokeshire | 32,930 | 89,509 | 122,439 | 26.90% | 73.10% |
| Powys | 36,602 | 96,374 | 132,976 | 27.53% | 72.47% |
| Rhondda Cynon Taf | 44,911 | 189,499 | 234,410 | 19.16% | 80.84% |
| Swansea | 45,085 | 193,938 | 239,023 | 18.86% | 81.14% |
| The Vale of Glamorgan | 20,093 | 106,243 | 126,336 | 15.90% | 84.10% |
| Torfaen | 11,950 | 79,125 | 91,075 | 13.12% | 86.88% |
| Wrexham | 27,812 | 107,032 | 134,844 | 20.63% | 79.37% |
| Totals | 799,481 | 2,263,975 | 3,063,456 | 26.10% | 73.90% |
Those with the ability to speak Welsh 2011
The second table includes only those people who stated in the 2011 Census that they are able to speak the Welsh language. It was these statistics that were reported by the press when the first data samples were released in 2012.[3]
|
 |
Annual Population Survey estimates
In addition to official Census data, the Annual Population Survey publishes sample-based estimates on the number of self-proclaimed Welsh speakers several times a year based on estimates for the previous year. The third table displays uses this data to show estimates for the percentage of people who say they can speak Welsh at the time of each survey, from June 2016 onwards.[4]
See alsoReferences
External links
|