Leeds City Council election, 1995
The Leeds City Council elections were held on Thursday, 4 May 1995, with one third of the council up for election, alongside a vacancy in Roundhay.
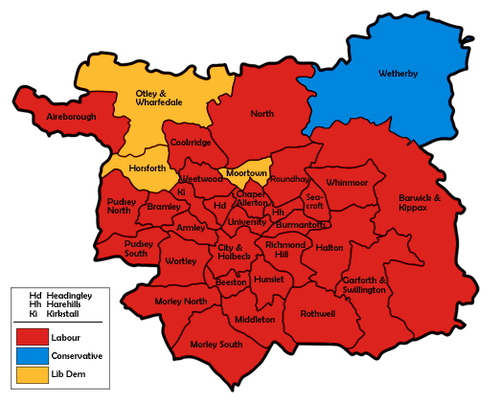
Labour won another victory over the opposition parties, winning a record number of wards as the Labour gains extended further into Conservative heartland. A disastrous result for the Tories saw them fall even further from the record lows they set the year before, losing Cookridge, North and Roundhay for the first time - with Wetherby their sole defence. Labour gained eight in total, securing second councillors in the previously reliable Conservative wards of Aireborough, Halton, Pudsey North and Weetwood. As a result, Labour represented over three-quarters of the council with a formidable majority of 51.
Having overtaken the Conservative vote the previous year, the Lib Dems fell behind again, but unlike the Conservatives were able to defend their three seats. As such, the holding up of the Labour's vote from strong figure achieved the year before was enough to win them their greatest share, amidst a poor turnout of 32.5%.[1]
Elsewhere, the Greens firmed up their second place in Wortley and increased their slate to cover half of the wards, whilst the Liberals fielded one fewer to match the number of Independents - all three of which making little impact. The leftist splinters from Labour, Militant Labour, and the now-defunct CPGB, Communist Party of Britain also fielded a first candidate each.[2]
Election result
| Party | Seats | Gains | Losses | Net gain/loss | Seats % | Votes % | Votes | +/− | |
|---|---|---|---|---|---|---|---|---|---|
| Labour | 30 | 8 | 0 | +8 | 88.2 | 59.0 | 103,585 | +7.7% | |
| Liberal Democrat | 3 | 0 | 0 | 0 | 8.8 | 18.4 | 32,340 | -5.7% | |
| Conservative | 1 | 0 | 8 | -8 | 2.9 | 19.4 | 34,137 | -2.6% | |
| Green | 0 | 0 | 0 | 0 | 0.0 | 2.3 | 3,964 | +0.4% | |
| Liberal | 0 | 0 | 0 | 0 | 0.0 | 0.4 | 739 | -0.3% | |
| Militant Labour | 0 | 0 | 0 | 0 | 0.0 | 0.2 | 368 | +0.2% | |
| Independent | 0 | 0 | 0 | 0 | 0.0 | 0.2 | 354 | +0.2% | |
| Communist | 0 | 0 | 0 | 0 | 0.0 | 0.0 | 57 | +0.0% | |
This result has the following consequences for the total number of seats on the council after the elections:
| Party | Previous council | New council | |||
|---|---|---|---|---|---|
| Labour | 67 | 75 | |||
| Conservative | 23 | 15 | |||
| Liberal Democrat | 8 | 8 | |||
| Independent | 1 | 1 | |||
| Total | 99 | 99 | |||
| Working majority | 35 | 51 | |||
Ward results
| Party | Candidate | Votes | % | ± | |
|---|---|---|---|---|---|
| Labour | M. Dunn | 3,939 | 50.5 | +3.2 | |
| Conservative | M. Atkinson | 2,971 | 38.1 | +8.7 | |
| Liberal Democrat | D. Gowland | 896 | 11.5 | -11.9 | |
| Majority | 968 | 12.4 | -5.4 | ||
| Turnout | 7,806 | ||||
| Labour gain from Conservative | Swing | -2.7 | |||
| Party | Candidate | Votes | % | ± | |
|---|---|---|---|---|---|
| Labour | P. Paley | 3,085 | 70.3 | +9.3 | |
| Conservative | G. Broadbent | 429 | 9.8 | -1.9 | |
| Liberal | G. Lawson | 426 | 9.7 | -5.2 | |
| Liberal Democrat | A. Davies | 285 | 6.5 | -5.9 | |
| Green | Q. Cooper | 164 | 3.7 | +3.7 | |
| Majority | 2,656 | 60.5 | +14.4 | ||
| Turnout | 4,389 | ||||
| Labour hold | Swing | +5.6 | |||
| Party | Candidate | Votes | % | ± | |
|---|---|---|---|---|---|
| Labour | M. Monks | 4,742 | 71.2 | +7.0 | |
| Conservative | C. Ward | 1,267 | 19.0 | -3.3 | |
| Liberal Democrat | D. Lindley | 650 | 9.8 | -3.7 | |
| Majority | 3,475 | 52.2 | +10.3 | ||
| Turnout | 6,659 | ||||
| Labour hold | Swing | +5.1 | |||
| Party | Candidate | Votes | % | ± | |
|---|---|---|---|---|---|
| Labour | P. Bellwood | 2,654 | 77.1 | +7.0 | |
| Conservative | H. Woodhead | 412 | 12.0 | -3.7 | |
| Liberal Democrat | S. Sadler | 328 | 9.5 | -4.7 | |
| Green | T. Jackson | 50 | 1.5 | +1.5 | |
| Majority | 2,242 | 65.1 | +10.7 | ||
| Turnout | 3,444 | ||||
| Labour hold | Swing | +5.3 | |||
| Party | Candidate | Votes | % | ± | |
|---|---|---|---|---|---|
| Labour | A. Ross | 3,335 | 79.1 | +6.7 | |
| Conservative | R. Netzel | 340 | 8.1 | -1.3 | |
| Liberal Democrat | N. Amor | 306 | 7.3 | -4.9 | |
| Liberal | E. Bee | 234 | 5.6 | -0.6 | |
| Majority | 2,995 | 71.1 | +10.8 | ||
| Turnout | 4,215 | ||||
| Labour hold | Swing | +4.0 | |||
| Party | Candidate | Votes | % | ± | |
|---|---|---|---|---|---|
| Labour | P. Hennigan | 2,878 | 64.9 | +10.1 | |
| Liberal Democrat | A. Kimber | 1,392 | 31.4 | -10.5 | |
| Conservative | G. Castle | 164 | 3.7 | +0.4 | |
| Majority | 1,486 | 33.5 | +20.6 | ||
| Turnout | 4,434 | ||||
| Labour hold | Swing | +10.3 | |||
| Party | Candidate | Votes | % | ± | |
|---|---|---|---|---|---|
| Labour | N. Hutchinson | 3,500 | 73.6 | +7.6 | |
| Conservative | I. Baxter | 621 | 13.1 | -2.6 | |
| Liberal Democrat | I. Findlay | 430 | 9.0 | -2.9 | |
| Green | C. Ni Bhean | 147 | 3.1 | -3.3 | |
| Communist | S. Nolan | 57 | 1.2 | +1.2 | |
| Majority | 2,879 | 60.5 | +10.2 | ||
| Turnout | 4,755 | ||||
| Labour hold | Swing | +5.1 | |||
| Party | Candidate | Votes | % | ± | |
|---|---|---|---|---|---|
| Labour | I. Coulthard | 2,735 | 77.0 | +2.8 | |
| Liberal Democrat | P. Bardon | 363 | 10.2 | +2.3 | |
| Conservative | D. Boynton | 254 | 7.1 | -1.9 | |
| Green | D. Blakemore | 201 | 5.7 | +1.4 | |
| Majority | 2,372 | 66.8 | +1.6 | ||
| Turnout | 3,553 | ||||
| Labour hold | Swing | +0.2 | |||
| Party | Candidate | Votes | % | ± | |
|---|---|---|---|---|---|
| Labour | A. Procter | 2,551 | 40.8 | +11.1 | |
| Conservative | A. Wheatley | 2,484 | 39.7 | -1.3 | |
| Liberal Democrat | D. Pratt | 1,218 | 19.5 | -9.7 | |
| Majority | 67 | 1.1 | -10.2 | ||
| Turnout | 6,253 | ||||
| Labour gain from Conservative | Swing | +6.2 | |||
| Party | Candidate | Votes | % | ± | |
|---|---|---|---|---|---|
| Labour | S. Haines | 5,056 | 72.9 | +7.2 | |
| Liberal Democrat | I. Dowling | 984 | 14.2 | -1.8 | |
| Conservative | J. Stott | 895 | 12.9 | -5.4 | |
| Majority | 4,072 | 58.7 | +11.3 | ||
| Turnout | 6,935 | ||||
| Labour hold | Swing | +4.5 | |||
| Party | Candidate | Votes | % | ± | |
|---|---|---|---|---|---|
| Labour | D. McGee | 3,734 | 57.8 | +7.5 | |
| Conservative | W. Hyde | 1,995 | 30.9 | -2.4 | |
| Liberal Democrat | A. Appleyard | 568 | 8.8 | -7.6 | |
| Green | D. Harbud | 162 | 2.5 | +2.5 | |
| Majority | 1,739 | 26.9 | +9.8 | ||
| Turnout | 6,459 | ||||
| Labour gain from Conservative | Swing | +4.9 | |||
| Party | Candidate | Votes | % | ± | |
|---|---|---|---|---|---|
| Labour | J. Clare | 3,070 | 81.0 | +13.1 | |
| Conservative | T. Gerrard | 293 | 7.7 | -4.3 | |
| Liberal Democrat | R. Senior | 286 | 7.5 | -7.9 | |
| Green | M. Elliot | 140 | 3.7 | -0.9 | |
| Majority | 2,777 | 73.3 | +20.8 | ||
| Turnout | 3,789 | ||||
| Labour hold | Swing | +8.7 | |||
| Party | Candidate | Votes | % | ± | |
|---|---|---|---|---|---|
| Labour | P. Moxon | 3,071 | 68.8 | +9.1 | |
| Liberal Democrat | B. Thompson | 621 | 13.9 | -6.6 | |
| Conservative | A. Hainsworth | 464 | 10.4 | -2.0 | |
| Green | P. Alexander | 306 | 6.9 | -0.6 | |
| Majority | 2,450 | 54.9 | +15.7 | ||
| Turnout | 4,462 | ||||
| Labour hold | Swing | +7.8 | |||
| Party | Candidate | Votes | % | ± | |
|---|---|---|---|---|---|
| Liberal Democrat | B. Cleasby | 2,794 | 43.6 | -11.6 | |
| Labour | R. Haggerty | 1,977 | 30.9 | +12.2 | |
| Conservative | R. Whitehead | 1,558 | 24.3 | -1.8 | |
| Independent | A. Gale | 79 | 1.2 | +1.2 | |
| Majority | 817 | 12.7 | -16.4 | ||
| Turnout | 6,408 | ||||
| Liberal Democrat hold | Swing | -11.9 | |||
| Party | Candidate | Votes | % | ± | |
|---|---|---|---|---|---|
| Labour | J. Erskine | 2,708 | 85.7 | +4.0 | |
| Liberal Democrat | G. Melnick | 191 | 6.0 | -3.7 | |
| Conservative | J. Eastwood | 170 | 5.4 | -3.2 | |
| Green | G. Duncan | 91 | 2.9 | +2.9 | |
| Majority | 2,517 | 79.7 | +7.8 | ||
| Turnout | 3,160 | ||||
| Labour hold | Swing | +3.8 | |||
| Party | Candidate | Votes | % | ± | |
|---|---|---|---|---|---|
| Labour | J. Illingworth | 3,400 | 77.3 | +7.8 | |
| Green | A. Mander | 416 | 9.5 | +9.5 | |
| Liberal Democrat | D. Freeman | 256 | 5.8 | -6.6 | |
| Conservative | F. McKimmings | 248 | 5.6 | -2.0 | |
| Liberal | N. Nowosielski | 79 | 1.8 | +1.8 | |
| Majority | 2,984 | 67.8 | +10.7 | ||
| Turnout | 4,399 | ||||
| Labour hold | Swing | -0.8 | |||
| Party | Candidate | Votes | % | ± | |
|---|---|---|---|---|---|
| Labour | R. Finnigan | 3,162 | 83.3 | +5.7 | |
| Conservative | S. McBarron | 302 | 8.0 | -2.4 | |
| Liberal Democrat | Q. Brown | 227 | 6.0 | -6.1 | |
| Green | A. Blackburn | 107 | 2.8 | +2.8 | |
| Majority | 2,860 | 75.3 | +9.8 | ||
| Turnout | 3,798 | ||||
| Labour hold | Swing | +4.0 | |||
| Party | Candidate | Votes | % | ± | |
|---|---|---|---|---|---|
| Liberal Democrat | C. Brett | 2,932 | 49.6 | -8.2 | |
| Labour | M. Hughes | 1,871 | 31.6 | +10.7 | |
| Conservative | J. Dagwell | 989 | 16.7 | -4.6 | |
| Independent | H. Alexander | 123 | 2.1 | +2.1 | |
| Majority | 1,061 | 17.9 | -18.6 | ||
| Turnout | 5,915 | ||||
| Liberal Democrat hold | Swing | -9.4 | |||
| Party | Candidate | Votes | % | ± | |
|---|---|---|---|---|---|
| Labour | P. Jones | 3,782 | 66.4 | +9.0 | |
| Conservative | J. Galek | 1,142 | 20.0 | -8.4 | |
| Liberal Democrat | M. Betteridge | 509 | 8.9 | -5.2 | |
| Green | T. Sykes | 264 | 4.6 | +4.6 | |
| Majority | 2,640 | 46.3 | +17.4 | ||
| Turnout | 5,697 | ||||
| Labour hold | Swing | +8.7 | |||
| Party | Candidate | Votes | % | ± | |
|---|---|---|---|---|---|
| Labour | R. Mitchell | 3,509 | 63.4 | +5.4 | |
| Liberal Democrat | T. Leadley | 1,283 | 23.2 | -4.5 | |
| Conservative | A. Grayson | 741 | 13.4 | -0.9 | |
| Majority | 2,226 | 40.2 | +9.9 | ||
| Turnout | 5,533 | ||||
| Labour hold | Swing | +4.9 | |||
| Party | Candidate | Votes | % | ± | |
|---|---|---|---|---|---|
| Labour | J. Sully | 2,047 | 35.2 | +8.2 | |
| Conservative | R. Feldman | 1,956 | 33.6 | -5.2 | |
| Liberal Democrat | S. Umpleby | 1,721 | 29.6 | -2.4 | |
| Green | P. Harris | 90 | 1.5 | -0.6 | |
| Majority | 91 | 1.6 | -5.2 | ||
| Turnout | 5,814 | ||||
| Labour gain from Conservative | Swing | +6.7 | |||
| Party | Candidate | Votes | % | ± | |
|---|---|---|---|---|---|
| Liberal Democrat | G. Kirkland | 3,295 | 40.8 | +1.6 | |
| Labour | J. Eveleigh | 2,753 | 34.1 | +6.1 | |
| Conservative | J. Bird | 2,022 | 25.1 | -6.4 | |
| Majority | 542 | 6.7 | -1.1 | ||
| Turnout | 8,070 | ||||
| Liberal Democrat hold | Swing | -2.2 | |||
| Party | Candidate | Votes | % | ± | |
|---|---|---|---|---|---|
| Labour | T. Spamer | 3,601 | 51.3 | +8.6 | |
| Conservative | I. Favell | 2,391 | 34.1 | +3.4 | |
| Liberal Democrat | R. Cam | 1,029 | 14.7 | -12.0 | |
| Majority | 1,210 | 17.2 | +5.1 | ||
| Turnout | 7,021 | ||||
| Labour gain from Conservative | Swing | +2.6 | |||
| Party | Candidate | Votes | % | ± | |
|---|---|---|---|---|---|
| Labour | J. Jarosz | 3,397 | 56.5 | +9.8 | |
| Liberal Democrat | R. Keighley | 1,821 | 30.3 | -9.7 | |
| Conservative | G. Winnard | 797 | 13.3 | -0.1 | |
| Majority | 1,576 | 26.2 | +19.5 | ||
| Turnout | 6,015 | ||||
| Labour hold | Swing | +9.7 | |||
| Party | Candidate | Votes | % | ± | |
|---|---|---|---|---|---|
| Labour | M. Simmons | 3,095 | 84.7 | +6.9 | |
| Liberal Democrat | K. Norman | 385 | 10.5 | -3.9 | |
| Conservative | W. Birch | 176 | 4.8 | -3.0 | |
| Majority | 2,710 | 74.1 | +10.8 | ||
| Turnout | 3,656 | ||||
| Labour hold | Swing | +5.4 | |||
| Party | Candidate | Votes | % | ± | |
|---|---|---|---|---|---|
| Labour | B. Walker | 3,481 | 72.8 | +7.8 | |
| Liberal Democrat | M. Galdas | 780 | 16.3 | -3.0 | |
| Conservative | R. Heeson | 521 | 10.9 | -4.9 | |
| Majority | 2,701 | 56.5 | +10.8 | ||
| Turnout | 4,782 | ||||
| Labour hold | Swing | +5.4 | |||
| Party | Candidate | Votes | % | ± | |
|---|---|---|---|---|---|
| Labour | D. Lewis | 2,839 | 43.8 | +12.1 | |
| Labour | J. White | 2,765 | |||
| Conservative | M. Burnell | 2,186 | 33.7 | -5.3 | |
| Conservative | J. Suttenstall | 2,148 | |||
| Liberal Democrat | J. Sefton | 1,193 | 18.4 | -8.1 | |
| Liberal Democrat | W. Pickard | 1,057 | |||
| Green | A. Ketchin | 260 | 4.0 | +1.3 | |
| Majority | 653 | 10.1 | +2.8 | ||
| Turnout | 6,478 | ||||
| Labour gain from Conservative | Swing | ||||
| Labour gain from Conservative | Swing | +8.7 | |||
| Party | Candidate | Votes | % | ± | |
|---|---|---|---|---|---|
| Labour | D. Gabb | 3,298 | 85.4 | +1.8 | |
| Liberal Democrat | S. Fisher | 299 | 7.7 | -1.4 | |
| Conservative | R. Jones | 266 | 6.9 | -0.4 | |
| Majority | 2,999 | 77.6 | +3.1 | ||
| Turnout | 3,863 | ||||
| Labour hold | Swing | +1.6 | |||
| Party | Candidate | Votes | % | ± | |
|---|---|---|---|---|---|
| Labour | G. Harper | 2,522 | 69.8 | +6.2 | |
| Militant Labour | C. Hill | 368 | 10.2 | +10.2 | |
| Liberal Democrat | A. Norman | 279 | 7.7 | -6.4 | |
| Conservative | R. Winfield | 241 | 6.7 | -2.5 | |
| Green | A. Begg | 205 | 5.7 | -7.5 | |
| Majority | 2,154 | 63.5 | +14.1 | ||
| Turnout | 3,615 | ||||
| Labour hold | Swing | -2.0 | |||
| Party | Candidate | Votes | % | ± | |
|---|---|---|---|---|---|
| Labour | G. Platt | 2,837 | 42.8 | +2.4 | |
| Liberal Democrat | J. Ewens | 2,500 | 37.7 | +3.0 | |
| Conservative | D. Boulton | 1,134 | 17.1 | -7.7 | |
| Green | C. Nash | 153 | 2.3 | +2.3 | |
| Majority | 337 | 5.1 | -0.5 | ||
| Turnout | 6,624 | ||||
| Labour gain from Conservative | Swing | -0.3 | |||
| Party | Candidate | Votes | % | ± | |
|---|---|---|---|---|---|
| Conservative | D. Hudson | 3,518 | 46.4 | -3.8 | |
| Labour | R. Steel | 2,407 | 31.7 | +11.3 | |
| Liberal Democrat | P. Boughton | 1,662 | 21.9 | -7.5 | |
| Majority | 1,111 | 14.6 | -6.2 | ||
| Turnout | 7,587 | ||||
| Conservative hold | Swing | -7.5 | |||
| Party | Candidate | Votes | % | ± | |
|---|---|---|---|---|---|
| Labour | E. Pickard | 3,149 | 71.0 | +7.2 | |
| Conservative | W. Hanbury | 728 | 16.4 | -5.0 | |
| Liberal Democrat | G. Roberts | 405 | 9.1 | -5.6 | |
| Independent | A. Thorpe | 152 | 3.4 | +3.4 | |
| Majority | 2,421 | 54.6 | +12.2 | ||
| Turnout | 4,434 | ||||
| Labour hold | Swing | +6.1 | |||
| Party | Candidate | Votes | % | ± | |
|---|---|---|---|---|---|
| Labour | F. Hamilton | 3,400 | 61.6 | +4.1 | |
| Green | D. Blackburn | 1,208 | 21.9 | +2.1 | |
| Conservative | M. Best | 462 | 8.4 | -3.2 | |
| Liberal Democrat | D. Brayshaw | 452 | 8.2 | -3.0 | |
| Majority | 2,192 | 39.7 | +2.0 | ||
| Turnout | 5,522 | ||||
| Labour hold | Swing | +1.0 | |||
By-elections between 1995 and 1996
| Party | Candidate | Votes | % | ± | |
|---|---|---|---|---|---|
| Labour | Michael Lyons | 1,792 | 84.2 | -0.5 | |
| Liberal Democrat | 233 | 10.9 | +0.4 | ||
| Conservative | 103 | 4.8 | +0.0 | ||
| Majority | 1,559 | 73.3 | -0.8 | ||
| Turnout | 2,128 | 15.0 | -10.8 | ||
| Labour hold | Swing | -0.4 | |||
References
- ↑ "Local Election Results, 1999". Centre for Research into Elections and Social Trends. Archived from the original on 2011-07-24. Retrieved 2010-02-08.
- 1 2 3 4 5 6 7 8 9 10 11 12 13 14 15 16 17 18 19 20 21 22 23 24 25 26 27 28 29 30 31 32 33 34 "District results: Leeds". The Yorkshire Post. 5 May 1995.
- ↑ "Local Authority Byelection Results". gwydir.demon.co.uk. Retrieved 2012-12-13.
| Metropolitan boroughs |
|
|---|---|
| Unitary authorities |
|
| District councils |
|
| Welsh councils |
|
| Scottish councils |
|
| City of Bradford Metropolitan District Council | |
|---|---|
| Calderdale Metropolitan Borough Council | |
| Kirklees Metropolitan Borough Council | |
| Leeds City Council |
|
| Wakefield Metropolitan District Council | |
| West Yorkshire County Council | |
| West Riding County Council | |
| |