Fife Council election, 1995
|
| ||||||||||||||||||||||||||||||||||||||||
| ||||||||||||||||||||||||||||||||||||||||
All 90 seats to Fife Council 45 seats needed for a majority | ||||||||||||||||||||||||||||||||||||||||
|---|---|---|---|---|---|---|---|---|---|---|---|---|---|---|---|---|---|---|---|---|---|---|---|---|---|---|---|---|---|---|---|---|---|---|---|---|---|---|---|---|
| ||||||||||||||||||||||||||||||||||||||||
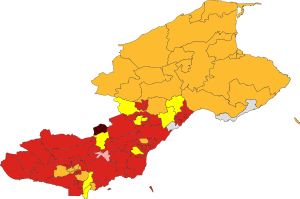 Results by ward. | ||||||||||||||||||||||||||||||||||||||||
| ||||||||||||||||||||||||||||||||||||||||
1995 Elections to Fife Council were held on the 6 April 1995 and were the first for the newly formed Unitary authority for Fife Council, which was created under the Local Government etc (Scotland) Act 1994
Election results
| Party | Seats | Gains | Losses | Net gain/loss | Seats % | Votes % | Votes | +/− | |
|---|---|---|---|---|---|---|---|---|---|
| Labour | 52 | 46.5% | 53,759 | ||||||
| Liberal Democrats | 24 | 20.1% | 23,208 | ||||||
| SNP | 9 | 21.2% | 24,550 | ||||||
| Conservative | 0 | 5.8% | 6,744 | ||||||
| Independent | 2 | 3.1% | 3,590 | ||||||
| Other parties | 3 | 3.2% | 3,695 | ||||||
Turnout was 42.2%
Party performance
Labour performed very well continuing control of its majority.
References
External links
| Metropolitan boroughs |
|
|---|---|
| Unitary authorities |
|
| District councils |
|
| Welsh councils |
|
| Scottish councils |
|
This article is issued from
Wikipedia.
The text is licensed under Creative Commons - Attribution - Sharealike.
Additional terms may apply for the media files.