Kawayan, Biliran
| Kawayan | ||
|---|---|---|
| Municipality | ||
| Municipality of Kawayan | ||
| ||
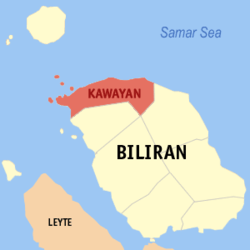 Map of Biliran with Kawayan highlighted | ||
.svg.png) Kawayan Location within the Philippines | ||
| Coordinates: 11°42′N 124°22′E / 11.7°N 124.37°ECoordinates: 11°42′N 124°22′E / 11.7°N 124.37°E | ||
| Country |
| |
| Region | Eastern Visayas (Region VIII) | |
| Province | Biliran | |
| District | Lone district | |
| Barangays | 20 (see Barangays) | |
| Government [1] | ||
| • Type | Sangguniang Bayan | |
| • Mayor | Gerardo S. Espina Sr. | |
| • Electorate | 13,983 voters (2016) | |
| Area [2] | ||
| • Total | 61.02 km2 (23.56 sq mi) | |
| Population (2015 census)[3] | ||
| • Total | 20,291 | |
| • Density | 330/km2 (860/sq mi) | |
| Time zone | UTC+8 (PST) | |
| ZIP code | 6545 | |
| PSGC | 087806000 | |
| IDD : area code | +63 (0)53 | |
| Climate type | Tropical monsoon climate | |
| Income class | 5th municipal income class | |
| Revenue (₱) | 61,782,682.76 (2016) | |
| Native languages |
Waray Tagalog | |
| Website |
www | |

Kawayan, officially the Municipality of Kawayan, (Waray: Bungto san Kawayan; Cebuano: Lungsod sa Kawayan; Filipino: Bayan ng Kawayan), is a 5th class municipality in the province of Biliran, Philippines. According to the 2015 census, it has a population of 20,291 people.[3]
Geography
Kawayan is located at 11°42′N 124°22′E / 11.7°N 124.37°E.
According to the Philippine Statistics Authority, the municipality has a land area of 61.02 square kilometres (23.56 sq mi) [2] constituting 11.38% of the 536.01-square-kilometre- (206.95 sq mi) total area of Biliran.
Barangays
Kawayan is politically subdivided into 20 barangays.[4] In 1948, the barangays of Ungale, Tuo, and Inasuyan were transferred from Caibiran, Biliran.[5]
| PSGC | Barangay | Population | ±% p.a. | |||
|---|---|---|---|---|---|---|
| 2015[3] | 2010[6] | |||||
| 087806001 | Baganito | 2.6% | 536 | 550 | −0.49% | |
| 087806002 | Balacson | 4.3% | 868 | 924 | −1.18% | |
| 087806003 | Bilwang | 3.3% | 663 | 630 | 0.98% | |
| 087806004 | Bulalacao | 4.1% | 842 | 790 | 1.22% | |
| 087806005 | Burabod | 3.0% | 615 | 710 | −2.70% | |
| 087806006 | Inasuyan | 5.6% | 1,129 | 1,114 | 0.25% | |
| 087806007 | Kansanok | 3.4% | 688 | 717 | −0.78% | |
| 087806008 | Mada‑o | 5.6% | 1,132 | 1,044 | 1.55% | |
| 087806009 | Mapuyo | 8.5% | 1,731 | 1,815 | −0.90% | |
| 087806010 | Masagaosao | 3.9% | 787 | 763 | 0.59% | |
| 087806011 | Masagongsong | 2.6% | 526 | 596 | −2.35% | |
| 087806012 | Poblacion | 5.9% | 1,206 | 1,121 | 1.40% | |
| 087806013 | Tabunan North | 0.9% | 177 | 171 | 0.66% | |
| 087806014 | Tubig Guinoo | 3.9% | 785 | 739 | 1.16% | |
| 087806015 | Tucdao | 9.4% | 1,917 | 1,951 | −0.33% | |
| 087806016 | Ungale | 11.0% | 2,240 | 2,264 | −0.20% | |
| 087806017 | Balite | 5.0% | 1,019 | 1,008 | 0.21% | |
| 087806018 | Buyo | 4.6% | 937 | 884 | 1.11% | |
| 087806019 | Villa Cornejo (Looc) | 5.6% | 1,132 | 1,154 | −0.37% | |
| 087806020 | San Lorenzo | 6.7% | 1,361 | 1,293 | 0.98% | |
| Total | 20,291 | 20,238 | 0.05% | |||
Demographics
| Population census of Kawayan | ||
|---|---|---|
| Year | Pop. | ±% p.a. |
| 1918 | 7,101 | — |
| 1939 | 8,498 | +0.86% |
| 1948 | 9,618 | +1.39% |
| 1960 | 12,252 | +2.04% |
| 1970 | 12,870 | +0.49% |
| 1975 | 14,568 | +2.52% |
| 1980 | 16,183 | +2.12% |
| 1990 | 15,056 | −0.72% |
| 1995 | 16,424 | +1.64% |
| 2000 | 17,507 | +1.38% |
| 2007 | 19,053 | +1.17% |
| 2010 | 20,238 | +2.22% |
| 2015 | 20,291 | +0.05% |
| Source: Philippine Statistics Authority[3][6][7][8] | ||
In the 2015 census, Kawayan had a population of 20,291.[3] The population density was 330 inhabitants per square kilometre (850/sq mi).
References
- ↑ "Municipality". Quezon City, Philippines: Department of the Interior and Local Government. Retrieved 31 May 2013.
- 1 2 "Province: Biliran". PSGC Interactive. Quezon City, Philippines: Philippine Statistics Authority. Retrieved 12 November 2016.
- 1 2 3 4 5 Census of Population (2015). "Region VIII (Eastern Visayas)". Total Population by Province, City, Municipality and Barangay. PSA. Retrieved 20 June 2016.
- ↑ "Municipal: Kawayan, Biliran". PSGC Interactive. Quezon City, Philippines: Philippine Statistics Authority. Retrieved 8 January 2016.
- ↑ "An act to separate the barrios of Ungale, Tuo, and Inasuyan from the municipality of Caibiran, province of Leyte, and to merge these barrios with the municipality of Kawayan, of the same province". LawPH.com. Retrieved 2011-04-08.
- 1 2 Census of Population and Housing (2010). "Region VIII (Eastern Visayas)". Total Population by Province, City, Municipality and Barangay. NSO. Retrieved 29 June 2016.
- ↑ Censuses of Population (1903–2007). "Region VIII (Eastern Visayas)". Table 1. Population Enumerated in Various Censuses by Province/Highly Urbanized City: 1903 to 2007. NSO.
- ↑ "Province of Biliran". Municipality Population Data. Local Water Utilities Administration Research Division. Retrieved 17 December 2016.
| Municipalities | |
|---|---|