Health insurance coverage in the United States
| This article is part of a series on |
| Healthcare reform in the United States of America |
|---|
 |
|
Legislation
|
|
Third-party payment models |
|
|
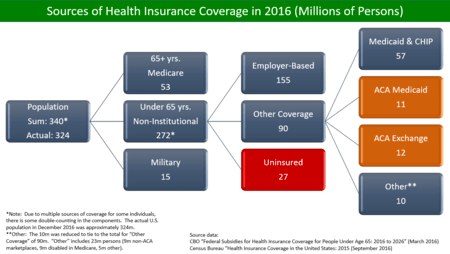
Health insurance coverage in the United States is provided by several public and private sources. During 2016, the U.S. population overall was approximately 325 million, with 53 million persons 65 years of age and over covered by the federal Medicare program. The 272 million non-institutional persons under age 65 either obtained their coverage from employer-based (155 million) or non-employer based (90 million) sources, or were uninsured (27 million).[1] Approximately 15 million military personnel received coverage through the Veteran's Administration.[2] During the year 2016, 91.2% of Americans had health insurance coverage.[3] Despite being among the top world economic powers, the US remains the sole industrialized nation in the world without universal health care coverage.[4][5]
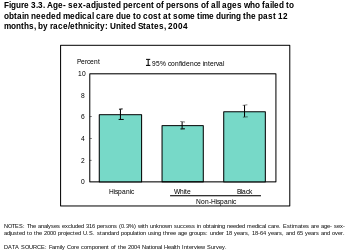
Prohibitively high cost is the primary reason Americans give for problems accessing health care.[5] At over 27 million, higher than the entire population of Australia, the number of people without health insurance coverage in the United States is one of the primary concerns raised by advocates of health care reform. Lack of health insurance is associated with increased mortality, in the range 30-90 thousand deaths per year, depending on the study.[6][7]
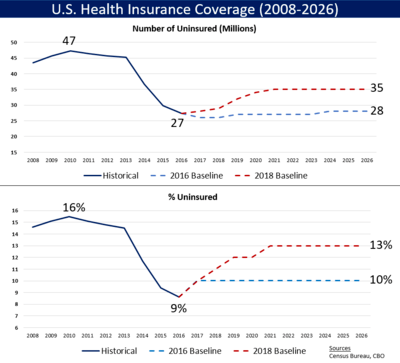
Multiple surveys indicate the number of uninsured fell between 2013-2016 due to expanded Medicaid eligibility and health insurance exchanges established due to the Patient Protection and Affordable Care Act, also known as the "ACA" or "Obamacare". According to the United States Census Bureau, in 2012 there were 45.6 million people in the US (14.8% of the under-65 population) who were without health insurance. Following the implementation of major ACA provisions in 2013, this figure fell by 18.3 million or 40%, to 27.3 million by 2016 or 8.6% of the under-65 population.[8][1]
The Census Bureau reported that the number of uninsured persons rose from 27.3 million in 2016 to 28.0 million in 2017. The uninsured rate rose from 8.6% in 2016 to 8.7% in 2017.[8] This was the first increase in the number and rate of uninsured since 2010. Further, the Commonwealth Fund estimated in May 2018 that the number of uninsured increased by 4 million from early 2016 to early 2018. The rate of those uninsured increased from 12.7% in 2016 to 15.5% under their methodology. The impact was greater among lower-income adults, who had a higher uninsured rate than higher-income adults. Regionally, the South and West had higher uninsured rates than the North and East. Further, those 18 states that have not expanded Medicaid had a higher uninsured rate than those that did.[9]
The causes of this rate of uninsurance remain a matter of political debate. Nearly half those without insurance cite its cost as the primary factor. Rising insurance costs have contributed to a trend in which fewer employers are offering health insurance, and many employers are managing costs by requiring higher employee contributions. Many of the uninsured are the working poor or are unemployed.[10]
Overview
Health insurance coverage is provided by several public and private sources in the United States. Analyzing these statistics is more challenging due to persons with multiple sources of insurance, such as those with coverage under both an employer plan and Medicaid. During 2016, the U.S. population overall was approximately 325 million, with 53 million persons 65 years of age and over covered by the federal Medicare program. For the remaining 272 million non-institutional persons under age 65:
- There were 155 million with employer-based coverage, 90 million with other coverage, and 27 million uninsured.
- Of the 90 million with other coverage, 57 million were covered by Medicaid and Children's Health Insurance Program (CHIP), 12 million were covered by the ACA/Obamacare exchanges, 11 million were covered by the ACA Medicaid expansion, and 10 million had other coverage, such as private insurance purchased outside the ACA exchanges.
- Of the 12 million on the ACA exchanges, 10 million received subsidies and 2 million did not.[1]
- Of the 27 million uninsured, 21 million (79%) were U.S. citizens while 6 million (21%) were non-citizens, including both documented and undocumented immigrants. In 2015, 45% of the uninsured were white, 32% were hispanic, and 15% were black.
- Approximately 15 million institutional (military) personnel were covered by the Veteran's Administration in 2015.[11]
- The uninsured rate fell from a peak of 18.2% in 2010 to 10.5% by 2015, due primarily to ACA/Obamacare along with improvements in the economy.
- States that expanded Medicaid under Obamacare had lower uninsured rates than states that did not.
- Inability to afford insurance was the primary reason cited by persons without coverage (46%).[10]
- Lack of health insurance is associated with increased mortality, in the range 30-90 thousand deaths per year, depending on the study. This figure is calculated based on 1 additional death per 300-800 persons without health insurance, on a base of 27 million uninsured persons.[6]
Estimates of the number of uninsured
The Congressional Budget Office (CBO) estimated the number of uninsured at 27 million in 2016, about 10% of the under-65 population of 272 million.[1] Gallup estimated in July 2014 that the uninsured rate for adults (persons 18 years of age and over) was 13.4% as of Q2 2014, down from 18.0% in Q3 2013 when the health insurance exchanges created under the Patient Protection and Affordable Care Act (PPACA or "Obamacare") first opened. The uninsured rate fell across nearly all demographic groups.[13] The Commonwealth Fund reported that the uninsured rate among adults 19-64 declined from 20% in Q3 2013 to 15% in Q2 2014, meaning approximately 9.5 million more adults had health insurance.[14]
The United States Census Bureau annually reports statistics on the uninsured. The 2016 Census Bureau Health Insurance highlights summary report states that:
- "The uninsured rate decreased between 2015 and 2016 by 0.3 percentage points as measured by the CPS ASEC. In 2016, the percentage of people without health insurance coverage for the entire calendar year was 8.8 percent, or 28.1 million, lower than the rate and number of uninsured in 2015 (9.1 percent or 29.0 million).
- The percentage of people with health insurance coverage for all or part of 2016 was 91.2 percent, higher than the rate in 2015 (90.9 percent).
- In 2016, private health insurance coverage continued to be more prevalent than government coverage, at 67.5 percent and 37.3 percent, respectively. Of the subtypes of health insurance coverage, employer-based insurance covered 55.7 percent of the population for some or all of the calendar year, followed by Medicaid (19.4 percent), Medicare (16.7 percent), direct-purchase (16.2 percent), and military coverage (4.6 percent).
- Between 2015 and 2016, the rate of Medicare coverage increased by 0.4 percentage points to cover 16.7 percent of people for part or all of 2016 (up from 16.3 percent in 2015). There was no statistically significant difference between 2015 and 2016 for any other subtype of health insurance.
- Between 2015 and 2016, the percentage of people without health insurance coverage dropped for most ages under 65, with generally larger decreases for working-age adults (aged 19 to 64).
- The percentage of uninsured children under age 19, 5.4 percent, did not significantly change between 2015 and 2016.
- In 2016, the uninsured rate for children under age 19 in poverty, 7.0 percent, was higher than the uninsured rate for children not in poverty, 5.0 percent.
- In 2016, non-Hispanic Whites had the lowest uninsured rate among race and Hispanic origin groups, at 6.3 percent. The uninsured rates for Blacks and Asians were higher than for non-Hispanic Whites, at 10.5 percent and 7.6 percent, respectively. Hispanics had the highest uninsured rate, at 16.0 percent.
- Between 2015 and 2016, the percentage of people without health insurance at any time during the year fell 0.4 percentage points for non-Hispanic Whites, down to 6.3 percent. There was no statistical change in the uninsured rate for Blacks, Asians, or Hispanics during this period.
- Between 2015 and 2016, the percentage of people without health insurance coverage at the time of interview decreased in 39 states. Eleven states and the District of Columbia did not have a statistically significant change in their uninsured rate."[15]
Coverage trends under President Trump
Gains in healthcare coverage under President Obama began to reverse under President Trump. The Commonwealth Fund estimated in May 2018 that the number of uninsured increased by 4 million from early 2016 to early 2018. The rate of those uninsured increased from 12.7% in 2016 to 15.5%. This was due to two factors: 1) Not addressing specific weaknesses in the ACA; and 2) Actions by the Trump administration that exacerbated those weaknesses. The impact was greater among lower-income adults, who had a higher uninsured rate than higher-income adults. Regionally, the South and West had higher uninsured rates than the North and East. Further, those 18 states that have not expanded Medicaid had a higher uninsured rate than those that did.[16]
Uninsured demographic
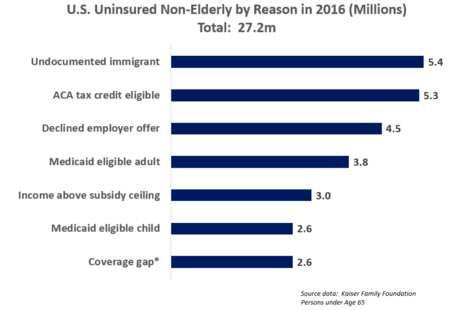
The Kaiser Family Foundation reported in October 2016 that there were 27.2 million uninsured under age 65, roughly 10% of the 272 million persons in that group. Kaiser reported that:
- 2.6 million were in the "coverage gap" due to the 19 states that chose not to expand the Medicaid program under the ACA/Obamacare, meaning their income was above the Medicaid eligibility limit but below the threshold for subsidies on the ACA exchanges (~44% to 100% of the federal poverty level or FPL);
- 5.4 million were undocumented immigrants;
- 4.5 million had an employer's insurance offer (making them ineligible for ACA/Obamacare coverage) but declined it;
- 3.0 million were ineligible for financial assistance under ACA/Obamacare due to sufficiently high income;
- 6.4 million were eligible for Medicaid or other public healthcare program but did not pursue it; and
- 5.3 million were eligible for ACA/Obamacare tax credits but did not enroll in the program.
- An estimated 46% cited costs as a barrier to getting insurance coverage.
- Nearly 12 million (43%) of persons were eligible for financial assistance (Medicaid or ACA subsidies) but did not enroll to obtain it.[18]
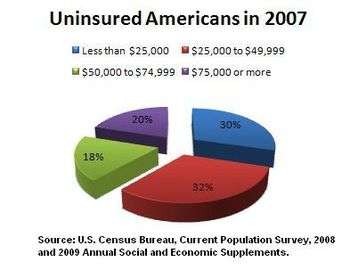
The Census Bureau reports that in 2007 nearly 37 million of the uninsured were employment-age adults (ages 18 to 64) and more than 27 million worked at least part-time. Approximately 61% of the roughly 45 million uninsured live in households with incomes under $50,000 (13.5 million below $25,000 and 14.5 million at $25,000 to $49,000).[19] And 38% live in households with incomes of $50,000 or more (8.5 million at $50,000 to $74,999 and 9.1 million at $75,000 or more). As stated by the Census Bureau, people of Hispanic origin were the most affected by being uninsured; nearly a third of Hispanics lack health insurance. In 2004, about 33% of Latinos were uninsured as opposed to 10% of white, non-Latinos[20] However, this rate decreased slightly from 2006 to 2007, from 15.3 to 14.8 million, a decrease of 2 percentage points (34.1% to 32.1%). The state with the highest percentage of uninsured was Texas (24.1% average for three years, 2004–2006). New Mexico has the second highest percentage of residents without health insurance at 22%.[21] It has been estimated that nearly one-fifth of the uninsured population is able to afford insurance, almost one quarter is eligible for public coverage, and the remaining 56% need financial assistance (8.9% of all Americans).[22] An estimated 5 million of those without health insurance are considered "uninsurable" because of pre-existing conditions.[23] A recent study concluded that 15% of people shopping online for health insurance are considered "uninsurable" because of a pre-existing condition, or for being overweight. This label does not necessarily mean they can never get health insurance, but that they will not qualify for standard individual coverage. People with similar health status can be covered via employer-provided health insurance, Medicare, or Medicaid.[24]
Uninsured children and young adults
The current estimate for uninsured children does not greatly differ from past estimates. In 2009 the Census Bureau states that 10.0 percent or 7.5 million children under the age of 18 were medically uninsured. Children living in poverty are 15.1 percent more likely than other children to be uninsured. The lower the income of a household the more likely it is they are uninsured. In 2009, a household with an annual income of 25,000 or less was only 26.6 percent likely not to have medical insurance and those with an annual income of 75,000 or more were only 9.1 percent unlikely to be insured.[25] According to the Census Bureau, in 2007, there were 8.1 million uninsured children in the US. Nearly 8 million young adults (those aged 18–24), were uninsured, representing 28.1% of their population. Young adults make up the largest age segment of the uninsured, are the most likely to be uninsured, and are one of the fastest growing segments of the uninsured population. They often lose coverage under their parents' health insurance policies or public programs when they reach age 19. Others lose coverage when they graduate from college. Many young adults do not have the kind of stable employment that would provide ongoing access to health insurance.[26][27] According to the Congressional Budget Office the plan the way it is now would have to cover unmarried dependents under their parents' insurance up to age 26. These changes also affect large employers, including self-insured firms, so that the firm bears the financial responsibility of providing coverage. The only exception to this is policies that were maintained continuously before the enactment of this legislation. Those policies would be grandfathered in.[28]
Non-citizens
Non-citizens are more likely to be uninsured than citizens, with a 43.8% uninsured rate. This is attributable to a higher likelihood of working in a low-wage job that does not offer health benefits, and restrictions on eligibility for public programs. The longer a non-citizen immigrant has been in the country, the less likely they are to be uninsured. In 2006, roughly 27% of immigrants entering the country before 1970 were uninsured, compared to 45% of immigrants entering the country in the 1980s and 49% of those entering between 2000 and 2006.
Most uninsured non-citizens are recent immigrants; almost half entered the country between 2000 and 2006, and 36% entered during the 1990s. Foreign-born non-citizens accounted for over 40% of the increase in the uninsured between 1990 and 1998, and over 90% of the increase between 1998 and 2003. One reason for the acceleration after 1998 may be restrictions imposed by the Personal Responsibility and Work Opportunity Reconciliation Act (PRWORA) of 1996. Almost seven out of ten (68%) of uninsured non-citizens live in California, Texas, Florida, or New York.[29]
Downturn effects
A report by the Kaiser Family Foundation in April 2008 found that US economic downturns place a significant strain on state Medicaid and SCHIP programs. The authors estimated that a 1% increase in the unemployment rate increase Medicaid and SCHIP enrollment by 1 million, and increase the number uninsured by 1.1 million. State spending on Medicaid and SCHIP would increase by $1.4 billion (total spending on these programs would increase by $3.4 billion). This increased spending would occur while state government revenues were declining. During the last downturn, the Jobs and Growth Tax Relief Reconciliation Act of 2003 (JGTRRA) included federal assistance to states, which helped states avoid tightening their Medicaid and SCHIP eligibility rules. The authors conclude that Congress should consider similar relief for the current economic downturn.[30]
Causes
.JPG)
Americans who are uninsured may be so because their job does not offer insurance; they are unemployed and cannot pay for insurance; or they may be financially able to buy insurance but consider the cost prohibitive.[31] During 2009 the continued low employment rate has negatively affected those who had previously been enrolled in employment-based insurance policies. Census Bureau states a 55 percent drop. Other uninsured Americans have chosen to join a health care sharing ministry as an alternative to insurance.[32]
Low-income workers are less likely than higher income individuals to be offered coverage by their employer (or by their spouse's employer) and less able to afford buying it on their own. Beginning with wage and price controls during World War II, and cemented by an income tax exemption ruling in 1954, most working Americans have received their health insurance from their employers.[33] However, recent trends have shown an ongoing decline in employer-sponsored health insurance benefits. In 2000, 68% of small companies with 3 to 199 workers offered health benefits. Since that time, that number has continued to drop to 2007, when 59% offered health benefits. For large firms with 200 or more workers, in 2000, 99% of employers offered health benefits; in 2007, that number stayed the same. On average, considering firms of all numbers of employees, in 2000, 69% offered health insurance, and that number has fallen nearly every year since, to 2007, when 60% of employers offered health insurance.[34]
One study published in 2008 found that people of average health are least likely to become uninsured if they have large group health coverage, more likely to become uninsured if they have small group coverage, and most likely to become uninsured if they have individual health insurance. But, "for people in poor or fair health, the chances of losing coverage are much greater for people who had small-group insurance than for those who had individual insurance." The authors attribute these results to the combination in the individual market of high costs and guaranteed renewability of coverage. Individual coverage costs more if it is purchased after a person becomes unhealthy but "provides better protection (compared to group insurance) against high premiums for already individually insured people who become high risk." Healthy individuals are more likely to drop individual coverage than less-expensive, subsidized employment-based coverage, but group coverage leaves them "more vulnerable to dropping or losing any and all coverage than does individual insurance" if they become seriously ill.[35]
Roughly a quarter of the uninsured are eligible for public coverage but are not enrolled.[36][37] Possible reasons include a lack of awareness of the programs or of how to enroll, reluctance due to a perceived stigma associated with public coverage, poor retention of enrollees, and burdensome administrative procedures. In addition, some state programs have enrollment caps.[37]
A study by the Kaiser Family Foundation published in June 2009 found that 45% of low-income adults under age 65 lack health insurance.[38] Almost a third of non-elderly adults are low income, with family incomes below 200% of the federal poverty level.[38] Low-income adults are generally younger, less well educated, and less likely to live in a household with a full-time worker than are higher income adults; these factors contribute to the likelihood of being uninsured.[38] In addition, the chances of being healthy decline with lower income; 19% of adults with incomes below the federal poverty level describe their health as fair or poor.[38]
Consequences
Insurance coverage helps save lives, by encouraging early detection and prevention of dangerous medical conditions. According to a 2014 study, the ACA likely prevented an estimated 50,000 preventable patient deaths from 2010 to 2013.[40] City University public health professors David Himmelstein and Steffie Woolhandler wrote in January 2017 that a rollback of the ACA's Medicaid expansion alone would cause an estimated 43,956 deaths annually.[41]
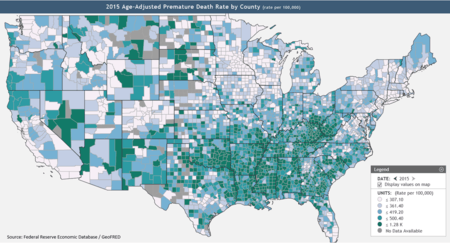
The Federal Reserve publishes data on premature death rates by county, defined as those dying below age 74.[39] According to the Kaiser Foundation, expanding Medicaid in the remaining 19 states would cover up to 4.5 million persons,[42] thus reducing mortality.[43] Texas, Oklahoma, Mississippi, Alabama, Georgia, Tennessee, Missouri and South Carolina, indicated on the Federal Reserve map (see graph at right) as having many counties with high premature mortality rates,[39] did not expand Medicaid.[42]
A study published in the American Journal of Public Health in 2009 found that lack of health insurance is associated with about 45,000 excess preventable deaths per year.[44] One of the authors characterized the results as "now one dies every 12 minutes."[45] Since then, as the number of uninsured has risen from about 46 million in 2009 to 48.6 million in 2012, the number of preventable deaths due to lack of insurance has grown to about 48,000 per year.[46]
A survey released in 2008 found that being uninsured impacts American consumers' health in the following ways:[47]
- More of the uninsured chose not to see a doctor when were sick or hurt (53%) vs 46% of the insured.
- Fewer of the uninsured (28%) report currently undergoing treatment or participating in a program to help them manage a chronic condition; 37% of the insured are receiving such treatment.
- 21% of the uninsured, vs. 16% of the insured, believe their overall health is below average for people in their age group.
The costs of treating the uninsured must often be absorbed by providers as charity care, passed on to the insured via cost-shifting and higher health insurance premiums, or paid by taxpayers through higher taxes.[48] On the other hand, the uninsured often subsidize the insured because the uninsured use fewer services[49] and are often billed at a higher rate.[50] A study found that in 2009, uninsured patients presenting in U.S. emergency departments were less likely to be admitted for inpatient care than those with Medicare, Medicaid, or private insurance.[51] 60 Minutes reported, "Hospitals charge uninsured patients two, three, four or more times what an insurance company would pay for the same treatment."[52] On average, per capita health care spending on behalf of the uninsured is a bit more than half that for the insured.[53]
A study published in August 2008 in Health Affairs found that covering all of the uninsured in the US would increase national spending on health care by $122.6 billion, which would represent a 5% increase in health care spending and 0.8% of GDP. "From society’s perspective, covering the uninsured is still a good investment. Failure to act in the near term will only make it more expensive to cover the uninsured in the future, while adding to the amount of lost productivity from not insuring all Americans," said Professor Jack Hadley, the study’s lead author. The impact on government spending could be higher, depending on the details of the plan used to increase coverage and the extent to which new public coverage crowded out existing private coverage.[54]
Over 60% of personal bankruptcies is caused by medical bills. Most of these persons had medical insurance.[55]
Effects on health of the uninsured
From 2000 to 2004, the Institute of Medicine's Committee on the Consequences of Uninsurance issued a series of six reports that reviewed and reported on the evidence on the effects of the lack of health insurance coverage.[56]
The reports concluded that the committee recommended that the nation should implement a strategy to achieve universal health insurance coverage. As of 2011, a comprehensive national plan to address what universal health plan supporters terms "America's uninsured crisis", has yet to be enacted. A few states have achieved progress towards the goal of universal health insurance coverage, such as Maine, Massachusetts, and Vermont, but other states including California, have failed attempts of reforms.[57]
The six reports created by the Institute of Medicine (IOM) found that the principal consequences of uninsurance were the following: Children and Adults without health insurance did not receive needed medical care; they typically live in poorer health and die earlier than children or adults who have insurance. The financial stability of a whole family can be put at risk if only one person is uninsured and needs treatment for unexpected health care costs. The overall health status of a community can be adversely affected by a higher percentage of uninsured people within the community. The coverage gap between the insured and the uninsured has not decreased even after the recent federal initiatives to extend health insurance coverage.[57]
The last report was published in 2004 and was named Insuring America's Health: Principles and Recommendations. This report recommended the following: The President and Congress need to develop a strategy to achieve universal insurance coverage and establish a firm schedule to reach this goal by the year 2010. The committee also recommended that the federal and state governments provide sufficient resources for Medicaid and the State Children's Health Insurance Program (SCHIP) to cover all persons currently eligible until the universal coverage takes effect. They also warned that the federal and state governments should prevent the erosion of outreach efforts, eligibility, enrollment, and coverage of these specific programs.[57]
Some people think that not having health insurance will have adverse consequences for the health of the uninsured.[58] On the other hand, some people believe that children and adults without health insurance have access to needed health care services at hospital emergency rooms, community health centers, or other safety net facilities offering charity care.[59] Some observers note that there is a solid body of evidence showing that a substantial proportion of U.S. health care expenditures is directed toward care that is not effective and may sometimes even be harmful.[60] At least for the insured population, spending more and using more health care services does not always yield better health outcomes or increase life expectancy.[61]
Children in America are typically perceived as in good health relative to adults, due to the fact that most serious health problems occur later in one's life. Certain conditions including asthma, diabetes, and obesity have become much more prevalent among children in the past few decades.[57] There is also a growing population of vulnerable children with special health care needs that require ongoing medical attention, which would not be accessible without health insurance. More than 10 million children in the United States meet the federal definition of children with special health care needs "who have or are at increased risk for a chronic physical, development, behavioral, or emotional condition and who also require health and related services of a type or amount beyond that required by children generally".[62] These children require health related services of an amount beyond that required by the average children in America. Typically when children acquire health insurance, they are much less likely to experience previously unmet health care needs, this includes the average child in America and children with special health care needs.[57] The Committee on Health Insurance Status and Its Consequences concluded that the effects of health insurance on children's health outcomes: Children with health insurance receive more timely diagnosis of serious health conditions, experience fewer hospitalizations, and miss fewer days of school.
The same committee analyzed the effects of health insurance on adult's health outcomes: adults who do not have health insurance coverage who acquire Medicare coverage at age 65, experience substantially improved health and functional status, particularly those who have cardiovascular disease or diabetes. Adults who have cardiovascular disease or other cardiac risk factors that are uninsured are less likely to be aware of their condition, which leads to worse health outcomes for those individuals. Without health insurance, adults are more likely to be diagnosed with certain cancers that would have been detectable earlier by screening by a clinician if they had regularly visited a doctor. As a consequence, these adults are more likely to die from their diagnosed cancer or suffer poorer health outcomes.[57]
Many towns and cities in the United States have high concentrations of people under the age of 65 who lack health insurance.[63] There are implications of high rates of uninsurance for communities and for insured people in those communities. Institute of Medicine committee warned of the potential problems of high rates of uninsurance for local health care, including reduced access to clinic-based primary care, specialty services, and hospital-based emergency services.[64]
Emergency Medical Treatment and Active Labor Act (EMTALA)
EMTALA, enacted by the federal government in 1986, requires that hospital emergency departments treat emergency conditions of all patients regardless of their ability to pay and is considered a critical element in the "safety net" for the uninsured. However, the federal law established no direct payment mechanism for such care. Indirect payments and reimbursements through federal and state government programs have never fully compensated public and private hospitals for the full cost of care mandated by EMTALA. In fact, more than half of all emergency care in the U.S. now goes uncompensated.[65] According to some analyses, EMTALA is an unfunded mandate that has contributed to financial pressures on hospitals in the last 20 years, causing them to consolidate and close facilities, and contributing to emergency room overcrowding. According to the Institute of Medicine, between 1993 and 2003, emergency room visits in the U.S. grew by 26%, while in the same period, the number of emergency departments declined by 425.[66] Hospitals bill uninsured patients directly under the fee-for-service model, often charging much more than insurers would pay,[67] and patients may become bankrupt when hospitals file lawsuits to collect.
Mentally ill patients present a unique challenge for emergency departments and hospitals. In accordance with EMTALA, mentally ill patients who enter emergency rooms are evaluated for emergency medical conditions. Once mentally ill patients are medically stable, regional mental health agencies are contacted to evaluate them. Patients are evaluated as to whether they are a danger to themselves or others. Those meeting this criterion are admitted to a mental health facility to be further evaluated by a psychiatrist. Typically, mentally ill patients can be held for up to 72 hours, after which a court order is required.
Uninsured rates by state
.svg.png)
The United States Census Bureau regularly conducts the Current Population Survey (CPS), which includes estimates on health insurance coverage in the United States. The data is published annually in the Annual Social and Economic Supplement (ASEC). The data from 1999 to 2014 are reproduced below.[n 1] As of 2012, the five states with the highest estimated percentage of uninsured are, in order, Texas, Nevada, New Mexico, Florida, and Georgia. The five states/territories with the lowest estimated percentage of uninsured for the same year are, in order, Massachusetts, Vermont, Hawaii, Washington, D.C., and Connecticut. These rankings for each year are highlighted below.[7][68]
| Division | 1999 | 2000 | 2001 | 2002 | 2003 | 2004 | 2005 | 2006 | 2007 | 2008 | 2009 | 2010 | 2011 | 2012 | 2013 | 2014 |
|---|---|---|---|---|---|---|---|---|---|---|---|---|---|---|---|---|
| United States | 13.6 | 13.1 | 13.5 | 13.9 | 14.6 | 14.3 | 14.6 | 15.2 | 14.7 | 14.9 | 16.1 | 16.3 | 15.7 | 15.4 | 14.5 | 11.7 |
| Alabama | 12.0 | 12.5 | 12.4 | 12.2 | 12.5 | 12.0 | 14.0 | 15.1 | 11.7 | 11.5 | 16.4 | 15.5 | 13.0 | 14.8 | 13.6 | 12.1 |
| Alaska | 18.3 | 17.4 | 14.8 | 18.0 | 17.5 | 15.3 | 16.9 | 16.4 | 17.6 | 19.6 | 17.2 | 18.1 | 18.2 | 19.0 | 18.5 | 17.2 |
| Arizona | 19.4 | 16.4 | 16.7 | 16.4 | 16.4 | 16.2 | 19.1 | 20.8 | 17.8 | 19.1 | 18.9 | 19.1 | 17.3 | 18.0 | 17.1 | 13.6 |
| Arkansas | 13.9 | 14.1 | 16.4 | 16.5 | 17.2 | 15.9 | 17.2 | 18.6 | 15.7 | 17.6 | 19.0 | 18.5 | 17.5 | 18.4 | 16.0 | 11.8 |
| California | 19.0 | 17.5 | 18.0 | 16.5 | 17.3 | 17.5 | 18.0 | 17.8 | 17.5 | 18.1 | 19.3 | 19.4 | 19.7 | 17.9 | 17.2 | 12.4 |
| Colorado | 14.1 | 12.9 | 14.6 | 14.5 | 15.3 | 15.2 | 16.2 | 16.5 | 16.0 | 15.4 | 14.5 | 12.9 | 15.7 | 13.7 | 14.1 | 10.3 |
| Connecticut | 7.3 | 8.9 | 8.2 | 8.6 | 9.4 | 10.3 | 10.1 | 8.7 | 8.6 | 9.4 | 11.1 | 11.2 | 8.6 | 8.1 | 9.4 | 6.9 |
| Delaware | 9.7 | 8.5 | 8.5 | 9.2 | 9.6 | 13.1 | 11.6 | 11.9 | 10.6 | 10.7 | 13.0 | 11.3 | 10.0 | 10.8 | 9.1 | 7.8 |
| District of Columbia | 14.0 | 12.8 | 12.3 | 13.0 | 12.7 | 12.0 | 12.4 | 10.9 | 9.3 | 9.4 | 12.4 | 12.8 | 8.4 | 7.9 | 6.7 | 5.3 |
| Florida | 17.4 | 16.2 | 16.9 | 15.6 | 17.0 | 18.3 | 19.5 | 20.3 | 19.8 | 19.4 | 21.7 | 20.7 | 19.8 | 21.5 | 20.0 | 16.6 |
| Georgia | 14.2 | 13.9 | 14.7 | 14.6 | 15.2 | 15.7 | 17.9 | 17.3 | 17.2 | 17.1 | 20.5 | 19.5 | 19.2 | 19.2 | 18.8 | 15.8 |
| Hawaii | 9.2 | 7.9 | 8.2 | 8.8 | 8.6 | 8.5 | 8.1 | 7.9 | 6.9 | 7.3 | 7.4 | 7.7 | 7.8 | 7.7 | 6.7 | 5.3 |
| Idaho | 18.2 | 15.4 | 15.7 | 16.9 | 17.7 | 14.5 | 14.4 | 15.1 | 13.6 | 15.4 | 15.1 | 19.1 | 16.9 | 15.9 | 16.2 | 13.6 |
| Illinois | 11.9 | 12.0 | 11.8 | 12.4 | 13.8 | 12.5 | 13.2 | 13.5 | 13.0 | 12.2 | 14.2 | 14.8 | 14.7 | 13.6 | 12.7 | 9.7 |
| Indiana | 8.9 | 10.1 | 10.1 | 11.5 | 12.2 | 12.4 | 13.1 | 11.3 | 11.0 | 11.3 | 13.7 | 13.4 | 12.0 | 13.4 | 14.0 | 11.9 |
| Iowa | 7.8 | 8.1 | 6.8 | 9.0 | 10.4 | 8.8 | 8.1 | 9.9 | 8.8 | 9.0 | 10.8 | 12.2 | 10.0 | 10.1 | 8.1 | 6.2 |
| Kansas | 11.2 | 9.6 | 9.8 | 9.4 | 10.1 | 10.6 | 10.0 | 12.1 | 12.4 | 11.8 | 12.8 | 12.6 | 13.5 | 12.6 | 12.3 | 10.2 |
| Kentucky | 12.9 | 12.7 | 11.6 | 12.7 | 13.7 | 13.9 | 11.7 | 15.2 | 13.4 | 15.7 | 15.9 | 14.8 | 14.4 | 15.7 | 14.3 | 8.5 |
| Louisiana | 20.9 | 16.8 | 17.8 | 17.2 | 19.0 | 17.0 | 16.9 | 21.1 | 18.0 | 19.5 | 14.5 | 19.8 | 20.8 | 18.3 | 16.6 | 8.5 |
| Maine | 9.2 | 10.4 | 10.2 | 10.4 | 9.6 | 9.3 | 9.8 | 8.9 | 8.5 | 10.2 | 10.0 | 9.3 | 10.0 | 9.5 | 11.2 | 10.1 |
| Maryland | 10.0 | 9.0 | 11.0 | 11.7 | 12.2 | 11.9 | 13.1 | 13.2 | 12.7 | 11.4 | 13.3 | 12.8 | 13.8 | 12.4 | 10.2 | 7.9 |
| Massachusetts | 7.8 | 7.1 | 6.9 | 9.5 | 10.1 | 9.8 | 8.6 | 9.6 | 4.9 | 5.0 | 4.3 | 5.5 | 3.4 | 4.1 | 3.7 | 3.3 |
| Michigan | 9.0 | 7.8 | 9.0 | 9.8 | 9.3 | 10.2 | 9.5 | 10.1 | 10.8 | 11.5 | 13.0 | 13.0 | 12.5 | 10.9 | 11.0 | 8.5 |
| Minnesota | 6.6 | 8.0 | 6.9 | 7.9 | 8.7 | 8.3 | 7.6 | 8.9 | 8.0 | 8.2 | 8.0 | 9.7 | 9.2 | 8.3 | 8.2 | 5.9 |
| Mississippi | 15.7 | 13.2 | 17.0 | 16.2 | 17.5 | 16.9 | 16.5 | 20.3 | 18.4 | 17.7 | 17.3 | 21.0 | 16.2 | 15.3 | 17.1 | 14.5 |
| Missouri | 6.6 | 8.6 | 9.7 | 10.8 | 9.9 | 11.0 | 11.4 | 13.1 | 12.2 | 12.4 | 14.6 | 13.9 | 14.9 | 13.3 | 13.0 | 11.7 |
| Montana | 17.3 | 16.1 | 13.8 | 14.3 | 18.9 | 17.5 | 15.5 | 16.9 | 15.0 | 15.7 | 15.1 | 18.2 | 18.3 | 18.1 | 16.5 | 14.2 |
| Nebraska | 9.0 | 7.9 | 7.9 | 9.3 | 10.1 | 10.3 | 9.8 | 12.0 | 13.0 | 11.1 | 11.1 | 13.2 | 12.3 | 13.3 | 11.3 | 9.7 |
| Nevada | 18.3 | 15.7 | 14.5 | 18.4 | 17.6 | 18.2 | 16.5 | 18.6 | 16.9 | 18.1 | 20.6 | 21.4 | 22.6 | 23.5 | 20.7 | 15.2 |
| New Hampshire | 7.7 | 7.9 | 9.7 | 8.8 | 9.3 | 8.7 | 9.1 | 10.8 | 9.9 | 10.1 | 9.8 | 10.1 | 12.5 | 12.0 | 10.7 | 9.2 |
| New Jersey | 11.1 | 10.2 | 11.6 | 12.0 | 12.8 | 12.6 | 13.7 | 14.8 | 14.6 | 13.2 | 14.5 | 15.6 | 15.4 | 14.0 | 13.2 | 10.9 |
| New Mexico | 24.0 | 23.0 | 19.6 | 20.0 | 21.3 | 19.3 | 20.2 | 22.7 | 21.8 | 22.8 | 20.9 | 21.4 | 19.6 | 21.9 | 18.6 | 14.5 |
| New York | 14.4 | 14.5 | 13.9 | 14.0 | 14.3 | 11.8 | 12.1 | 13.4 | 12.3 | 13.4 | 14.1 | 15.1 | 12.2 | 11.3 | 10.7 | 8.7 |
| North Carolina | 12.5 | 12.1 | 13.3 | 15.9 | 16.7 | 14.2 | 14.5 | 17.4 | 16.2 | 15.1 | 17.8 | 17.1 | 16.3 | 17.2 | 15.6 | 13.1 |
| North Dakota | 10.2 | 9.8 | 8.0 | 9.7 | 10.3 | 10.0 | 10.8 | 11.8 | 9.5 | 11.6 | 10.3 | 13.4 | 9.1 | 11.5 | 10.4 | 7.9 |
| Ohio | 9.9 | 9.8 | 9.9 | 10.4 | 11.1 | 10.3 | 11.0 | 9.6 | 11.1 | 11.2 | 13.8 | 13.6 | 13.7 | 12.3 | 11.0 | 8.4 |
| Oklahoma | 15.4 | 17.4 | 17.2 | 16.7 | 19.1 | 18.7 | 17.7 | 18.8 | 17.6 | 13.8 | 17.9 | 17.3 | 16.9 | 17.2 | 17.7 | 15.4 |
| Oregon | 14.2 | 11.6 | 12.7 | 14.3 | 16.0 | 15.4 | 15.3 | 17.5 | 16.2 | 15.9 | 17.3 | 16.0 | 13.8 | 15.4 | 14.7 | 9.7 |
| Pennsylvania | 7.8 | 7.6 | 8.4 | 10.2 | 10.0 | 10.1 | 9.3 | 9.4 | 9.1 | 9.6 | 10.9 | 10.9 | 10.8 | 12.0 | 9.7 | 8.5 |
| Rhode Island | 5.9 | 6.9 | 7.7 | 8.1 | 10.4 | 10.0 | 10.7 | 8.1 | 10.5 | 11.0 | 12.0 | 11.5 | 12.0 | 12.3 | 11.6 | 7.4 |
| South Carolina | 14.8 | 10.7 | 11.1 | 11.1 | 13.1 | 14.9 | 16.3 | 15.3 | 15.9 | 15.5 | 16.8 | 20.5 | 19.0 | 14.3 | 15.8 | 13.6 |
| South Dakota | 10.1 | 10.8 | 8.3 | 10.8 | 10.6 | 11.0 | 11.5 | 11.5 | 9.9 | 12.2 | 13.1 | 13.1 | 13.0 | 14.4 | 11.3 | 9.8 |
| Tennessee | 9.3 | 10.7 | 10.1 | 9.8 | 12.2 | 12.4 | 13.4 | 13.2 | 14.0 | 14.5 | 15.0 | 14.6 | 13.3 | 13.9 | 13.9 | 12.0 |
| Texas | 21.1 | 22.0 | 22.4 | 24.5 | 23.6 | 23.6 | 22.9 | 23.9 | 24.7 | 24.5 | 25.5 | 24.6 | 23.8 | 24.6 | 22.1 | 19.1 |
| Utah | 11.9 | 10.8 | 13.8 | 12.1 | 11.5 | 12.8 | 15.5 | 16.7 | 12.2 | 12.0 | 14.1 | 13.8 | 14.6 | 14.4 | 14.0 | 12.5 |
| Vermont | 10.1 | 7.4 | 8.8 | 8.9 | 8.4 | 9.8 | 11.2 | 9.8 | 10.1 | 9.3 | 9.4 | 9.3 | 8.6 | 7.0 | 7.2 | 5.0 |
| Virginia | 11.3 | 9.6 | 9.8 | 11.8 | 11.5 | 13.0 | 12.3 | 12.5 | 14.2 | 11.8 | 12.6 | 14.0 | 13.4 | 12.5 | 12.3 | 10.9 |
| Washington | 12.2 | 13.1 | 13.3 | 12.3 | 14.8 | 12.5 | 12.5 | 11.5 | 11.0 | 12.0 | 12.6 | 13.9 | 14.5 | 13.6 | 14.0 | 9.2 |
| West Virginia | 14.9 | 13.4 | 12.9 | 13.8 | 16.8 | 15.7 | 16.5 | 13.3 | 13.7 | 14.5 | 13.7 | 13.4 | 14.9 | 14.6 | 14.0 | 8.6 |
| Wisconsin | 9.7 | 7.1 | 7.3 | 8.6 | 9.8 | 10.3 | 8.8 | 8.0 | 8.0 | 9.2 | 8.9 | 9.4 | 10.4 | 9.7 | 9.1 | 7.3 |
| Wyoming | 14.5 | 14.7 | 14.1 | 14.8 | 14.8 | 12.3 | 14.4 | 14.2 | 13.2 | 13.3 | 15.4 | 17.2 | 17.8 | 15.4 | 13.4 | 12.0 |
Assisting programs for uninsured
People without health insurance in the United States may receive benefits from patient-assistance programs such as Partnership for Prescription Assistance.[69] Uninsured patients can also use a medical bill negotiation service, which can audit the medical bill for overcharges and errors.
See also
Notes
- ↑ The Census Bureau's algorithm was revised in 2000 and again in 2005. The data for 2004 was revised after its initial publishing. See the Health Insurance Historical Tables for more information.
References
- 1 2 3 4 5 "Federal Subsidies for Health Insurance Coverage for People Under Age 65". CBO. March 24, 2016.
- ↑ Bureau, US Census. "Health Insurance Coverage in the United States: 2015". www.census.gov.
- ↑ Bureau, US Census. "Health Insurance Coverage in the United States: 2016". www.census.gov. Retrieved 2017-10-11.
- ↑ Fisher, Max. "Here's a Map of the Countries That Provide Universal Health Care (America's Still Not on It)".
- 1 2 "The U.S. Health Care System: An International Perspective". DPEAFLCIO.
- 1 2 ""There will be deaths": Atul Gawande on the GOP plan to replace Obamacare".
- 1 2 "Health Insurance Historical Tables (HIB-4. Health Insurance Coverage Status and Type of Coverage by State--All Persons: 1999 to 2012)." United States Census Bureau.
- 1 2 Bureau, US Census. "Health Insurance Historical Tables-HIC Series". Census.
- ↑ Commonwealth Fund-First Look at Health Insurance Coverage in 2018 Finds ACA Gains Beginning to Reverse-May 1, 2018
- 1 2 "Key Facts about the Uninsured Population". Kaiser Family Foundation. September 29, 2016.
- ↑ Bureau, US Census. "Health Insurance Coverage in the United States: 2015". www.census.gov.
- ↑ CBO-Federal Subsidies for Health Insurance Coverage for People Under Age 65: 2018 to 2028-May 23, 2018
- ↑ Inc., Gallup,. "In U.S., Uninsured Rate Sinks to 13.4% in Second Quarter".
- ↑ "New Survey: After First ACA Enrollment Period, Uninsured Rate Dropped from 20 Percent to 15 Percent; Largest Declines Among Young Adults, Latinos, and Low-Income People".
- ↑ Bureau, US Census. "Health Insurance Coverage in the United States: 2016". www.census.gov.
- ↑ Commonwealth Fund-First Look at Health Insurance Coverage in 2018 Finds ACA Gains Beginning to Reverse-May 1, 2018
- ↑ "Estimates of Eligibility for ACA Coverage among the Uninsured in 2016". October 25, 2017.
- ↑ "Estimates of Eligibility for ACA Coverage among the Uninsured in 2016". October 25, 2017.
- ↑ "Income, Poverty, and Health Insurance Coverage in the United States: 2007." U.S. Census Bureau. Issued August 2008.
- ↑ (Becker 2007 The uninsured and the politics of containment in U.S. health care. Medical Anthropology 26(4): 299-321.).
- ↑ "Health Insurance Coverage of the Total Population".
- ↑ Dubay L, Holahan J and Cook A.,The Uninsured and the Affordability of Health Insurance Coverage Archived January 17, 2013, at the Wayback Machine., Health Affairs (Web Exclusive), November 2006. Retrieved February 4, 2007.
- ↑ Marcus, Aliza (May 7, 2008). "Baby Kendra's $300,000 Bill Pains Insurers, Inspires Candidates". Bloomberg News. Retrieved May 10, 2008.
- ↑ Norvax Online Health Insurance Shoppers Identifying The Consumers Going Online To Purchase Individual Health Insurance, October 2008
- ↑ https://www.census.gov/newsroom/release/archives/income_wealth/cb11-157.html
- ↑ Jennifer L. Kriss, Sara R. Collins., Bisundev Mahato, Elise Gould, and Cathy Schoen, "Rite of Passage? Why Young Adults Become Uninsured and How New Policies Can Help, 2008 Update", The Commonwealth Fund, May 2008 (abstract and chartpack)
- ↑ Karyn Schwartz and Tanya Schwartz, "Uninsured Young Adults: A Profile and Overview of Coverage Options", The Kaiser Family Foundation, June 2008
- ↑ IBP, Inc. (2013). US Healthcare Sector - Organization, Management and Payment Systems Handbook Volume 1 Strategic Information, Developments, Reforms. Washington, D.C.: Lulu.com. p. 18. ISBN 9781433086045.
- ↑ Paul Fronstin, "The Impact of Immigration on Health Insurance Coverage in the United States, 1994–2006," EBRI Notes, Vol. 29, No. 8, Employee Benefit Research Institute, August 2008
- ↑ Stan Dorn, Bowen Garrett, John Holahan, and Aimee Williams, "Medicaid, SCHIP and Economic Downturn: Policy Challenges and Policy Responses," Kaiser Family Foundation, April 2008
- ↑ "Estimates of Eligibility for ACA Coverage among the Uninsured in 2016". October 25, 2017.
- ↑ "What Is a Health Care Sharing Ministry?" Archived April 14, 2015, at the Wayback Machine. 2008
- ↑ "Employer Health Benefits and Insurance Expansions: Hawaii's Experience".
- ↑ "Wayback Machine" (PDF). April 9, 2008. Archived from the original (PDF) on April 9, 2008.
- ↑ Mark V. Pauly and Robert D. Lieberthal, "How Risky Is Individual Health Insurance?," Health Affairs web exclusive, May 6, 2008
- ↑ John Holahan, Allison Cook, and Lisa Dubay, "Characteristics of the Uninsured: Who is Eligible for Public Coverage and Who Needs Help Affording Coverage?," Kaiser Family Foundation, February 2007
- 1 2 "UNDERSTANDING THE UNINSURED: TAILORING POLICY SOLUTIONS FOR DIFFERENT SUBPOPULATIONS," Issue Brief, NIHCM Foundation, April 2008
- 1 2 3 4 Low-Income Adults Under Age 65 — Many are Poor, Sick, and Uninsured, Policy Brief, Kaiser Family Foundation, Publication #7914, June 2009
- 1 2 3 "There's death and then there's death : Two GeoFRED maps of premature death rates- FRED Blog". fredblog.stlouisfed.org.
- ↑ "Obama's claim the Affordable Care Act was a 'major reason' in preventing 50,000 patient deaths". Washington Post. Retrieved November 10, 2016.
- ↑ "Repealing the Affordable Care Act will kill more than 43,000 people annually". Washington Post. Retrieved 2017-01-23.
- 1 2 "The Coverage Gap: Uninsured Poor Adults in States that Do Not Expand Medicaid". November 1, 2017.
- ↑ "The Effects of Medicaid Expansion under the ACA: Updated Findings from a Literature Review". March 28, 2018.
- ↑ Wilper, A. P.; Woolhandler, S.; Lasser, K. E.; McCormick, D.; Bor, D. H.; Himmelstein, D. U. (2009). "Health Insurance and Mortality in US Adults" (PDF). American Journal of Public Health. 99 (12): 2289–2295. doi:10.2105/AJPH.2008.157685. PMC 2775760. PMID 19762659.
- ↑ David Cecere, "New study finds 45,000 deaths annually linked to lack of health coverage", Cambridge Health Alliance, posted on the Harvard Science website, September 17, 2009
- ↑ Woolhandler, S.; et al. (September 12, 2012). "Despite slight drop in uninsured, last year's figure points to 48,000 preventable deaths". Physicians for a National Health Program. Retrieved September 26, 2012.
- ↑ Uninsured vs. Insured Lack of health care coverage most acute among African-Americans and Hispanics, and is more prevalent among women than men - Deloitte LLP
- ↑ Groman, MPH, Rachel (2004). "The Cost of Lack of Health Insurance" (PDF). American College of Physicians. Retrieved 22 October 2017.
- ↑ Uninsurance, Institute of Medicine (US) Committee on the Consequences of (2003). Spending on Health Care for Uninsured Americans: How Much, and Who Pays?. National Academies Press (US).
- ↑ "Uninsured billed unfairly". USA Today. July 1, 2004. Retrieved May 26, 2010.
- ↑ Kindermann D, Mutter R, Pines JM. Emergency Department Transfers to Acute Care Facilities, 2009. HCUP Statistical Brief #155. Agency for Healthcare Research and Quality. May 2013.
- ↑ "Hospitals: Is the Price Right?". CBS News. March 2, 2006.
- ↑ Catherine Hoffman, Karyn Schwartz, Jennifer Tolbert, Allison Cook and Aimee Williams, "The Uninsured: A Primer" Archived June 2, 2008, at the Wayback Machine., Kaiser Family Foundation, October 2007;
Catherine Hoffman, Karyn Schwartz, Jennifer Tolbert, Allison Cook and Aimee Williams, "The Uninsured: A Primer" Archived March 19, 2009, at the Wayback Machine., Kaiser Family Foundation, October 2008 (Supplemental data tables Archived August 24, 2009, at the Wayback Machine.) - ↑ Jack Hadley, John Holahan, Teresa Coughlin, and Dawn Miller, "Covering The Uninsured In 2008: Current Costs, Sources Of Payment, And Incremental Costs," Health Affairs web exclusive, August 25, 2008
- ↑ "Medical bills prompt more than 60 percent of U.S. bankruptcies". CNN. June 5, 2009.
- ↑ Institute of Medicine. Committee on the Consequences of Uninsurance (January 13, 2004). Insuring America's health: principles and recommendations. Washington, DC: National Academies Press. p. 25. ISBN 978-0-309-52826-9. Archived from the original on October 19, 2009.
- 1 2 3 4 5 6 Committee on Health Insurance Status and Its Consequences (Author). America's Uninsured Crisis : Consequences for Health and Health Care. Washington, DC, USA: National Academies Press, 2009
- ↑ Fisher E. S.; Wennberg D. E.; Stukel T. A.; Gottlieb D. J.; Lucas F. L.; Pinder E. L. (2003). "The implications of regional variations in Medicare spending. Part 1: The content, quality, and accessibility of care". Annals of Internal Medicine. 138 (4): 273–287. doi:10.7326/0003-4819-138-4-200302180-00006. PMID 12585825.
- ↑ Fuchs, V. R. 2004. Perspective: More variation in use of case, more flat-of-the-curve medicine. Health Affairs 104.
- ↑ Wennberg, D. E., and J. E. Wennberg. 2003. Perspective: Addressing variations: Is there hope for the future? Health Affairs w3.614-w3.617
- ↑ Wennberg, J. E., and E. S. Fisher, and S. M. Sharp. 2006. The care of patients with severe chronic illness. Lebanon, NH: The Dartmouth Atlas of Health Care.
- ↑ American Academy of Pediatrics. 2008. Definition of children with special health care needs (CSHCN), http://www.medicalhomeinfo.org/about/def_cshcn.html (accessed December 4, 2011).
- ↑ DeNavas-Walt, C., B. D. Proctor, and J. Smith. 2008. Income, poverty, and health insurance coverage in the United States: 2007. Washington, DC. U.S Census Bureau.
- ↑ Institute of Medicine. Committee on the Consequences of Uninsurance (March 3, 2003). A shared destiny: community effects of uninsurance. Washington, DC: National Academies Press. ISBN 978-0-309-08726-1.
- ↑ The Uninsured: Access to Medical Care Archived March 4, 2010, at the Wayback Machine., American College of Emergency Physicians. Retrieved October 30, 2007.
- ↑ Fact Sheet: The Future of Emergency Care: Key Findings and Recommendations, Institute of Medicine, 2006. Retrieved October 7, 2007.
- ↑ "Uninsured billed unfairly". USA Today. July 1, 2004. Retrieved May 4, 2010.
- ↑ Health Insurance Historical Tables (HIC-4. Health Insurance Coverage Status and Type of Coverage by State--All Persons: 2013 to 2014)." United States Census Bureau.
- ↑ How Can I Help Patients Get Their Medications? By Laura S. Lehman. Medscape Pharmacists July 20, 2011
External links
- America's Uninsured Crisis: Consequences for Health and Health Care Institute of Medicine, National Academy of Sciences, 2009.
- FamiliesUSA contains links to numerous studies and literature about health care-related issues such as the uninsured.
- SHADAC Data Center is a web-based tool that allows users to create customized tables and graphs showing health insurance coverage estimates using U.S. Census surveys between 1987-2009.
- Paul Fronstin, "Sources of Health Insurance and Characteristics of the Uninsured: Analysis of the March 2012 Current Population Survey." EBRI Issue Brief #376, September 2012, Employee Benefit Research Institute.