GC-content
In molecular biology and genetics, GC-content (or guanine-cytosine content) is the percentage of nitrogenous bases on a DNA or RNA molecule that are either guanine or cytosine (from a possibility of four different ones, also including adenine and thymine in DNA and adenine and uracil in RNA).[1] This may refer to a certain fragment of DNA or RNA, or that of the whole genome. When it refers to a fragment of the genetic material, it may denote the GC-content of section of a gene (domain), single gene, group of genes (or gene clusters), or even a non-coding region.
Structure
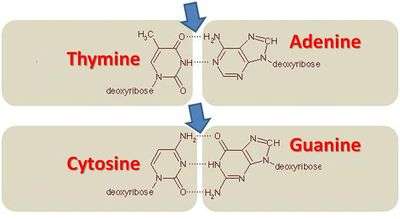
Qualitativelty, G (guanine) and C (cytosine) undergo a specific hydrogen bonding, whereas A (adenine) bonds specifically with T (thymine, in DNA) or U (uracil, in RNA). Quantitativelty, the GC pair is bound by three hydrogen bonds, while AT and AU pairs are bound by two hydrogen bonds. To emphasize this difference in the number of hydrogen bonds, the base pairings can be represented as respectively G≡C versus A=T and A=U. DNA with low GC-content is less stable than DNA with high GC-content; however, the hydrogen bonds themselves do not have a particularly significant impact on stabilization, the stabilization is due mainly to interactions of base stacking.[2] In spite of the higher thermostability conferred to the genetic material, it has been observed that at least some bacteria species with DNA of high GC-content undergo autolysis more readily, thereby reducing the longevity of the cell per se.[3] Due to the thermostability given to the genetic materials in high GC organisms, it was commonly believed that the GC content played a necessary role in adaptation temperatures, a hypothesis that was refuted in 2001.[4] However, it has been shown that there is a strong correlation between the prokaryotic optimal growth at higher temperatures and the GC content of structured RNAs (such as ribosomal RNA, transfer RNA, and many other non-coding RNAs).[4][5] The AU base pairs are less stable than the GC base pairs previously attributed to GC bonds containing 3 hydrogen bonds and AU having only 2 hydrogen bonds, making high-GC-content RNA structures more resistant to the effects of high temperatures. More recently, it has been proved that the most stabilizing factor of thermal stability of double stranded nucleic acids is actually due to the base stackings of adjacent bases, rather than the number of hydrogen bonds between the bases.There is more favorable stacking energy for G:C pairs because of the relative positions of exocyclic groups than in the A:U pairs. Additionally, there is a correlation between the order in which the bases stack and thermal stability.[6]
Determination
GC content is usually expressed as a percentage value, but sometimes as a ratio (called G+C ratio or GC-ratio). GC-content percentage is calculated as[7]

whereas the AT/GC ratio is calculated as[8]
- .

The GC-content percentages as well as GC-ratio can be measured by several means, but one of the simplest methods is to measure what is called the melting temperature of the DNA double helix using spectrophotometry. The absorbance of DNA at a wavelength of 260 nm increases fairly sharply when the double-stranded DNA separates into two single strands when sufficiently heated.[9] The most commonly used protocol for determining GC ratios uses flow cytometry for large number of samples.[10]
In alternative manner, if the DNA or RNA molecule under investigation has been sequenced then the GC-content can be accurately calculated by simple arithmetic or by using the free online GC calculator.
Genomic content
Within-genome variation
The GC ratio within a genome is found to be markedly variable. These variations in GC ratio within the genomes of more complex organisms result in a mosaic-like formation with islet regions called isochores.[11] This results in the variations in staining intensity in the chromosomes.[12] GC-rich isochores include in them many protein coding genes, and thus determination of ratio of these specific regions contributes in mapping gene-rich regions of the genome.[13][14]
Coding sequences
Within a long region of genomic sequence, genes are often characterised by having a higher GC-content in contrast to the background GC-content for the entire genome. Evidence of GC ratio with that of length of the coding region of a gene has shown that the length of the coding sequence is directly proportional to higher G+C content.[15] This has been pointed to the fact that the stop codon has a bias towards A and T nucleotides, and, thus, the shorter the sequence the higher the AT bias.[16]
Comparison of more than 1,000 orthologous genes in mammals showed marked within-genome variations of the third-codon position GC content, with a range from less than 30% to more than 80%.[17]
Among-genome variation
GC content is found to be variable with different organisms, the process of which is envisaged to be contributed to by variation in selection, mutational bias, and biased recombination-associated DNA repair.[18]
The average GC-content in human genomes ranges from 35% to 60% across 100-Kb fragments, with a mean of 46.1%.[17] The GC-content of Yeast (Saccharomyces cerevisiae) is 38%,[19] and that of another common model organism, thale cress (Arabidopsis thaliana), is 36%.[20] Because of the nature of the genetic code, it is virtually impossible for an organism to have a genome with a GC-content approaching either 0% or 100%. However, a species with an extremely low GC-content is Plasmodium falciparum (GC% = ~20%),[21] and it is usually common to refer to such examples as being AT-rich instead of GC-poor.[22]
Several mammalian species (e.g., shrew, microbat, tenrec, rabbit) have independently undergone a marked increase in the GC-content of their genes. These GC-content changes are correlated with species life-history traits (e.g., body mass or longevity) and genome size,[17] and might be linked to a molecular phenomenon called the GC-biased gene conversion.[23]
Applications
Molecular biology
In polymerase chain reaction (PCR) experiments, the GC-content of primers are used to predict their annealing temperature to the template DNA. A higher GC-content level indicates a relatively higher melting temperature.
Systematics
The species problem in prokaryotic taxonomy has led to various suggestions in classifying bacteria, and the ad hoc committee on reconciliation of approaches to bacterial systematics has recommended use of GC ratios in higher level hierarchical classification.[24] For example, the Actinobacteria are characterised as "high GC-content bacteria".[25] In Streptomyces coelicolor A3(2), GC content is 72%.[26]
Software tools
GCSpeciesSorter [27] and TopSort [28] are software tools for classifying species based on their GC contents.
See also
References
- ↑ Definition of GC – content on CancerWeb of Newcastle University,UK
- ↑ Yakovchuk P, Protozanova E, Frank-Kamenetskii MD (2006). "Base-stacking and base-pairing contributions into thermal stability of the DNA double helix". Nucleic Acids Res. 34 (2): 564–74. doi:10.1093/nar/gkj454. PMC 1360284. PMID 16449200.
- ↑ Levin RE, Van Sickle C (1976). "Autolysis of high-GC isolates of Pseudomonas putrefaciens". Antonie van Leeuwenhoek. 42 (1–2): 145–55. doi:10.1007/BF00399459. PMID 7999.
- 1 2 Hurst LD, Merchant AR (March 2001). "High guanine-cytosine content is not an adaptation to high temperature: a comparative analysis amongst prokaryotes". Proc. Biol. Sci. 268 (1466): 493–7. doi:10.1098/rspb.2000.1397. PMC 1088632. PMID 11296861.
- ↑ Galtier, N.; Lobry, J.R. (1997). "Relationships between genomic G+C content, RNA secondary structures, and optimal growth temperature in Prokaryotes". Journal of Molecular Evolution. 44 (6): 632–636. doi:10.1007/PL00006186. PMID 9169555.
- ↑ Yakovchuk, Peter; Protozanova, Ekaterina; Frank-Kamenetskii, Maxim D. (2006). "Base-stacking and base-pairing contributions into thermal stability of the DNA double helix". Nucleic Acids Research. 34 (2): 564–574. doi:10.1093/nar/gkj454. ISSN 0305-1048. PMC 1360284. PMID 16449200.
- ↑ Madigan,MT. and Martinko JM. (2003). Brock biology of microorganisms (10th ed.). Pearson-Prentice Hall. ISBN 978-84-205-3679-8.
- ↑ Definition of GC-ratio on Northwestern University, IL, USA
- ↑ Wilhelm J, Pingoud A, Hahn M (May 2003). "Real-time PCR-based method for the estimation of genome sizes". Nucleic Acids Res. 31 (10): e56. doi:10.1093/nar/gng056. PMC 156059. PMID 12736322.
- ↑ Vinogradov AE (May 1994). "Measurement by flow cytometry of genomic AT/GC ratio and genome size". Cytometry. 16 (1): 34–40. doi:10.1002/cyto.990160106. PMID 7518377.
- ↑ Bernardi G (January 2000). "Isochores and the evolutionary genomics of vertebrates". Gene. 241 (1): 3–17. doi:10.1016/S0378-1119(99)00485-0. PMID 10607893.
- ↑ Furey TS, Haussler D (May 2003). "Integration of the cytogenetic map with the draft human genome sequence". Hum. Mol. Genet. 12 (9): 1037–44. doi:10.1093/hmg/ddg113. PMID 12700172.
- ↑ Sumner AT, de la Torre J, Stuppia L (August 1993). "The distribution of genes on chromosomes: a cytological approach". J. Mol. Evol. 37 (2): 117–22. doi:10.1007/BF02407346. PMID 8411200.
- ↑ Aïssani B, Bernardi G (October 1991). "CpG islands, genes and isochores in the genomes of vertebrates". Gene. 106 (2): 185–95. doi:10.1016/0378-1119(91)90198-K. PMID 1937049.
- ↑ Pozzoli U, Menozzi G, Fumagalli M, et al. (2008). "Both selective and neutral processes drive GC content evolution in the human genome". BMC Evol. Biol. 8: 99. doi:10.1186/1471-2148-8-99. PMC 2292697. PMID 18371205.
- ↑ Wuitschick JD, Karrer KM (1999). "Analysis of genomic G + C content, codon usage, initiator codon context and translation termination sites in Tetrahymena thermophila". J. Eukaryot. Microbiol. 46 (3): 239–47. doi:10.1111/j.1550-7408.1999.tb05120.x. PMID 10377985.
- 1 2 3 Romiguier, Jonathan; Ranwez, Vincent; Douzery, Emmanuel J. P.; Galtier, Nicolas (2010-08-01). "Contrasting GC-content dynamics across 33 mammalian genomes: Relationship with life-history traits and chromosome sizes". Genome Research. 20 (8): 1001–1009. doi:10.1101/gr.104372.109. ISSN 1088-9051. PMC 2909565. PMID 20530252.
- ↑ Birdsell JA (1 July 2002). "Integrating genomics, bioinformatics, and classical genetics to study the effects of recombination on genome evolution". Mol. Biol. Evol. 19 (7): 1181–97. CiteSeerX 10.1.1.337.1535. doi:10.1093/oxfordjournals.molbev.a004176. PMID 12082137.
- ↑ Whole genome data of Saccharomyces cerevisiae on NCBI
- ↑ Whole genome data of Arabidopsis thaliana on NCBI
- ↑ Whole genome data of Plasmodium falciparum on NCBI
- ↑ Musto H, Cacciò S, Rodríguez-Maseda H, Bernardi G (1997). "Compositional constraints in the extremely GC-poor genome of Plasmodium falciparum" (PDF). Mem. Inst. Oswaldo Cruz. 92 (6): 835–41. doi:10.1590/S0074-02761997000600020. PMID 9566216.
- ↑ Duret L, Galtier N (2009). "Biased gene conversion and the evolution of mammalian genomic landscapes". Annu Rev Genom Hum Genet. 10: 285–311. doi:10.1146/annurev-genom-082908-150001. PMID 19630562.
- ↑ Wayne LG; et al. (1987). "Report of the ad hoc committee on reconciliation of approaches to bacterial systematic". International Journal of Systematic Bacteriology. 37 (4): 463–4. doi:10.1099/00207713-37-4-463.
- ↑ Taxonomy browser on NCBI
- ↑ Whole genome data of Streptomyces coelicolor A3(2) on NCBI
- ↑ Karimi K, Wuitchik D, Oldach M, Vize P (2018). "Distinguishing Species Using GC Contents in Mixed DNA or RNA Sequences". Evol Bioinform Online. 14 (January 1, 2018): 1176934318788866. doi:10.1177/1176934318788866. PMC 6052495. PMID 30038485.
- ↑ Lehnert E, Mouchka M, Burriesci M, Gallo N, Schwarz J, Pringle J (2014). "Extensive differences in gene expression between symbiotic and aposymbiotic cnidarians". G3 (Bethesda). 4 (2): 277–95. doi:10.1534/g3.113.009084. PMC 3931562. PMID 24368779.