Flow cytometry
Flow cytometry is a technique used to detect and measure physical and chemical characteristics of a population of cells or particles.[1][2][3][4] A sample containing cells or particles are suspended in a fluid and injected into the flow cytometer instrument. The sample is focused to ideally flow one cell at a time through a laser beam and the light scattered is characteristic to the cells and their components. Cells are often labeled with fluorescent markers so that light is first absorbed and then emitted in a band of wavelengths. Tens of thousands of cells can be quickly examined and the data gathered are processed by a computer.
Flow cytometry is routinely used in basic research, clinical practice, and clinical trials. Uses for flow cytometry include:
- Cell counting
- Cell sorting
- Determining cell characteristics and function
- Detecting microorganisms
- Biomarker detection
- Protein engineering detection
- Diagnosis of health disorders such as blood cancers
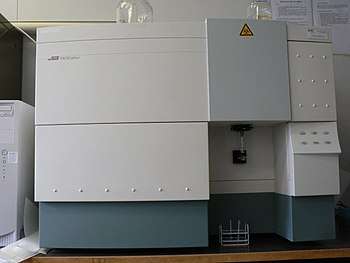
A flow cytometry analyzer is an instrument that provides quantifiable data from a sample. Other instruments using flow cytometry include cell sorters which physically separate and thereby purify cells of interest based on their optical properties.
History
The first impedance-based flow cytometry device, using the Coulter principle, was disclosed in U.S. Patent 2,656,508, issued in 1953, to Wallace H. Coulter. Mack Fulwyler was the inventor of the forerunner to today's flow cytometers - particularly the cell sorter.[5] Fulwyler developed this in 1965 with his publication in Science.[6] The first fluorescence-based flow cytometry device (ICP 11) was developed in 1968 by Wolfgang Göhde from the University of Münster, filed for patent on 18 December 1968[7] and first commercialized in 1968/69 by German developer and manufacturer Partec through Phywe AG in Göttingen. At that time, absorption methods were still widely favored by other scientists over fluorescence methods.[8] Soon after, flow cytometry instruments were developed, including the Cytofluorograph (1971) from Bio/Physics Systems Inc. (later: Ortho Diagnostics), the PAS 8000 (1973) from Partec, the first FACS (fluorescence-activated cell sorting) instrument from Becton Dickinson (1974), the ICP 22 (1975) from Partec/Phywe and the Epics from Coulter (1977/78). The first label-free high-frequency impedance flow cytometer based on a patented microfluidic "lab-on-chip", Ampha Z30, was introduced by Amphasys (2012).
Name of the technology
The original name of the fluorescence-based flow cytometry technology was "pulse cytophotometry" (German: Impulszytophotometrie), based on the first patent application on fluorescence-based flow cytometry. At the 5th American Engineering Foundation Conference on Automated Cytology in Pensacola (Florida) in 1976 - eight years after the introduction of the first fluorescence-based flow cytometer (1968) - it was agreed to commonly use the name "flow cytometry", a term that quickly became popular.[9]
Flow cytometers
Modern flow cytometers are able to analyze many thousand particles per second, in "real time," and, if configured as cell sorters, can actively separate and isolate particles with specified optical properties at similar rates. A flow cytometer is similar to a microscope, except that, instead of producing an image of the cell, flow cytometry offers high-throughput, automated quantification of specified optical parameters on a cell-by-cell basis. To analyze solid tissues, a single-cell suspension must first be prepared.
A flow cytometer has five main components: a flow cell, a measuring system, a detector, an amplification system, and a computer for analysis of the signals. The flow cell has a liquid stream (sheath fluid), which carries and aligns the cells so that they pass single file through the light beam for sensing. The measuring system commonly use measurement of impedance (or conductivity) and optical systems - lamps (mercury, xenon); high-power water-cooled lasers (argon, krypton, dye laser); low-power air-cooled lasers (argon (488 nm), red-HeNe (633 nm), green-HeNe, HeCd (UV)); diode lasers (blue, green, red, violet) resulting in light signals. The detector and analog-to-digital conversion (ADC) system converts analog measurements of forward-scattered light (FSC) and side-scattered light (SSC) as well as dye-specific fluorescence signals into digital signals that can be processed by a computer. The amplification system can be linear or logarithmic.
The process of collecting data from samples using the flow cytometer is termed 'acquisition'. Acquisition is mediated by a computer physically connected to the flow cytometer, and the software which handles the digital interface with the cytometer. The software is capable of adjusting parameters (e.g., voltage, compensation) for the sample being tested, and also assists in displaying initial sample information while acquiring sample data to ensure that parameters are set correctly. Early flow cytometers were, in general, experimental devices, but technological advances have enabled widespread applications for use in a variety of both clinical and research purposes. Due to these developments, a considerable market for instrumentation, analysis software, as well as the reagents used in acquisition such as fluorescently labeled antibodies has developed.
Modern instruments usually have multiple lasers and fluorescence detectors. The current record for a commercial instrument is ten lasers[10] and 30 fluorescence detectors.[11] Increasing the number of lasers and detectors allows for multiple antibody labeling, and can more precisely identify a target population by their phenotypic markers. Certain instruments can even take digital images of individual cells, allowing for the analysis of fluorescent signal location within or on the surface of cells.
Hardware
Fluidics system of a flow cytometer
Cells must pass uniformly through the center of focused laser beams to accurately measure optical properties of cells in any flow cytometer.[12][13][14] The purpose of the fluidic system is to move the cells one by one through the lasers beam and through-out the instrument. Fluidics in a flow cytometer with cell sorting capabilities also use the stream to carry sorted cells into collection tubes or wells.[12]
Hydrodynamic focusing
For precise positioning of cells in a liquid jet the hydrodynamic focusing technique is used in most cytometers.[12][13][14] The cells in suspension enter into the instrument enclosed by an outer sheath fluid. The sample core is maintained in the center of the sheath fluid. The sample input rate or how fast the cells flow through to the laser interrogation can be controlled by the pressure of the sheath fluid on the sample core. Under optimal conditions there is no mixing of the central fluid stream and the sheath fluid.
Acoustic-assisted hydrodynamic focusing
Acoustic focusing technology is used in some flow cytometers to support hydrodynamic focusing.[12][14] Acoustic waves (>2MHz) pre-focus the sample before introduction to sheath fluid. The pre-focused sample is then injected into the hydrodynamic core and flowed through the instrument. This may help with increasing data accuracy under high sample input rates.
Optics and electronics
Optical filters
Light emitted from fluorophores are in a spectrum of wavelengths and combining multiple fluorophores may cause overlap. To add specificity, optical filters and dichroic mirrors are used filter and move light to the detectors such as photomultiplier tubes (PMTs) or avalanche photodiodes (APD).[12] Optical filters are designed as band pass (BP), long pass (LP), or short pass (SP) filters. Most flow cytometers uses dichroic mirrors and band pass filters to select specific bands of the optical spectrum.
Prisms, gratings, and spectral flow cytometry
Spectral flow cytometry uses prisms or gratings to disperse the emitted light of a marker across a detector array.[12][15] This allows for the full spectra from each particle to be measured. The measured spectra from single cells are subsequently unmixed by using reference spectra of all used dyes and the autofluorescence spectrum. This may allow for a wider panel design and the application of new biological markers.
Imaging flow cytometry
Imaging flow cytometry (IFC) captures multichannel images of cells.[12][16] Detectors used in imaging platforms can be equipped with charge-coupled device (CCD) or complementary metal-oxide-semiconductor (CMOS) to capture images of individual cells.
Data analysis
Compensation
Each fluorochrome has a broad fluorescence spectrum. When more than one fluorochrome is used, the overlap between fluorochromes can occur. This situation is called spectrum overlap. This situation needs to be overcome. For example, the emission spectrum for FITC and PE is that the light emitted by the fluorescein overlaps the same wave length as it passes through the filter used for PE. This spectral overlap is corrected by removing a portion of the FITC signal from the PE signals or vice versa. This process is called color compensation, which calculates a fluorochrome as a percentage to measure itself.[17]
''Compensation is the mathematical process by which we correct multiparameter flow cytometric data for spectral overlap. This overlap, or “spillover,” results from the use of fluorescent dyes that are measurable in more than one detector; this spillover is correlated by a constant known as the spillover coefficient. The process of compensation is a simple application of linear algebra, with the goal to correct for spillovers of all dyes into all detectors, such that on output, the data are effectively normalized so that each parameter contains information from a single dye. In general, our ability to process data is most effective when the visualization of data is presented without unnecessary correlations''.[17]
In general, when graphs of one or more parameters are displayed, it is to show that the other parameters do not contribute to the distribution shown. Especially when using the parameters which are more than double, this problem is more problematic. Up to now, no tools have been discovered to efficiently display multidimensional parameters. compensation is very important to see the distinction between cells.

Gating
The data generated by flow-cytometers can be plotted in a single dimension, to produce a histogram, or in two-dimensional dot plots or even in three dimensions. The regions on these plots can be sequentially separated, based on fluorescence intensity, by creating a series of subset extractions, termed "gates." Specific gating protocols exist for diagnostic and clinical purposes especially in relation to hematology. Individual single cells are often distinguished from cell doublets or higher aggregates by their "time-of-flight" (denoted also as a "pulse-width") through the narrowly focused laser beam[18]
The plots are often made on logarithmic scales. Because different fluorescent dyes' emission spectra overlap,[19][20] signals at the detectors have to be compensated electronically as well as computationally. Data accumulated using the flow cytometer can be analyzed using software. Once the data is collected, there is no need to stay connected to the flow cytometer and analysis is most often performed on a separate computer. This is especially necessary in core facilities where usage of these machines is in high demand.
Computational analysis
Recent progress on automated population identification using computational methods has offered an alternative to traditional gating strategies. Automated identification systems could potentially help findings of rare and hidden populations. Representative automated methods include FLOCK [21] in Immunology Database and Analysis Portal (ImmPort),[22] SamSPECTRAL[23] and flowClust[24][25][26] in Bioconductor, and FLAME [27] in GenePattern. T-Distributed Stochastic Neighbor Embedding (tSNE) is an algorithm designed to perform dimensionality reduction, to allow visualization of complex multi-dimensional data in a two-dimensional "map".[28] Collaborative efforts have resulted in an open project called FlowCAP (Flow Cytometry: Critical Assessment of Population Identification Methods,[29]) to provide an objective way to compare and evaluate the flow cytometry data clustering methods, and also to establish guidance about appropriate use and application of these methods.
Cell sorting by flow cytometry
Cell sorting is a method to purify cell populations based on the presence or absence of specific physical characteristics. [12][30] [14] In flow cytometers with sorting capabilities, the instrument detects cells using parameters including cell size, morphology, and protein expression, and then droplet technology to sort cells and recover the subsets for post-experimental use [12] [14].
The first prototype sorter was built at the Los Alamos National Laboratory (LANL) in 1965 by physicist Mack J. Fulwyler by joining a Coulter volume sensor with the newly-invented ink jet printer. [31] Live cell cell sorter or fluorescence-activated cell sorter (FACS)* was generated by Len Herzenberg, who subsequently won the Kyoto Prize in 2006 for his seminal work.[32]
*The acronym FACS is trademarked and owned by BD Biosciences-Immunocytometry Systems, a division of Becton-Dickinson, which licensed Stanford's patents. [30][33]
_B.jpg)
Flow cytometry cell sorters have a collection system unlike flow cytometry analyzers. The collection process starts when a sample is injected into a stream of sheath fluid that passes through the flow cell and laser intercepts.[34] The stream then carries the cell through a vibrating nozzle. The disturbance in the stream causes it to break into a droplet containing ideally one cell. An electrical charging ring is placed just at the point where the stream breaks into droplets. A charge is placed on the ring based immediately prior to fluorescence intensity being measured, and the opposite charge is trapped on the droplet as it breaks from the stream. The charged droplets then fall through an electrostatic deflection system that diverts droplets into containers based upon their charge. In some systems, the charge is applied directly to the stream, and the droplet breaking off retains charge of the same sign as the stream. The stream is then returned to neutral after the droplet breaks off.
If collected under sterile conditions, these cells can be further cultured, manipulated, and studied.
Labels

Flow cytometry uses the light properties scattered from cells or particles for identification or quantitative measurement of physical properties. Labels, dyes, and stains can be used for multi-parametric analysis (understand more properties about a cell). Immunophenotyping is the analysis of heterogeneous populations of cells using labeled antibodies[35] and other fluorophore containing reagents such as dyes and stains.
Fluorescent labels
A wide range of fluorophores can be used as labels in flow cytometry.[19] Fluorophores, or simply "fluors", are typically attached to an antibody that recognizes a target feature on or in the cell; they may also be attached to a chemical entity with affinity for the cell membrane or another cellular structure. Each fluorophore has a characteristic peak excitation and emission wavelength, and the emission spectra often overlap. Consequently, the combination of labels which can be used depends on the wavelength of the lamp(s) or laser(s) used to excite the fluorochromes and on the detectors available.[36] The maximum number of distinguishable fluorescent labels is thought to be 17 or 18, and this level of complexity necessitates laborious optimization to limit artifacts, as well as complex deconvolution algorithms to separate overlapping spectra.[37] Flow cytometry uses fluorescence as a quantitative tool; the utmost sensitivity of flow cytometry is unmatched by other fluorescent detection platforms such as confocal microscopy. Absolute fluorescence sensitivity is generally lower in confocal microscopy because out-of-focus signals are rejected by the confocal optical system and because the image is built up serially from individual measurements at every location across the cell, reducing the amount of time available to collect signal.[38]
Quantum dots
Quantum dots are sometimes used in place of traditional fluorophores because of their narrower emission peaks.
Isotope labeling
Mass cytometry overcomes the fluorescent labeling limit by utilizing lanthanide isotopes attached to antibodies. This method could theoretically allow the use of 40 to 60 distinguishable labels and has been demonstrated for 30 labels.[37] Mass cytometry is fundamentally different from flow cytometry: cells are introduced into a plasma, ionized, and associated isotopes are quantified via time-of-flight mass spectrometry. Although this method permits the use of a large number of labels, it currently has lower throughput capacity than flow cytometry. It also destroys the analysed cells, precluding their recovery by sorting.[37]
Cytometric bead array
In addition to the ability to label and identify individual cells via fluorescent antibodies, cellular products such as cytokines, proteins, and other factors may be measured as well. Similar to ELISA sandwich assays, cytometric bead array (CBA) assays use multiple bead populations typically differentiated by size and different levels of fluorescence intensity to distinguish multiple analytes in a single assay. The amount of the analyte captured is detected via a biotinylated antibody against a secondary epitope of the protein, followed by a streptavidin-R-phycoerythrin treatment. The fluorescent intensity of R-phycoerythrin on the beads is quantified on a flow cytometer equipped with a 488 nm excitation source. Concentrations of a protein of interest in the samples can be obtained by comparing the fluorescent signals to those of a standard curve generated from a serial dilution of a known concentration of the analyte. Commonly also referred to as cytokine bead array (CBA).
Impedance flow cytometry
Impedance-based single cell analysis systems are commonly known as Coulter counters. They represent a well-established method for counting and sizing virtually any kind of cells and particles. The label-free technology has recently been enhanced by a "lab-on-a-chip" based approach and by applying high frequency alternating current (AC) in the radio frequency range (from 100 kHz to 30 MHz) instead of a static direct current (DC) or low frequency AC field.[39] This patented technology allows a highly accurate cell analysis and provides additional information like membrane capacitance and viability. The relatively small size and robustness allow battery powered on-site use in the field.
Measurable parameters
- Apoptosis (quantification, measurement of DNA degradation, mitochondrial membrane potential, permeability changes, caspase activity)
- Cell adherence (for instance, pathogen-host cell adherence)
- Cell pigments such as chlorophyll or phycoerythrin
- Cell surface antigens (Cluster of differentiation (CD) markers)
- Cell viability
- Circulating tumor cells: isolation and purification
- Characterising multidrug resistance (MDR) in cancer cells
- Chromosome analysis and sorting (library construction, chromosome paint)
- DNA copy number variation (by Flow-FISH or BACs-on-Beads technology)
- Enzymatic activity
- Glutathione
- Intracellular antigens (various cytokines, secondary mediators, etc.)
- Membrane fluidity
- Monitoring electropermeabilization of cells
- Nuclear antigens
- Oxidative burst
- pH, intracellular ionized calcium, magnesium, membrane potential
- Protein expression and localization
- Protein modifications, phospho-proteins
- Scattering of light can be used to measure volume (by forward scatter) and morphological complexity (by side scatter) of cells or other particles, even those that are non-fluorescent. These are conventionally abbreviated as FSC and SSC respectively.
- Total DNA content (cell cycle analysis, cell kinetics, proliferation, ploidy, aneuploidy, endoreduplication, etc.)
- Total RNA content
- Transgenic products in vivo, particularly the green fluorescent protein or related fluorescent proteins
- Various combinations (DNA/surface antigens, etc.)
Applications
The technology has applications in a number of fields, including molecular biology, pathology, immunology, virology,[40] plant biology and marine biology.[41] It has broad application in medicine especially in transplantation, hematology, tumor immunology and chemotherapy, prenatal diagnosis, genetics and sperm sorting for sex preselection. Flow cytometry is widely applied to detect sperm cells abnormality associated with DNA fragmentation[42] in male fertility assays.[43] Also, it is extensively used in research for the detection of DNA damage,[44][45] caspase cleavage and apoptosis.[46] In neuroscience, co-expression of cell surface and intracellular antigens can also be analyzed.[47] In marine biology, the autofluorescent properties of photosynthetic plankton can be exploited by flow cytometry in order to characterise abundance and community structure. In microbiology, it can be used to screen and sort transposon mutant libraries constructed with a GFP-encoding transposon (TnMHA).[48] In protein engineering, flow cytometry is used in conjunction with yeast display and bacterial display to identify cell surface-displayed protein variants with desired properties. The main advantages of flow cytometry over histology and IHC is the possibility to precisely measure the quantities of antigens and the possibility to stain each cell with multiple antibodies-fluorophores, in current laboratories around 10 antibodies can be bound to each cell. This is much less than mass cytometer where up to 40 can be currently measured, but at a higher price and a slower pace.
See also
| Wikimedia Commons has media related to Flow cytometry. |
- Annexin A5 affinity assay, a test for cells undergoing apoptosis, often uses flow cytometry
- Cell cycle analysis
- Coulter counter
- Cytometry
- Dielectrophoresis
- Flow Cytometry Standard
- Mass cytometry
- Microfluorimetry
Bibliography
- Flow Cytometry in Microbiology" by David Lloyd ISBN 3-540-19796-6
- Practical Flow Cytometry by Howard M. Shapiro. ISBN 0-471-41125-6
- Flow Cytometry for Biotechnology by Larry A. Sklar. ISBN 0-19-515234-4
- Handbook of Flow Cytometry Methods by J. Paul Robinson, et al. ISBN 0-471-59634-5
- Current Protocols in Cytometry, Wiley-Liss Pub. ISSN 1934-9297
- Flow Cytometry in Clinical Diagnosis, v4, (Carey, McCoy, and Keren, eds), ASCP Press, 2007. ISBN 0-89189-548-5
- ′′Essential Cytometry Methods′′ by Z. Darzynkiewicz, J.P. Robinson and M. Roederer, Elsevier/Academic Press, 2010. ISBN 978-0-12-375045-7
- ′′Ormerod, M.G. (ed.) (2000) Flow Cytometry — A practical approach. 3rd edition. Oxford University Press, Oxford, UK. ISBN 0-19-963824-1
- ′′Ormerod, M.G. (1999) Flow Cytometry. 2nd edition. BIOS Scientific Publishers, Oxford. ISBN 1-85996-107-X
- Flow Cytometry — A basic introduction. Michael G. Ormerod, 2008. ISBN 978-0-9559812-0-3
- ′′ Methods in Cell Biology, Cytometry, 4th edition, Vol. 75. by Z. Darzynkiewicz, M. Roederer and H.J. Tanke. Elsevier /Academic Press, 2004, ISBN 0-12-480283-4.
- ′′Recent Advances in Cytometry. PART A′′ by Z. Darzynkiewicz et al., Methods in Cell Biology, Vol. 102, Elsevier/Academic Press, 2011. ISBN 978-0-12-374912-3.
- ′′Recent Advances in Cytometry. PART B′′ by Z. Darzynkiewicz et al., Methods in Cell Biology, Vol. 103, Elsevier/Academic Press, 2011. ISBN 978-0-12-385493-3
References
- ↑ Picot J, Guerin CL, Le Van Kim C, Boulanger CM (March 2012). "Flow cytometry: retrospective, fundamentals and recent instrumentation". Cytotechnology. 64 (2): 109–30. doi:10.1007/s10616-011-9415-0. PMC 3279584. PMID 22271369.
- ↑ "flow cytometry". TheFreeDictionary.com. Retrieved 2018-09-18.
- ↑ "Practical Flow Cytometry - Beckman Coulter". www.beckman.com. Retrieved 2018-09-18.
- ↑ Givan, Alice L. (2010-11-15), "Flow Cytometry: An Introduction", Flow Cytometry Protocols, Humana Press, pp. 1–29, doi:10.1007/978-1-61737-950-5_1, ISBN 9781617379499, retrieved 2018-09-18
- ↑ US 3380584, Mack Fulwyler, "Particle Separator", issued 1965-06-01
- ↑ Fulwyler MJ (November 1965). "Electronic separation of biological cells by volume". Science. 150 (3698): 910–1. doi:10.1126/science.150.3698.910. PMID 5891056.
- ↑ DE 1815352, Wolfgang Dittrich & Wolfgang Göhde, "Flow-through Chamber for Photometers to Measure and Count Particles in a Dispersion Medium"
- ↑ Kamentsky in Proceedings of the 1968 Conference „Cytology Automation" (1970), edited by D. M. D. Evans.
- ↑ Sack, Ulrich; et al. Zelluläre Diagnostik. Karger Publishers (2006).
- ↑ "Centenary Institute - Resources & Equipment".
- ↑ "BD Biosciences - Special Order Products".
- 1 2 3 4 5 6 7 8 9 Cossarizza A, Chang HD, Radbruch A, Akdis M, Andrä I, Annunziato F, et al. (October 2017). "Guidelines for the use of flow cytometry and cell sorting in immunological studies". European Journal of Immunology. 47 (10): 1584–1797. doi:10.1002/eji.201646632. PMID 29023707.
- 1 2 Bio-Rad. "Fluidics System - Flow Cytometry Guide | Bio-Rad". Bio-Rad. Retrieved 2018-09-18.
- 1 2 3 4 5 "How a Flow Cytometer Works | Thermo Fisher Scientific - US". www.thermofisher.com. Retrieved 2018-09-18.
- ↑ Nolan JP, Condello D (January 2013). "Spectral flow cytometry". Current Protocols in Cytometry. Chapter 1: Unit1.27. doi:10.1002/0471142956.cy0127s63. PMC 3556726. PMID 23292705.
- ↑ Han Y, Gu Y, Zhang AC, Lo YH (November 2016). "Review: imaging technologies for flow cytometry". Lab on a Chip. 16 (24): 4639–4647. doi:10.1039/c6lc01063f. PMC 5311077. PMID 27830849.
- 1 2 Roederer M (November 2001). "Spectral compensation for flow cytometry: visualization artifacts, limitations, and caveats". Cytometry. 45 (3): 194–205. doi:10.1002/1097-0320(20011101)45:3<194::aid-cyto1163>3.0.co;2-c. PMID 11746088.
- ↑ Sharpless T, Traganos F, Darzynkiewicz Z, Melamed MR. (1975) Flow cytofluorometry: Discrimination between single cells and cell aggregates by direct size measurements. Acta Cytol 19:577-581. PMID 1108568
- 1 2 "Fluorochrome Table (Tools)". www.thefcn.org.
- ↑ Fluorochrome Table Archived October 20, 2014, at the Wayback Machine.
- ↑ Qian Y, Wei C, Eun-Hyung Lee F, Campbell J, Halliley J, Lee JA, Cai J, Kong YM, Sadat E, Thomson E, Dunn P, Seegmiller AC, Karandikar NJ, Tipton CM, Mosmann T, Sanz I, Scheuermann RH (2010). "Elucidation of seventeen human peripheral blood B-cell subsets and quantification of the tetanus response using a density-based method for the automated identification of cell populations in multidimensional flow cytometry data". Cytometry. Part B, Clinical Cytometry. 78 Suppl 1: S69–82. doi:10.1002/cyto.b.20554. PMC 3084630. PMID 20839340.
- ↑ "Immunology Database and Analysis Portal". Archived from the original on July 26, 2011. Retrieved 2009-09-03.
- ↑ Zare H, Shooshtari P, Gupta A, Brinkman RR (July 2010). "Data reduction for spectral clustering to analyze high throughput flow cytometry data". BMC Bioinformatics. 11: 403. doi:10.1186/1471-2105-11-403. PMC 2923634. PMID 20667133.
- ↑ "flowClust". Retrieved 2009-09-03.
- ↑ Lo K, Brinkman RR, Gottardo R (April 2008). "Automated gating of flow cytometry data via robust model-based clustering". Cytometry. Part A. 73 (4): 321–32. doi:10.1002/cyto.a.20531. PMID 18307272.
- ↑ Lo K, Hahne F, Brinkman RR, Gottardo R (May 2009). "flowClust: a Bioconductor package for automated gating of flow cytometry data". BMC Bioinformatics. 10: 145. doi:10.1186/1471-2105-10-145. PMID 19442304.
- ↑ "FLow analysis with Automated Multivariate Estimation (FLAME)". Archived from the original on August 21, 2009. Retrieved 2009-09-03.
- ↑ Martin W, Fernanda V, Ian J (2016-10-13). "How to Use t-SNE Effectively". Distill.
- ↑ "FlowCAP - Flow Cytometry: Critical Assessment of Population Identification Methods". Retrieved 2009-09-03.
- 1 2 "Fluorescence-Activated Cell Sorter". The Scientist Magazine®. Retrieved 2018-09-18.
- ↑ "SIA RU009554, The History of the Cell Sorter Videohistory Collection 1991". Smithsonian Institution Archives. Fulwyler, Mack Jett. interviewee, Herzenberg, Leonard A. interviewee, Herzenberg, Leonore A. interviewee, Bach, Bruce Allen. interviewee, Krasnow, Mark A. interviewee, Mhatre, Nagesh S. interviewee. 1991. Retrieved 2018-09-18.
- ↑ Julius MH, Masuda T, Herzenberg LA (July 1972). "Demonstration that antigen-binding cells are precursors of antibody-producing cells after purification with a fluorescence-activated cell sorter". Proceedings of the National Academy of Sciences of the United States of America. 69 (7): 1934–8. doi:10.1073/pnas.69.7.1934. PMC 426835. PMID 4114858.
- ↑ "12 Flow Cytometry Terms And Definitions Most Scientists Get Wrong | Expert Cytometry". Expert Cytometry. 2016-05-04. Retrieved 2018-09-18.
- ↑ "Cell Sorting – Faculty of Medicine Flow Cytometry Facility". flowcytometry.utoronto.ca. Retrieved 2018-09-18.
- ↑ "Conjugation of monoclonal antibodies". www.drmr.com. Retrieved 2018-09-18.
- ↑ Loken MR (1990). "Immunofluorescence Techniques in Flow Cytometry and Sorting" (2nd ed.). Wiley: 341&ndash, 53.
- 1 2 3 Ornatsky O, Bandura D, Baranov V, Nitz M, Winnik MA, Tanner S (September 2010). "Highly multiparametric analysis by mass cytometry". Journal of Immunological Methods. 361 (1–2): 1–20. doi:10.1016/j.jim.2010.07.002. PMID 20655312.
- ↑ Basiji DA, Ortyn WE, Liang L, Venkatachalam V, Morrissey P (September 2007). "Cellular image analysis and imaging by flow cytometry". Clinics in Laboratory Medicine. 27 (3): 653–70, viii. doi:10.1016/j.cll.2007.05.008. PMC 2034394. PMID 17658411.
- ↑ Cheung KC, Di Berardino M, Schade-Kampmann G, Hebeisen M, Pierzchalski A, Bocsi J, Mittag A, Tárnok A (July 2010). "Microfluidic impedance-based flow cytometry". Cytometry. Part A. 77 (7): 648–66. doi:10.1002/cyto.a.20910. PMID 20583276.
- ↑ Zamora JLR, Aguilar HC.(2018)Flow virometry as a tool to study viruses. Review. Methods. Feb 1;134-135:87-97, PMID 29258922 doi: 10.1016/j.ymeth.2017.12.011
- ↑ Murphy RW, Lowcock LA, Smith C, Darevsky IS, Orlov N, MacCulloch RD, Upton DE (1997). "Flow cytometry in biodiversity surveys: methods, utility and constraints". Amphibia-Reptilia. 18: 1–13. doi:10.1163/156853897x00260.
- ↑ Gorczyca W, Traganos F, Jesionowska H, Darzynkiewicz Z. (1993) Presence of DNA strand breaks and increased sensitivity of DNA in situ to denaturation in abnormal human sperm cells: analogy to apoptosis of somatic cells.Exp Cell Res. 207:202-5. PMID 8391465
- ↑ Evenson DP. (2017) Evaluation of sperm chromatin structure and DNA strand breaks is an important part of clinical male fertility assessment. Transl Androl Urol. 2017 Sep;6(Suppl 4):S495-S500. PMID 29082168
- ↑ Tanaka T, Halicka HD, Huang X, Traganos F, Darzynkiewicz Z. (2006) Constitutive histone H2AX phosphorylation and ATM activation, the reporters of DNA damage by endogenous oxidants. Cell Cycle 5:1940-1945, PMID 16940754
- ↑ MacPhail SH, Banáth JP, Yu Y, Chu E, Olive PL.Cell cycle-dependent expression of phosphorylated histone H2AX: reduced expression in unirradiated but not X-irradiated G1-phase cells.Radiat Res. 2003 Jun;159(6):759-67. PMID 12751958
- ↑ Darzynkiewicz Z, Juan G, Li X, Gorczyca W, Murakami, M. Traganos F. (1997) Cytometry in cell necrobiology. Analysis of apoptosis and accidental cell death (necrosis). Cytometry 27:1-20, PMID 9000580.
- ↑ Menon V, Thomas R, Ghale AR, Reinhard C, Pruszak J (December 2014). "Flow cytometry protocols for surface and intracellular antigen analyses of neural cell types". Journal of Visualized Experiments (94). doi:10.3791/52241. PMC 4396953. PMID 25549236.
- ↑ Antypas H, Veses-Garcia M, Weibull E, Andersson-Svahn H, Richter-Dahlfors A (June 2018). "A universal platform for selection and high-resolution phenotypic screening of bacterial mutants using the nanowell slide". Lab on a Chip. 18 (12): 1767–1777. doi:10.1039/c8lc00190a. PMID 29781496.
External links
| Library resources about Flow cytometry |
- Flow+cytometry at the US National Library of Medicine Medical Subject Headings (MeSH)