Faqirwali
| Faqirwali | |
|---|---|
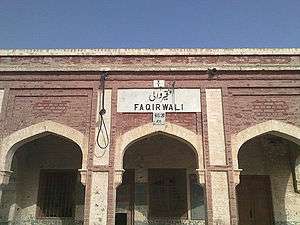 Faqirwali's historic Railway Station | |
 Faqirwali | |
| Coordinates: 29°28′N 73°02′E / 29.47°N 73.04°ECoordinates: 29°28′N 73°02′E / 29.47°N 73.04°E | |
| Country |
|
| Province | Punjab |
| Elevation | 114 m (374 ft) |
| Time zone | UTC+5 (PST) |
| Postal code | 62050 |
| Dialing code | 063 |
Faqirwali (Urdu: فقِيروالى), is a town of Bahawalnagar District in the Punjab province of eastern Pakistan.[1]
Climate
The average climate of Faqirwali is hot and humid. The temperature extremes occur during the months of May, June, and July, when the temperature reaches up to 49-53 °C. In August, the monsoon seasons starts, with heavy rainfall throughout the area. December and January are the coldest months, when temperatures can drop up to -1 °C. The annual average rainfall is 160 mm.
| Climate data for Faqirwali | |||||||||||||
|---|---|---|---|---|---|---|---|---|---|---|---|---|---|
| Month | Jan | Feb | Mar | Apr | May | Jun | Jul | Aug | Sep | Oct | Nov | Dec | Year |
| Record high °C (°F) | 29.3 (84.7) |
35.6 (96.1) |
39.4 (102.9) |
45.6 (114.1) |
48.0 (118.4) |
50.1 (122.2) |
46.0 (114.8) |
42.4 (108.3) |
42.0 (107.6) |
40.0 (104) |
37.0 (98.6) |
29.6 (85.3) |
50.1 (122.2) |
| Average high °C (°F) | 20.6 (69.1) |
22.76 (72.97) |
28.3 (82.9) |
35.9 (96.6) |
40.8 (105.4) |
42.0 (107.6) |
38.3 (100.9) |
37.4 (99.3) |
36.5 (97.7) |
34.2 (93.6) |
28.6 (83.5) |
22.5 (72.5) |
32.32 (90.17) |
| Daily mean °C (°F) | 13.3 (55.9) |
15.7 (60.3) |
21.0 (69.8) |
28.0 (82.4) |
32.8 (91) |
35.1 (95.2) |
33.1 (91.6) |
32.4 (90.3) |
30.6 (87.1) |
26.4 (79.5) |
20.6 (69.1) |
15.0 (59) |
25.3 (77.6) |
| Average low °C (°F) | 5.8 (42.4) |
8.4 (47.1) |
13.8 (56.8) |
20.0 (68) |
24.7 (76.5) |
28.2 (82.8) |
27.8 (82) |
27.4 (81.3) |
24.7 (76.5) |
18.6 (65.5) |
12.6 (54.7) |
7.6 (45.7) |
18.3 (64.9) |
| Record low °C (°F) | 0.0 (32) |
−1.0 (30.2) |
3.9 (39) |
12.6 (54.7) |
14.4 (57.9) |
18.3 (64.9) |
16.1 (61) |
21.4 (70.5) |
13.1 (55.6) |
11.0 (51.8) |
4.0 (39.2) |
1.7 (35.1) |
−1 (30.2) |
| Average precipitation mm (inches) | 4.5 (0.177) |
16.5 (0.65) |
15.2 (0.598) |
10.2 (0.402) |
4.8 (0.189) |
15.3 (0.602) |
77.2 (3.039) |
39.9 (1.571) |
9.5 (0.374) |
1.0 (0.039) |
4.3 (0.169) |
5.0 (0.197) |
203.4 (8.007) |
| Mean monthly sunshine hours | 222.4 | 218.9 | 250.8 | 274.3 | 269.1 | 213.9 | 218.3 | 256.6 | 279.3 | 284.0 | 260.8 | 223.5 | 2,971.9 |
| Source: NOAA (1971–1990) "Bahawalnagar Climate Normals 1971–1990". National Oceanic and Atmospheric Administration. Retrieved January 16, 2013. | |||||||||||||
References
Neighbourhoods of Bahawalpur | ||
|---|---|---|
Administrations: Bahawalpur Division and Bahawalpur District | ||
| Tehsils |  | |
| Cities | ||
| Towns and councils | ||
| Villages | ||
Website: Bahawalpur District at NRB | ||
This article is issued from
Wikipedia.
The text is licensed under Creative Commons - Attribution - Sharealike.
Additional terms may apply for the media files.