Emission intensity
An emission intensity (also carbon intensity, C.I.) is the emission rate of a given pollutant relative to the intensity of a specific activity, or an industrial production process; for example grams of carbon dioxide released per megajoule of energy produced, or the ratio of greenhouse gas emissions produced to gross domestic product (GDP). Emission intensities are used to derive estimates of air pollutant or greenhouse gas emissions based on the amount of fuel combusted, the number of animals in animal husbandry, on industrial production levels, distances traveled or similar activity data. Emission intensities may also be used to compare the environmental impact of different fuels or activities. In some case the related terms emission factor and carbon intensity are used interchangeably. The jargon used can be different, for different fields/industrial sectors; normally the term "carbon" excludes other pollutants, such as particulate emissions. One commonly used figure is carbon intensity per kilowatt-hour (CIPK), which is used to compare emissions from different sources of electrical power.
Methodologies
Different methodologies can be used to assess the carbon intensity of a process. Among the most used methodologies there are:
- The whole life-cycle assessment (LCA): this includes not only the carbon emissions due to a specific process, but also those due to the production and end-of-life of materials, plants and machineries used for the considered process. This is a quite complex method, requiring a big set of variables.
- The well-to-wheels (WTW), commonly used in the Energy and Transport sectors: this is a simplified LCA considering the emissions of the process itself, the emissions due to the extraction and refining of the material (or fuel) used in the process (also "Upstream emissions", but excluding the emissions due to the production and end-of-life of plants and machineries. This methodology is used, in the U.S.A., by the GREET model and in Europe in the JEC WTW.
- WTW-LCA hybrid methods, trying to fill in the gap between the WTW and LCA methods. In example, for an Electric Vehicle, an hybrid method considering also the GHG due to the manufacturing and the end of life of the battery gives GHG emissions 10-13% higher, compared to the WTW [1]
- Methods not considering LCA aspects but only the emissions occurring during a specific process; i.e. just the combustion of a fuel in a power plant, without considering the Upstream emissions. [2]
Different calculation methods can lead to different results. The results can largely vary also for different geographic regions and timeframes (see, in example, how C.I. of electricity varies, for different European countries, and how varied in a few years: from 2009 to 2013 the C.I. of electricity in the European Union fell on average by 20%,[3] So while comparing different values of Carbon Intensity it is important to correctly consider all the boundary conditions (or initial hypotheses) considered for the calculations. For example, Chinese oil fields emit between 1.5 to more than 40 g of CO2eq per MJ with about 90% of all fields emitting 1.5–13.5 g CO2eq.[4] Such highly skewed carbon intensity patterns necessitate disaggregation of seemingly homogenous emission activities and proper consideration of many factors for understanding.[5]
Estimating emissions
Emission factors assume a linear relation between the intensity of the activity and the emission resulting from this activity:
Emissionpollutant = Activity * Emission Factorpollutant
Intensities are also used in projecting possible future scenarios such as those used in the IPCC assessments, along with projected future changes in population, economic activity and energy technologies. The interrelations of these variables is treated under the so-called Kaya identity.
The level of uncertainty of the resulting estimates depends significantly on the source category and the pollutant. Some examples:
- Carbon dioxide (CO2) emissions from the combustion of fuel can be estimated with a high degree of certainty regardless of how the fuel is used as these emissions depend almost exclusively on the carbon content of the fuel, which is generally known with a high degree of precision. The same is true for sulphur dioxide (SO2), since sulphur contents of fuels are also generally well known. Both carbon and sulphur are almost completely oxidized during combustion and all carbon and sulphur atoms in the fuel will be present in the flue gases as CO2 and SO2 respectively.
- In contrast, the levels of other air pollutants and non-CO2 greenhouse gas emissions from combustion depend on the precise technology applied when fuel is combusted. These emissions are basically caused by either incomplete combustion of a small fraction of the fuel (carbon monoxide, methane, non-methane volatile organic compounds) or by complicated chemical and physical processes during the combustion and in the smoke stack or tailpipe. Examples of these are particulates, NOx, a mixture of nitric oxide, NO, and nitrogen dioxide, NO2).
- Nitrous oxide (N2O) emissions from agricultural soils are highly uncertain because they depend very much on both the exact conditions of the soil, the application of fertilizers and meteorological conditions.
Energy sources emission intensity per unit of energy generated
A literature review of numerous total life cycle energy sources CO2 emissions per unit of electricity generated, conducted by the Intergovernmental Panel on Climate Change in 2011, found that the CO2 emission value, that fell within the 50th percentile of all total life cycle emissions studies were as follows.[6]
| Technology | Description | 50th percentile (g CO2-eq/kWhe) |
|---|---|---|
| Hydroelectric | reservoir | 4 |
| Wind | onshore | 12 |
| Nuclear | various generation II reactor types | 16 |
| Biomass | various | 230 |
| Solar thermal | parabolic trough | 22 |
| Geothermal | hot dry rock | 45 |
| Solar PV | Polycrystalline silicon | 46 |
| Natural gas | various combined cycle turbines without scrubbing | 469 |
| Coal | various generator types without scrubbing | 1001 |
| Fuel/ Resource |
Thermal g(CO2-eq)/MJth |
Energy Intensity (min & max estimate) W·hth/W·he |
Electric (min & max estimate) g(CO2-eq)/kW·he |
|---|---|---|---|
| wood | 115[7] | ||
| Peat | 106[8] 110[7] |
||
| Coal | B:91.50–91.72 Br:94.33 88 |
B:2.62–2.85[9] Br:3.46[9] 3.01 |
B:863–941[9] Br:1,175[9] 955[10] |
| Oil | 73[11] | 3.40 | 893[10] |
| Natural gas | cc:68.20 oc:68.40 51[11] |
cc:2.35 (2.20 – 2.57)[9] oc:3.05 (2.81 – 3.46)[9] |
cc:577 (491–655)[9] oc:751 (627–891)[9] 599[10] |
| Geothermal Power |
3~ | TL0–1[10] TH91–122[10] | |
| Uranium Nuclear power |
WL0.18 (0.16~0.40)[9] WH0.20 (0.18~0.35)[9] |
WL60 (10~130)[9] WH65 (10~120)[9] | |
| Hydroelectricity | 0.046 (0.020 – 0.137)[9] | 15 (6.5 – 44)[9] | |
| Conc. Solar Pwr | 40±15# | ||
| Photovoltaics | 0.33 (0.16 – 0.67)[9] | 106 (53–217)[9] | |
| Wind power | 0.066 (0.041 – 0.12)[9] | 21 (13–40)[9] |
Note: 3.6 MJ = megajoule(s) == 1 kW·h = kilowatt-hour(s), thus 1 g/MJ = 3.6 g/kW·h.
Legend: B = Black coal (supercritical)–(new subcritical), Br = Brown coal (new subcritical), cc = combined cycle, oc = open cycle, TL = low-temperature/closed-circuit (geothermal doublet), TH = high-temperature/open-circuit, WL = Light Water Reactors, WH = Heavy Water Reactors, #Educated estimate.
Carbon intensity of regions
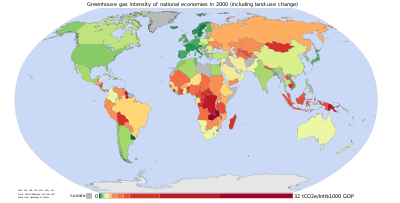 Greenhouse gas intensity in the year 2000, including land-use change. |
_for_different_regions%2C_1982-2011.png) Carbon intensity of GDP (using PPP) for different regions, 1982-2011. |
_for_different_regions%2C_1982-2011_(corrected).png) Carbon intensity of GDP (using MER) for different regions, 1982-2011. |
The following tables show carbon intensity of GDP in market exchange rates (MER) and purchasing power parities (PPP). Units are metric tons of carbon dioxide per thousand year 2005 US dollars. Data are taken from the US Energy Information Administration.[12] Annual data between 1980 and 2009 are averaged over three decades: 1980-89, 1990–99, and 2000–09.
| 1980-89 | 1990-99 | 2000-09 | |
|---|---|---|---|
| Africa | 1.13149 | 1.20702 | 1.03995 |
| Asia & Oceania | 0.86256 | 0.83015 | 0.91721 |
| Central & South America | 0.55840 | 0.57278 | 0.56015 |
| Eurasia | NA | 3.31786 | 2.36849 |
| Europe | 0.36840 | 0.37245 | 0.30975 |
| Middle East | 0.98779 | 1.21475 | 1.22310 |
| North America | 0.69381 | 0.58681 | 0.48160 |
| World | 0.62170 | 0.66120 | 0.60725 |
| 1980-89 | 1990-99 | 2000-09 | |
|---|---|---|---|
| Africa | 0.48844 | 0.50215 | 0.43067 |
| Asia & Oceania | 0.66187 | 0.59249 | 0.57356 |
| Central & South America | 0.30095 | 0.30740 | 0.30185 |
| Eurasia | NA | 1.43161 | 1.02797 |
| Europe | 0.40413 | 0.38897 | 0.32077 |
| Middle East | 0.51641 | 0.65690 | 0.65723 |
| North America | 0.66743 | 0.56634 | 0.46509 |
| World | 0.54495 | 0.54868 | 0.48058 |
In 2009 CO2 intensity of GDP in the OECD countries reduced by 2.9% and amounted to 0.33 kCO2/$05p in the OECD countries.[13] ("$05p" = 2005 US dollars, using purchasing power parities). The USA posted a higher ratio of 0.41 kCO2/$05p while Europe showed the largest drop in CO2 intensity compared to the previous year (−3.7%). CO2 intensity continued to be roughly higher in non-OECD countries. Despite a slight improvement, China continued to post a high CO2 intensity (0.81 kCO2/$05p). CO2 intensity in Asia rose by 2% during 2009 since energy consumption continued to develop at a strong pace. Important ratios were also observed in countries in CIS and the Middle East.
Carbon intensity in Europe
Total CO2 emissions from energy use were 5% below their 1990 level in 2007.[14] Over the period 1990–2007, CO2 emissions from energy use have decreased on average by 0.3%/year although the economic activity (GDP) increased by 2.3%/year. After dropping until 1994 (−1.6%/year), the CO2 emissions have increased steadily (0.4%/year on average) until 2003 and decreased slowly again since (on average by 0.6%/year). Total CO2 emissions per capita decreased from 8.7 t in 1990 to 7.8 t in 2007, that is to say a decrease by 10%. Almost 40% of the reduction in CO2 intensity is due to increased use of energy carriers with lower emission factors Total CO2 emissions per unit of GDP, the “CO2 intensity”, decreased more rapidly than energy intensity: by 2.3%/year and 1.4%/year, respectively, on average between 1990 and 2007.[15]
The Commodity Exchange Bratislava (CEB) has calculated carbon intensity for Voluntary Emissions Reduction projects carbon intensity in 2012 to be 0,343 tn/MWh.[16]
Emission factors for greenhouse gas inventory reporting
One of the most important uses of emission factors is for the reporting of national greenhouse gas inventories under the United Nations Framework Convention on Climate Change (UNFCCC). The so-called Annex I Parties to the UNFCCC have to annually report their national total emissions of greenhouse gases in a formalized reporting format, defining the source categories and fuels that must be included.
The UNFCCC has accepted the Revised 1996 IPCC Guidelines for National Greenhouse Gas Inventories,[17] developed and published by the Intergovernmental Panel on Climate Change (IPCC) as the emission estimation methods that must be used by the parties to the convention to ensure transparency, completeness, consistency, comparability and accuracy of the national greenhouse gas inventories.[18] These IPCC Guidelines are the primary source for default emission factors. Recently IPCC has published the 2006 IPCC Guidelines for National Greenhouse Gas Inventories. These and many more greenhouse gas emission factors can be found on IPCC's Emission Factor Database.[19] Commercially applicable organisational greenhouse gas emission factors can be found on the search engine, EmissionFactors.com.[20]
Particularly for non-CO2 emissions, there is often a high degree of uncertainty associated with these emission factors when applied to individual countries. In general, the use of country-specific emission factors would provide more accurate estimates of emissions than the use of the default emission factors. According to the IPCC, if an activity is a major source of emissions for a country ('key source'), it is 'good practice' to develop a country-specific emission factor for that activity.
Emission factors for air pollutant inventory reporting
The United Nations Economic Commission for Europe and the EU National Emission Ceilings Directive (2016) require countries to produce annual National Air Pollution Emission Inventories under the provisions of the Convention on Long-Range Transboundary Air Pollution (CLRTAP).
The European Monitoring and Evaluation Programme (EMEP) Task Force of the European Environment Agency has developed methods to estimate emissions and the associated emission factors for air pollutants, which have been published in the EMEP/CORINAIR Emission Inventory Guidebook.[21][22] on Emission Inventories and Projections TFEIP [23]
Intensity targets
The U.S. plans to cut carbon intensity per dollar of GDP by 18% by 2012.[24] This has been criticised by the World Resources Institute as this approach does not ensure absolute reductions if GDP grows faster than intensity declines.[25]
From 1990 to 2000, the carbon intensity of the U.S. economy declined by 17%, yet total emissions increased by 14%.[26] In 2002, the U.S. National Environmental trust labelled carbon intensity, "a bookkeeping trick which allows the administration to do nothing about global warming while unsafe levels of emissions continue to rise."[27]
Sources of emission factors
Greenhouse gases
Air pollutants
See also
- Energy intensity
- Carbon footprint
- List of countries by ratio of GDP to carbon dioxide emissions
- Low carbon economy
- Low-carbon fuel standard
- Emission inventory
- Air pollution
- AP 42 Compilation of Air Pollutant Emission Factors
- Emission standard
- Greenhouse gas and Greenhouse effect
- IPCC list of greenhouse gases
- Mobile Emission Reduction Credit (MERC)
- Radiative forcing
- Kaya identity
References
- ↑ Moro A; Helmers E. "A new hybrid method for reducing the gap between WTW and LCA in the carbon footprint assessment of electric vehicles". Int J Life Cycle Assess (2017) 22: 4. doi:10.1007/s11367-015-0954-z.
- ↑ This method is used by the International Energy Agency in the annual report: CO2 emissions from fuel combustion.
- ↑ Moro A; Lonza L. "Electricity carbon intensity in European Member States: Impacts on GHG emissions of electric vehicles". Transportation Research Part D: Transport and Environment, 2017, ISSN 1361-9209. doi:10.1016/j.trd.2017.07.012.
- ↑ Masnadi, M. (2018). "Well-to-refinery emissions and net-energy analysis of China's crude-oil supply". Nature Energy. 3: 220–226. Bibcode:2018NatEn...3..220M. doi:10.1038/s41560-018-0090-7.
- ↑ Höök, M (2018). "Mapping Chinese supply". Nature Energy. 3: 166–167. Bibcode:2018NatEn...3..166H. doi:10.1038/s41560-018-0103-6.
- 1 2 Moomaw, W., P. Burgherr, G. Heath, M. Lenzen, J. Nyboer, A. Verbruggen, 2011: Annex II: Methodology. In IPCC: Special Report on Renewable Energy Sources and Climate Change Mitigation (ref. page 10)
- 1 2 Hillebrand, K. 1993. The Greenhouse Effects of Peat Production and Use Compared with Coal, Natural Gas and Wood. Technical Research Centre of Finland Archived 2013-11-04 at the Wayback Machine.. Seai.ie
- ↑ The CO2 emission factor of peat fuel 106 g CO2/MJ, Archived 2010-07-07 at the Wayback Machine.. Imcg.net. Retrieved on 2011-05-09.
- 1 2 3 4 5 6 7 8 9 10 11 12 13 14 15 16 17 18 Bilek, Marcela; Hardy, Clarence; Lenzen, Manfred; Dey, Christopher (August 2008). "Life-cycle energy balance and greenhouse gas emissions of nuclear energy: A review" (PDF). Energy Conversion & Management. 49 (8): 2178–2199. Archived from the original (PDF) on 2009-10-25.
- 1 2 3 4 5 Fridleifsson,, Ingvar B.; Bertani, Ruggero; Huenges, Ernst; Lund, John W.; Ragnarsson, Arni; Rybach, Ladislaus (2008-02-11). O. Hohmeyer and T. Trittin, ed. "The possible role and contribution of geothermal energy to the mitigation of climate change" (PDF). Luebeck, Germany: 59–80. Archived from the original (PDF) on 2011-07-22. Retrieved 2009-04-06.
- 1 2 Hanova, J; Dowlatabadi, H (9 November 2007), "Strategic GHG reduction through the use of ground source heat pump technology" (PDF), Environmental Research Letters, UK: IOP Publishing, 2, pp. 044001 8pp, Bibcode:2007ERL.....2d4001H, doi:10.1088/1748-9326/2/4/044001, ISSN 1748-9326, retrieved 2009-03-22
- 1 2 3 US EIA, "Carbon intensity", International Energy Statistics, US Energy Information Administration (EIA), retrieved 21 December 2013 . Archived page. Public-domain source: 'U.S. Government publications are in the public domain and are not subject to copyright protection. You may use and/or distribute any of our data, files, databases, reports, graphs, charts, and other information products that are on our website or that you receive through our email distribution service. However, if you use or reproduce any of our information products, you should use an acknowledgment, which includes the publication date, such as: "Source: U.S. Energy Information Administration (Oct 2008)."' and archived page.
- ↑ "CO2 intensity - Map World CO2 Intensity by region - Enerdata". yearbook.enerdata.net.
- ↑ "Energy Efficiency Trends & Policies - ODYSSEE-MURE". www.odyssee-indicators.org.
- ↑ This section deals with CO2 emissions from energy combustion published in official inventories from the European Environment Agency. The indicators are not expressed under normal climate conditions (i. e. with climate corrections) to comply with the official definition of CO2 inventories. CO2 emissions of final consumers include the emissions of auto producers.
- ↑ Calculation of carbon intensity in 2012 kbb.sk, Slovakia
- ↑ Task Force on National Greenhouse Gas Inventories (1996). "Revised 1996 IPCC Guidelines for National Greenhouse Gas Inventories". IPCC. Retrieved 19 August 2012.
- ↑ "FCCC/SBSTA/2004/8" (PDF). Retrieved 2018-08-20.
- ↑ "Emission Factor Database – Main Page". IPCC. 2012. Retrieved 19 August 2012.
- ↑ "Emission Factors". emissionfactors.com. 2012. Retrieved 19 August 2012.
- ↑ EMEP/CORINAIR Emission Inventory Guidebook.eea.europa.eu, 2016, retrieved 13.7.2018
- ↑ "EMEP Home". www.emep.int.
- ↑ TFEIP, 2008-03-15 tfeip-secretariat
- ↑ White house fact sheet: Earth day 2007 (see section on providing a Realistic growth-orientated approach to climate change
- ↑ Tim Herzog (2007-04-27). "China's Carbon Intensity Target". World resources Institute. Retrieved 2010-11-04.
- ↑ Fischlowitz-Roberts, Bernie (2001). "Carbon Emissions Climbing". Earth Policy Institute. Retrieved 2006-08-12.
- ↑ "National Environmental Trust Special Reports", 2002. Retrieved 2006-08-12 Archived 2007-09-29 at the Wayback Machine.
External links
- Washington Post article with an example of change in carbon intensity
- A Note On Variations in UK Grid Electricity CO2 Intensity with Time
- IPCC Special Report on Emissions Scenarios
- Statistical Energy Review 2012
- World Energy Council:Odyssee Database
- International Energy Agency: CO2 emissions from fuel combustion
- Electricity carbon intensity in European Member States: Impacts on GHG emissions of electric vehicles
- A hybrid LCA-WTW method to assess the carbon footprint of electric vehicles
- Carbon emissions intensity from different regions