Electoral history of Vladimir Putin
| ||
|---|---|---|
|
Incumbent Policies Elections Premiership
|
||
Electoral history of Vladimir Putin, second and fourth President of Russia and 33rd Prime Minister of Russia.
Presidential elections
2000

2000 election. Blue indicates a win by Putin, red a win by Zyuganov, grey a win by Tuleyev.
| 2000 presidential election | ||||
|---|---|---|---|---|
| Candidate | Party | Votes | % | |
| Vladimir Putin | Independent | 39,740,467 | 53.4 | |
| Gennady Zyuganov | Communist Party | 21,928,468 | 29.5 | |
| Grigory Yavlinsky | Yabloko | 4,351,450 | 5.9 | |
| Aman Tuleyev | Independent | 2,217,364 | 3.0 | |
| Vladimir Zhirinovsky | Liberal Democratic Party | 2,026,509 | 2.7 | |
| Konstantin Titov | Independent | 1,107,269 | 1.5 | |
| Ella Pamfilova | For Civic Dignity | 758,967 | 1.0 | |
| Stanislav Govorukhin | Independent | 328,723 | 0.4 | |
| Yury Skuratov | Independent | 319,189 | 0.4 | |
| Alexey Podberezkin | Spiritual Heritage | 98,177 | 0.1 | |
| Umar Dzhabrailov | Independent | 78,498 | 0.1 | |
| Against all | 1,414,673 | 1.9 | ||
| Source: Nohlen & Stöver, [1] | ||||
2004
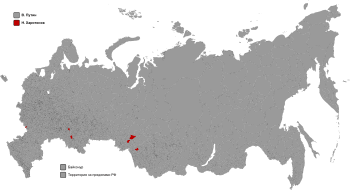
2004 election. Grey indicates a win by Putin, red a win by Kharitonov.
| 2004 presidential election | ||||
|---|---|---|---|---|
| Candidate | Party | Votes | % | |
| Vladimir Putin | Independent | 49,558,328 | 71.9 | |
| Nikolay Kharitonov | Communist Party | 9,514,554 | 13.8 | |
| Sergey Glazyev | Independent | 2,850,610 | 4.1 | |
| Irina Khakamada | Independent | 2,672,189 | 3.9 | |
| Oleg Malyshkin | Liberal Democratic Party | 1,405,326 | 2.0 | |
| Sergey Mironov | Russian Party of Life | 524,332 | 0.8 | |
| Against all | 2,397,140 | 3.5 | ||
| Source: Nohlen & Stöver | ||||
2012
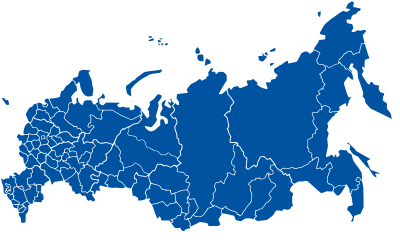
2012 election. Blue indicates a win by Putin.
United Russia nomination
| For | Against | ||||||
|---|---|---|---|---|---|---|---|
| 614 | 100.0% | 0 | 0.0% | ||||
| Source:[2] | |||||||
General election
| 2012 presidential election | ||||
|---|---|---|---|---|
| Candidates | Party | Votes | % | |
| Vladimir Putin | United Russia | 45,602,075 | 63.60 | |
| Gennady Zyuganov | Communist Party | 12,318,353 | 17.18 | |
| Mikhail Prokhorov | Independent | 5,722,508 | 7.98 | |
| Vladimir Zhirinovsky | Liberal Democratic Party | 4,458,103 | 6.22 | |
| Sergey Mironov | A Just Russia | 2,763,935 | 3.85 | |
| Source: [3] | ||||
2018
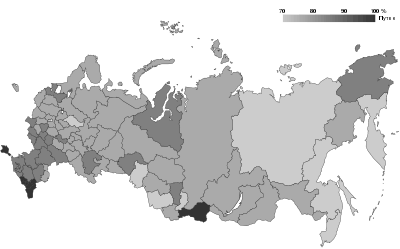
2018 election. Gray indicates a win by Putin.
| 2018 presidential election | ||||
|---|---|---|---|---|
| Candidates | Party | Votes | % | |
| Vladimir Putin | Independent | 56,430,712 | 76.69 | |
| Pavel Grudinin | Communist Party | 8,659,206 | 11.77 | |
| Vladimir Zhirinovsky | Liberal Democratic Party | 4,154,985 | 5.65 | |
| Ksenia Sobchak | Civic Initiative | 1,238,031 | 1.68 | |
| Grigory Yavlinsky | Yabloko | 769,644 | 1.05 | |
| Boris Titov | Party of Growth | 556,801 | 0.76 | |
| Maxim Suraykin | Communists of Russia | 499,342 | 0.68 | |
| Sergey Baburin | Russian All-People's Union | 479,013 | 0.65 | |
| Source: CEC | ||||
Prime Minister nomination
1999
| For | Against | Abstaining | No voting | ||||
|---|---|---|---|---|---|---|---|
| 233 | 51.8% | 84 | 18.7% | 17 | 3.8% | 105 | 23.3% |
| Source: [4] | |||||||
2008
| For | Against | Abstaining | No voting | ||||
|---|---|---|---|---|---|---|---|
| 392 | 87.1% | 56 | 12.4% | 0 | 0.0% | 2 | 0.4% |
| Source: [5] | |||||||
References
- ↑ University of Essex
- ↑ "Единая Россия" выдвинула Путина кандидатом в президенты РФ от партии
- ↑ Central Election Commission of the Russian Federation
- ↑ Справка о результатах голосования по вопросу: Дать согласие на назначение Председателя Правительства РФ
- ↑ Справка о результатах голосования по вопросу: Дать согласие на назначение Председателя Правительства РФ
| ||
| Political activities |
| .jpg) |
| Presidency |
| |
| Domestic policy | ||
| Foreign policy | ||
| Family |
| |
| Public image |
| |
| ||
Electoral histories of the Presidents of Russia | ||
|---|---|---|
 | ||
This article is issued from
Wikipedia.
The text is licensed under Creative Commons - Attribution - Sharealike.
Additional terms may apply for the media files.