Edmonton-North West
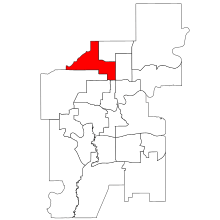 Edmonton-North West within the City of Edmonton (2017 boundaries) | |||
| Provincial electoral district | |||
| Legislature | Legislative Assembly of Alberta | ||
| MLA |
| ||
| District created | 1957 | ||
| First contested | 1959 | ||
| Last contested | 1967 | ||
| Demographics | |||
| Population (2016)[1] | 45,523 | ||
| Area (km²) | 29.9 | ||
| Pop. density (per km²) | 1,522.5 | ||
Edmonton-North West is a provincial electoral district in Alberta, Canada that has existed twice, first as Edmonton North West between 1959 and 1971, and for a second time after 2019. The district will be one of 87 districts mandated to return a single member (MLA) to the Legislative Assembly of Alberta using the first past the post method of voting. It will be contested next in the 2019 Alberta election.
Geography
The district is located in northwest Edmonton, containing the neighbourhoods of Lauderdale, Rosslyn, Kensington, Griesbach, Carlisle, Caernarvon, Baranow, Hudson, Cumberland, Oxford, Carlton, and The Palisades, as well as the area west of 142 St NW and north of 137 Ave NW to the border with St. Albert.
History
Boundary History
The district was created as Edmonton North West in the 1959 redistribution which broke up the mega-ridings of Edmonton and Calgary, creating a number of single-member districts in their place. It was replaced with Edmonton-Calder in 1971, but re-created from the same riding in 2017 when the Electoral Boundaries Commission recommended moving the Calder neighbourhood (among others) out of the riding.[2] The district also gained three neighbourhoods from Edmonton-Castle Downs.
Representation history
| Members for Edmonton-North West | ||||
|---|---|---|---|---|
| Assembly | Years | Member | Party | |
| See Edmonton 1921–1959 | ||||
| 14th | 1959–1963 | Edgar Gerhart | Social Credit | |
| 15th | 1963–1967 | |||
| 16th | 1967–1971 | |||
| See Edmonton-Calder 1971–1993 and 1997–2019 | ||||
| 30th | 2019– | To be determined | ||
The district was represented from 1959 to 1971 by Edgar Gerhart of the Alberta Social Credit Party, who had already served as one of several MLAs for Edmonton before it was split. He served as Minister of Municipal Affairs under premier Ernest Manning for his final term, and briefly as Attorney General as well under Harry Strom. Gerhart was defeated in Edmonton-Calder in the 1971 election.
Electoral results
Elections in the 1950s
| Alberta general election, 1959 | ||||||||
|---|---|---|---|---|---|---|---|---|
| Party | Candidate | Votes | % | |||||
| Social Credit | Edgar Gerhart | 4,823 | 42.72 | |||||
| Progressive Conservative | Ned Feehan | 3,249 | 28.78 | |||||
| Liberal | Harper McCrae | 2,071 | 18.35 | |||||
| Co-operative Commonwealth | James Forest | 1,146 | 10.15 | |||||
| Total valid votes | 11,289 | 99.79 | ||||||
| Rejected, spoiled and declined | 24 | 0.21 | ||||||
| Registered electors / Turnout | 19,258 | 58.74 | ||||||
| Social Credit pickup new district. | ||||||||
Source(s) | ||||||||
Elections in the 1960s
| Alberta general election, 1963 | ||||||||
|---|---|---|---|---|---|---|---|---|
| Party | Candidate | Votes | % | ±% | ||||
| Social Credit | Edgar Gerhart | 4,369 | 46.03 | +3.31 | ||||
| Progressive Conservative | Ned Feehan | 1,878 | 19.79 | -8.99 | ||||
| Liberal | Edmund H. Leger | 1,854 | 19.53 | +1.18 | ||||
| New Democratic | Grant Notley | 1,391 | 14.65 | +4.50 | ||||
| Total valid votes | 9,492 | 99.87 | +0.08 | |||||
| Rejected, spoiled and declined | 12 | 0.13 | -0.08 | |||||
| Registered electors / Turnout | 19,695 | 48.26 | -10.48 | |||||
| Social Credit hold | Swing | +6.15 | ||||||
Source(s) | ||||||||
| Alberta general election, 1967 | ||||||||
|---|---|---|---|---|---|---|---|---|
| Party | Candidate | Votes | % | ±% | ||||
| Social Credit | Edgar Gerhart | 4,674 | 36.22 | -9.81 | ||||
| Progressive Conservative | Paul Norris | 4,205 | 32.59 | +12.80 | ||||
| New Democratic | Dave Belland | 2,664 | 20.64 | +5.99 | ||||
| Liberal | Thomas Leia | 1,173 | 9.09 | -10.44 | ||||
| Independent | Oscar A. Green | 188 | 1.46 | – | ||||
| Total valid votes | 12,904 | 99.68 | -0.19 | |||||
| Rejected, spoiled and declined | 42 | 0.32 | +0.19 | |||||
| Registered electors / Turnout | 20,533 | 63.05 | +14.79 | |||||
| Social Credit hold | Swing | -11.31 | ||||||
Source(s) | ||||||||
Elections in the 2010s
| Redistributed results, Alberta general election, 2015 | ||||
|---|---|---|---|---|
| Party | Votes | % | ||
| New Democratic | 10,315 | 69.13% | ||
| Progressive Conservative | 2,865 | 19.20% | ||
| Wildrose | 1,241 | 8.32% | ||
| Liberal | 501 | 3.36% | ||
| Alberta general election, 2019 | ||||||||
|---|---|---|---|---|---|---|---|---|
| Party | Candidate | Votes | % | ±% | ||||
| United Conservative | Ali Eltayeb | |||||||
| Total valid votes | ||||||||
| Rejected, spoiled and declined | ||||||||
| Registered electors | ||||||||
| Turnout | ||||||||
References
- ↑ Statistics Canada: 2016
- ↑ Alberta Electoral Boundaries Commission (Oct 2017). "Final Report" (PDF). p. 47. Retrieved 2018-01-30.
 |
St. Albert | Morinville-St. Albert | Edmonton-Castle Downs |
| |||
| Edmonton-West Henday | Edmonton-Decore | ||||||
| Edmonton-Glenora | Edmonton-City Centre | Edmonton-Highlands-Norwood |