Calgary-Fort
 2010 boundaries | |||
| Provincial electoral district | |||
| Legislature | Legislative Assembly of Alberta | ||
| MLA |
New Democratic | ||
| District created | 1996 | ||
| First contested | 1997 | ||
| Last contested | 2015 | ||
Calgary-Fort is a provincial electoral district for the Legislative Assembly of Alberta, Canada.
The Electoral District is named after historical Fort Calgary. The district lies in the Central SE of the city.
The first election in Calgary Fort was held in 1997, it was created out of Calgary East. The Riding covers some of the cities older blue collar neighbourhoods including Forest Lawn, Dover, Inglewood, Lynwood Ridge, Ogden, Erinwoods and the Foothills Industrial Park. The riding is largely broken with three distinct residential sections surrounded by industrial areas.
The riding has suffered from a number of environmental problems in recent years caused by heavy industry. Soil contamination from the old oil refinery in Lynwood Ridge has created a ghost town of houses in limbo. Canadian Pacific Railway has also been to blame for heavy soil contamination affecting residents along the tracks in Ogden by a chemical known as Trichloroethylene used as a track degreaser. In 1999 the Hub Oil refinery just east of Erin Woods exploded raining contamination on the neighbourhood. The riding also has a quarantined site where the Inglewood Refinery used to be for soil contamination problems.
The riding had been a Progressive Conservative stronghold and was held continuously by PC MLA Wayne Cao since its creation in 1997 until the 2015 election, when the riding was won by New Democrat Joe Ceci.
History
The electoral district was created in the 1996 boundary redistribution out of Calgary-East. The riding had significant changes in the 2010 boundary redistribution. It was expanded to meet the new boundaries of the city of Calgary and gained some rural portions that had belonged to Foothills-Rocky View. It also gained the neighborhoods of Ramsay that was previously in Calgary-Egmont and East Village which was in Calgary-Buffalo. The riding also expanded south into industrial land that was formerly part of Calgary-Hays.
Boundary history
| 11 Calgary-Fort 2003 Boundaries[1] | |||
|---|---|---|---|
| Bordering Districts | |||
| North | East | West | South |
| Calgary-Mountain View, Calgary-East, Calgary-Montrose | Airdrie-Chestermere | Calgary-Buffalo, Calgary-Egmont | Calgary-Egmont, Calgary-Hays |
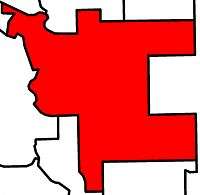
| riding map goes here | 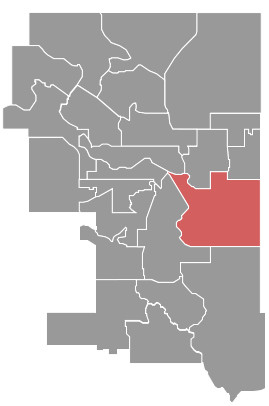 | ||
| Legal description from the Statutes of Alberta 2003, Electoral Divisions Act. | |||
| Starting at the intersection of the left bank of the Elbow River with the right bank of the Bow River; then 1. southeast along the right bank of the Bow River to the westerly extension of 26 Avenue SE; 2. east along the extension and 26 Avenue SE to 36 Street SE; 3. north along 36 Street SE to 8 Avenue SE; 4. east along 8 Avenue SE to 52 Street SE; 5. south along 52 Street SE to 17 Avenue SE; 6. east along 17 Avenue SE to the east Calgary city boundary; 7. south along the east Calgary city boundary to Glenmore Trail SE; 8. west and northwest along Glenmore Trail SE to the right bank of the Bow River; 9. north along the right bank of the Bow River to the Canadian Pacific Railway (CPR) line; 10. in a north westerly direction along the CPR line to the left bank of the Elbow River; 11. downstream along the left bank of the Elbow River to the starting point. | |||
| Note: | |||
| 12 Calgary-Fort 2010 Boundaries | |||
|---|---|---|---|
| Bordering Districts | |||
| North | East | West | South |
| Calgary-East, Calgary-Greenway and Calgary-Mountain View | Chestermere-Rocky View | Calgary-Acadia, Calgary-Buffalo and Calgary-Hays | Calgary-South East |
 |
| ||
| Legal description from the Statutes of Alberta 2010, Electoral Divisions Act. | |||
| Note: | |||
Electoral history
| Members of the Legislative Assembly for Calgary-Fort[2] | ||||
|---|---|---|---|---|
| Assembly | Years | Member | Party | |
| See Calgary-East 1993–1997 | ||||
| 24th | 1997–2001 | Wayne Cao | Progressive Conservative | |
| 25th | 2001–2004 | |||
| 26th | 2004–2008 | |||
| 27th | 2008–2012 | |||
| 28th | 2012–2015 | |||
| 29th | 2015–2019 | Joe Ceci | New Democratic | |
| See Calgary-Peigan 2019– | ||||
The electoral district of Calgary-Fort was created in the boundary redistribution of 1997. The district covers central south east Calgary and was carved primarily from Calgary-East. Progressive Conservative Wayne Cao won the district in the first election held in 1997 with just under half the popular vote.
Cao would run for his second term in 2001 and win a landslide victory winning almost 69% of the popular vote over a crowded field of eight candidates. He was re-elected in 2004 with a significantly reduced margin of victory taking just over half the popular vote.
Cao stood for a fourth term in the 2008 election and for the first time since 1997 he won less than half of the popular vote in one of the lowest voter turnout races in the province.
Legislature results
| Alberta general election, 1997 | ||||||||
|---|---|---|---|---|---|---|---|---|
| Party | Candidate | Votes | % | |||||
| Progressive Conservative | Wayne Cao | 4,410 | 48.82% | |||||
| Liberal | Shirley-Anne Reuben | 2,817 | 31.18% | |||||
| Social Credit | Bren Blanchet | 916 | 10.14% | |||||
| New Democratic | Ken Sahil | 891 | 9.86% | |||||
| Total | 9,034 | |||||||
| Rejected, spoiled and declined | 53 | |||||||
| Eligible electors / Turnout | 21,947 | 41.40% | ||||||
| Source: "1997 General Election". Elections Alberta. Retrieved January 26, 2012. | ||||||||
| Alberta general election, 2001 | ||||||||
|---|---|---|---|---|---|---|---|---|
| Party | Candidate | Votes | % | ±% | ||||
| Progressive Conservative | Wayne Cao | 6,740 | 68.38% | 19.56% | ||||
| Liberal | Brian Huskins | 2,004 | 20.39% | −10.79% | ||||
| New Democratic | Vinay Dey | 501 | 5.10% | −4.76% | ||||
| Social Credit | Raymond Hurst | 160 | 1.61% | −8.53% | ||||
| Green | Michael Alvarez-Toye | 121 | 1.27% | |||||
| Independent | Metro Demchynski | 102 | 1.04% | |||||
| Independent | Brian Slater | 100 | 1.02% | |||||
| Alberta First | Wyatt McIntyre | 99 | 1.01% | |||||
| Total | 9,827 | |||||||
| Rejected, spoiled and declined | 56 | |||||||
| Eligible electors / Turnout | 22,882 | 43.19% | ||||||
| Progressive Conservative hold | Swing | 15.18% | ||||||
| Source: "2001 Statement of Official results Calgary-Fort" (PDF). Elections Alberta. Retrieved March 3, 2010. | ||||||||
| Alberta general election, 2004 | ||||||||
|---|---|---|---|---|---|---|---|---|
| Party | Candidate | Votes | % | ±% | ||||
| Progressive Conservative | Wayne Cao | 4,139 | 53.89% | −14.49% | ||||
| Liberal | Gerry Hart | 1,786 | 23.25% | 2.86% | ||||
| New Democratic | Elizabeth Thomas | 584 | 7.60% | 2.50% | ||||
| Alberta Alliance | Travis Chase | 524 | 6.82% | |||||
| Green | Tyler Charkie | 439 | 5.72% | 4.45% | ||||
| Separation | Leo Ollenberger | 211 | 2.72% | 1.71%1 | ||||
| Total | 7,681 | |||||||
| Rejected, spoiled and declined | 95 | |||||||
| Eligible electors / Turnout | 23,271 | 33.42% | ||||||
| Progressive Conservative hold | Swing | −8.68% | ||||||
| Source: "Calgary-Fort Statement of Official Results 2004 Alberta general election" (PDF). Elections Alberta. Retrieved March 3, 2010. | ||||||||
| ||||||||
| Alberta general election, 2008 | ||||||||
|---|---|---|---|---|---|---|---|---|
| Party | Candidate | Votes | % | ±% | ||||
| Progressive Conservative | Wayne Cao | 4,123 | 49.81% | −4.08% | ||||
| Liberal | Carole Oliver | 1,770 | 21.39% | −1.86 | ||||
| New Democratic | Julie Hrdlicka | 1,178 | 14.23% | 6.63% | ||||
| Wildrose Alliance | Travis Chase | 715 | 8.64% | 1.82% | ||||
| Green | Mark Taylor | 491 | 5.93% | 0.21% | ||||
| Total | 8,277 | |||||||
| Rejected, Spoiled and Declined | 32 | |||||||
| Eligible electors / Turnout | 28,974 | 28.68% | ||||||
| Progressive Conservative hold | Swing | −2.97% | ||||||
| Source: "Calgary-Fort Statement of Official Results 2008 Alberta general election" (PDF). Elections Alberta. pp. 210–212. Retrieved March 3, 2010. | ||||||||
| Alberta general election, 2012 | ||||||||
|---|---|---|---|---|---|---|---|---|
| Party | Candidate | Votes | % | |||||
| Progressive Conservative | Wayne Cao | 4,829 | 40.77% | |||||
| Wildrose | Jeevan Mangat | 4,719 | 39.84% | |||||
| Liberal | Said Abdulbaki | 1,185 | 10.01% | |||||
| New Democratic | Don Monroe | 799 | 6.75% | |||||
| Evergreen | Janice Dixon | 312 | 2.63% | |||||
| Alberta general election, 2015 | ||||||||
|---|---|---|---|---|---|---|---|---|
| Party | Candidate | Votes | % | |||||
| New Democratic | Joe Ceci | 7,027 | 49.8 | |||||
| Progressive Conservative | Andy Nguyen | 3,204 | 22.8 | |||||
| Wildrose | Jeevan Mangat | 3,003 | 21.3 | |||||
| Liberal | Said Abdulbaki | 476 | 3.4 | |||||
| Alberta Party | Vic Goosen | 410 | 2.9 | |||||
| Total valid votes | 14,120 | 100.0 | ||||||
| Rejected, spoiled and declined | 159 | |||||||
| Turnout | 14,279 | 44.1 | ||||||
| Eligible voters | 32,411 | |||||||
| Source: Elections Alberta[3] | ||||||||
Senate nominee results
2004 Senate nominee election district results
| 2004 Senate nominee election results: Calgary-Fort[4] | Turnout 33.21% | |||||
| Affiliation | Candidate | Votes | % Votes | % Ballots | Rank | |
| Progressive Conservative | Bert Brown | 3,587 | 16.92% | 52.83% | 1 | |
| Progressive Conservative | Betty Unger | 2,797 | 13.19% | 41.23% | 2 | |
| Progressive Conservative | Jim Silye | 2,665 | 12.57% | 39.28% | 5 | |
| Progressive Conservative | Cliff Breitkreuz | 2,274 | 10.73% | 33.52% | 3 | |
| Progressive Conservative | David Usherwood | 2,028 | 9.57% | 29.89% | 6 | |
| Independent | Link Byfield | 1,869 | 8.82% | 27.55% | 4 | |
| Independent | Tom Sindlinger | 1,511 | 7.13% | 22.27% | 9 | |
| Alberta Alliance | Vance Gough | 1,509 | 7.12% | 22.24% | 8 | |
| Alberta Alliance | Michael Roth | 1,491 | 7.03% | 21.98% | 7 | |
| Alberta Alliance | Gary Horan | 1,470 | 6.92% | 21.67% | 10 | |
| Total Votes | 21,201 | 100% | ||||
| Total Ballots | 6,784 | 3.13 Votes Per Ballot | ||||
| Rejected, Spoiled and Declined | 945 | |||||
| 23,271 Eligible Electors | ||||||
Voters had the option of selecting 4 Candidates on the Ballot
Student Vote results
2004 election
| Participating Schools[5] |
|---|
| Ian Bazalgette Jr. High School |
| Sherwood School |
On November 19, 2004 a Student Vote was conducted at participating Alberta schools to parallel the 2004 Alberta general election results. The vote was designed to educate students and simulate the electoral process for persons who have not yet reached the legal majority. The vote was conducted in 80 of the 83 provincial electoral districts with students voting for actual election candidates. Schools with a large student body that reside in another electoral district had the option to vote for candidates outside of the electoral district then where they were physically located.
| 2004 Alberta Student Vote results[6] | ||||
| Affiliation | Candidate | Votes | % | |
| Progressive Conservative | Wayne Cao | 53 | 38.13% | |
| Green | Tyler Charkie | 40 | 28.78% | |
| Liberal | Gerry Hart | 25 | 17.99% | |
| Alberta Alliance | Travis Chase | 8 | 5.75% | |
| Separation | Leo Ollenberger | 7 | 5.04% | |
| NDP | Elizabeth Thomas | 6 | 4.31% | |
| Total | 139 | 100% | ||
| Rejected, Spoiled and Declined | 0 | |||
2012 election
| 2012 Alberta Student Vote results | ||||
| Affiliation | Candidate | Votes | % | |
| Progressive Conservative | Jason Luan | % | ||
| Wildrose | Jeevan Mangat | |||
| Liberal | Said Abdulbaki | % | ||
| New Democratic | Don Monroe | % | ||
| Social Credit | % | |||
| Total | ' | 100% | ||
References
- ↑ "E‑4.1". Statutes of the Province of Alberta. Government of Alberta. 2003. pp. 10–11.
- ↑ "Members of the Legislative Assembly of Alberta 1905-2006" (PDF). Legislative Assembly of Alberta. Archived from the original (PDF) on September 30, 2007. Retrieved February 27, 2010.
- ↑ "2015 Provincial General Election Results". Elections Alberta. Archived from the original on 2017-07-30. Retrieved 2017-07-30.
- ↑ "Senate Nominee Election 2004 Tabulation of Official Results" (PDF). Elections Alberta. Archived from the original (PDF) on July 4, 2009. Retrieved February 28, 2010.
- ↑ "School by School results". Student Vote Canada. Archived from the original on October 5, 2007. Retrieved 2008-04-18.
- ↑ "Riding by Riding Results - the Candidates". Student Vote Canada. Archived from the original on October 6, 2007. Retrieved 2008-04-19.