Edmonton-Calder
 2010 boundaries | |||
| Provincial electoral district | |||
| Legislature | Legislative Assembly of Alberta | ||
| MLA |
New Democratic | ||
| District created | 1971 | ||
| District abolished | 1993 | ||
| District re-created | 1996 | ||
| First contested | 1971 | ||
| Last contested | 2015 | ||
Edmonton-Calder is a provincial electoral district in Alberta, Canada. A district with this name has existed twice, with the first incarnation existing from 1971 to 1993 and the second from 1996 to present. The current district was last contested in the 2015 election, when it re-elected NDP candidate David Eggen.
History
The first Edmonton-Calder electoral district was created in the 1971 boundary redistribution from the electoral districts of Edmonton North West and Edmonton North. It was abolished in 1993 to create parts Edmonton-Mayfield and Edmonton-Roper.
Calder was re-created in the same general area out of Mayfield and Roper in the 1996 boundary redistribution. In 2010 the boundaries were significantly redrawn. The northern boundaries were pushed from 137 Avenue to the Edmonton city limits between 127 Street and 184 Street into land that used to be part of Edmonton-Castle Downs. The south boundary which used to run along Stony Plain Road was pushed north to Yellowhead Trail ceding land to Edmonton-Meadowlark and Edmonton-Glenora.
Boundary history
| 26 Edmonton-Calder 2003 Boundaries[1] | |||
|---|---|---|---|
| Bordering Districts | |||
| North | East | West | South |
| Edmonton-Castle Downs, St. Albert | Edmonton-Decore, Edmonton-Highlands-Norwood | Spruce Grove-Sturgeon-St. Albert | Edmonton-Centre, Edmonton-Glenora, Edmonton-Meadowlark |
| riding map goes here | 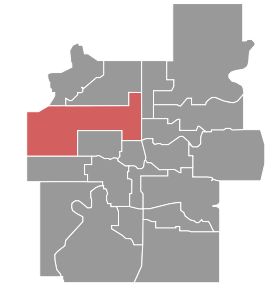 | ||
| Legal description from the Statutes of Alberta 2003, Electoral Divisions Act. | |||
| Starting at the intersection of the west Edmonton city boundary with the south shore of Big Lake; then 1. northeast along the city boundary to the intersection with 137 Avenue; 2. east along 137 Avenue to 113A Street (Castle Downs Road); 3. north along 113A Street to 153 Avenue; 4. east along 153 Avenue to 97 Street; 5. south along 97 Street to 111 Avenue; 6. west along 111 Avenue to 121 Street; 7. north along 121 Street and its northerly extension to 118 Avenue; 8. west along 118 Avenue to the northbound lanes of 170 Street; 9. south along the northbound lanes of 170 Street to Stony Plain Road; 10. west along Stony Plain Road to the west Edmonton city boundary; 11. north along the west city boundary to the starting point. | |||
| Note: | |||
| 29 Edmonton-Calder 2010 Boundaries | |||
|---|---|---|---|
| Bordering Districts | |||
| North | East | West | South |
| Athabasca-Sturgeon-Redwater, Edmonton-Castle Downs and St. Albert | Edmonton-Decore and Edmonton-Highlands-Norwood | Spruce Grove-St. Albert | Edmonton-Centre, Edmonton-Glenora and Edmonton-Meadowlark |
 |
| ||
| Legal description from the Statutes of Alberta 2010, Electoral Divisions Act. | |||
| Note: | |||
Electoral history
| Members of the Legislative Assembly for Edmonton-Calder | ||||
|---|---|---|---|---|
| Assembly | Years | Member | Party | |
| See Edmonton North West 1959–1971 and Edmonton North 1959–1971 | ||||
| 17th | 1971–1975 | Tom Chambers | Progressive Conservative | |
| 18th | 1975–1979 | |||
| 19th | 1979–1982 | |||
| 20th | 1982–1986 | |||
| 21st | 1986–1989 | Christie Mjolsness | NDP | |
| 22nd | 1989–1993 | |||
| See Edmonton-Mayfield 1993–1997 and Edmonton-Roper 1993–1997 | ||||
| 24th | 1997–2001 | Lance White | Liberal | |
| 25th | 2001–2004 | Brent Rathgeber | Progressive Conservative | |
| 26th | 2004–2008 | David Eggen | NDP | |
| 27th | 2008–2012 | Doug Elniski | Progressive Conservative | |
| 28th | 2012–2015 | David Eggen | NDP | |
| 29th | 2015–2019 | |||
| See Edmonton-City Centre, Edmonton-West Henday and Edmonton-North West 2019– | ||||
The electoral district has existed twice since it was first created in 1971. The election held that year saw a hotly contested race between Social Credit incumbent Edgar Gerhart who had been MLA for the old electoral district of Edmonton Northwest and Progressive Conservative candidate Tom Chambers. On election night Chambers defeated Gerhart with just over 50% of the popular vote. His party went on to form its first government that election .
Chambers won his second term in 1975 with a landslide majority of almost 75% of the popular vote. He would be appointed to a cabinet portfolio in the government of Peter Lougheed in 1979. Chambers was re-elected twice more in 1979 and 1982 with shrinking majorities. He retired from office at dissolution in 1986.
The 1986 election was won by NDP candidate Christie Mjolsness. She had previously run against Chambers in the 1982 election and increased the percentage of her popular vote and won on the collapse of the Progressive Conservative vote despite losing raw popular vote. She was re-elected in 1989 in a hotly contested battle with Liberal candidate Lance White.
The riding was abolished in 1993 and redistricted to make Edmonton-Mayfield and Edmonton-Roper. Mjolsness would run for re-election in Roper and be defeated while White would run in Mayfield and be elected defeating incumbent Alex McEachern.
Calder would be re-created out of the two ridings in the 1996 boundary redistribution. White and McEachern would face each other for the second time with White coming out the victor. White would win just over 40% of the popular vote while McEachern finished in third place.
The riding would change hands in 2001 in a very closely contested election as Progressive Conservative candidate Brent Rathgeber defeated White with just over 40% of the popular vote. The NDP would return to office in the next election as NDP candidate David Eggen defeated Rathgeber by a close margin with just over 36% of the popular vote.
The 2008 election would see Eggen defeated by Progressive Conservative candidate Doug Elniski in another close race, with Elniski picking up 41% of the popular vote to Eggen's 40%. Elinski announced his retirement, and did not run again in the 2012 election.
David Eggen was returned to office in the 2012 general election and in the 2015 general election. The 2012 election was another close race, with under 4% difference between Eggen and PC Bev Esslinger. During the 2015 election, Eggen was re-elected with over 70% of the popular vote, marking one of the best results for the provincial NDP in the province.
Legislature results 1971-1993
1971 general election
| 1971 Alberta general election results[2] | Turnout 72.43% | Swing | ||||
| Affiliation | Candidate | Votes | % | Party | Personal | |
| Progressive Conservative | Tom Chambers | 5,931 | 52.23% | |||
| Social Credit | Edgar Gerhart | 3,653 | 32.17% | |||
| New Democratic | Bill Glass | 1,772 | 15.60% | |||
| Total | 11,356 | |||||
| Rejected, spoiled and declined | 48 | |||||
| Eligible electors / Turnout | 15,774 | % | ||||
1975 general election
| 1975 Alberta general election results[3] | Turnout 50.20% | Swing | ||||
| Affiliation | Candidate | Votes | % | Party | Personal | |
| Progressive Conservative | Tom Chambers | 5,689 | 68.17% | 15.94% | ||
| New Democratic | Burke Barker | 1,640 | 19.65% | 4.05% | ||
| Liberal | Jack Pickett | 620 | 7.43% | * | ||
| Independent | Keith Lawson | 396 | 4.75% | |||
| Total | 8,345 | |||||
| Rejected, spoiled and declined | 26 | |||||
| Eligible electors / Turnout | 16,675 | % | ||||
| Progressive Conservative hold | Swing | 10.00% | ||||
1979 general election
| 1979 Alberta general election results[4] | Turnout 45.92% | Swing | ||||
| Affiliation | Candidate | Votes | % | Party | Personal | |
| Progressive Conservative | Tom Chambers | 5,205 | 58.47% | -9.70% | ||
| New Democratic | Bill Kobluk | 2,180 | 24.49% | 4.84% | ||
| Social Credit | Dan Service | 982 | 11.03% | |||
| Liberal | Richard Guthrie | 535 | 6.01% | -1.42% | ||
| Total | 8,902 | |||||
| Rejected, spoiled and declined | 45 | |||||
| Eligible electors / Turnout | 19,483 | % | ||||
| Progressive Conservative hold | Swing | -12.82% | ||||
1982 general election
| 1982 Alberta general election results[5] | Turnout 58.68% | Swing | ||||
| Affiliation | Candidate | Votes | % | Party | Personal | |
| Progressive Conservative | Tom Chambers | 8,442 | 55.38% | -3.09% | ||
| New Democratic | Christie Mjolsness | 5,527 | 36.26% | 11.77% | ||
| Western Canada Concept | Walter Stack | 1,274 | 8.36% | * | ||
| Total | 15,243 | |||||
| Rejected, spoiled and declined | 19 | |||||
| Eligible electors / Turnout | 26,010 | % | ||||
| Progressive Conservative hold | Swing | -7.43% | ||||
1986 general election
| 1986 Alberta general election results[6] | Turnout 45.58% | Swing | ||||
| Affiliation | Candidate | Votes | % | Party | Personal | |
| New Democratic | Christie Mjolsness | 5,114 | 50.70% | 14.44% | ||
| Progressive Conservative | Tony Falcone | 2,910 | 28.85% | -26.53% | ||
| Liberal | Al Iafolla | 1,925 | 19.09% | * | ||
| Western Canada Concept | Dave Draginda | 111 | 1.10% | -7.26% | * | |
| Communist | Martin Robbert | 26 | 0.26% | * | ||
| Total | 10,086 | |||||
| Rejected, spoiled and declined | 11 | |||||
| Eligible electors / Turnout | 22,153 | % | ||||
| NDP pickup from Progressive Conservative | Swing 20.49% | |||||
1989 general election
| 1989 Alberta general election results[7] | Turnout 55.05% | Swing | ||||
| Affiliation | Candidate | Votes | % | Party | Personal | |
| New Democratic | Christie Mjolsness | 5,338 | 42.77% | -7.93% | ||
| Liberal | Lance White | 4,435 | 35.53% | 16.44% | ||
| Progressive Conservative | Aldo De Luca | 2,709 | 21.70% | -7.15% | ||
| Total | 12,482 | |||||
| Rejected, spoiled and declined | 23 | |||||
| Eligible electors / Turnout | 22,714 | % | ||||
| NDP hold | Swing -12.19% | |||||
Legislature results 1997-present
1997 general election
| 1997 Alberta general election results[8] | Turnout 53.52% | Swing | ||||
| Affiliation | Candidate | Votes | % | Party | Personal | |
| Liberal | Lance White | 4,802 | 40.31% | * | ||
| Progressive Conservative | Lynn Faulder | 3,860 | 32.41% | |||
| New Democratic | Alex McEachern | 3,250 | 27.28% | |||
| Total | 11,912 | 100% | ||||
| Rejected, Spoiled and Declined | 31 | |||||
| 22,317 eligible electors | ||||||
| Liberal pickup new district | Swing N/A | |||||
2001 general election
| 2001 Alberta general election results[9] | Turnout 51.78% | Swing | ||||
| Affiliation | Candidate | Votes | % | Party | Personal | |
| Progressive Conservative | Brent Rathgeber | 5,128 | 41.99% | 9.58% | ||
| Liberal | Lance White | 4,654 | 38.10% | -2.21% | ||
| New Democratic | Christine Burdett | 2,432 | 19.91% | -7.37% | ||
| Total | 12,214 | 100% | ||||
| Rejected, Spoiled and Declined | 42 | |||||
| 23,671 eligible electors | ||||||
| Progressive Conservative gain from Liberal | Swing | 5.90% | ||||
2004 general election
| 2004 Alberta general election results[10] | Turnout 49.18% | Swing | ||||
| Affiliation | Candidate | Votes | % | Party | Personal | |
| New Democratic | David Eggen | 4,067 | 36.01% | 16.10% | ||
| Progressive Conservative | Brent Rathgeber | 3,730 | 33.02% | -8.97% | ||
| Liberal | Brad Smith | 2,985 | 26.43% | -11.67% | ||
| Alberta Alliance | Vicki Kramer | 513 | 4.54% | |||
| Total | 11,295 | |||||
| Rejected, spoiled, and declined | 92 | |||||
| Eligible electors / Turnout | 23,671 | % | ||||
| NDP pickup from Progressive Conservative | Swing 12.54% | |||||
2008 general election
| 2008 Alberta general election results[11] | Turnout 38.53% | Swing | ||||
| Affiliation | Candidate | Votes | % | Party | Personal | |
| Progressive Conservative | Doug Elniski | 4,557 | 40.86% | 6.03% | ||
| New Democratic | David Eggen | 4,356 | 39.05% | 3.04% | ||
| Liberal | Jim Kane | 1,839 | 16.49% | -9.94% | ||
| Green | Michael Brown | 402 | 3.60% | * | ||
| Total | 11,514 | |||||
| Rejected, spoiled, and declined | 59 | |||||
| Eligible electors / Turnout | 30,033 | % | ||||
| Progressive Conservative gain from New Democratic | Swing | 4.54% | ||||
2012 general election
| Alberta general election, 2012 | ||||||||
|---|---|---|---|---|---|---|---|---|
| Party | Candidate | Votes | % | ±% | * | |||
| NDP | David Eggen | 5,729 | 38.41% | |||||
| Progressive Conservative | Bev Esslinger | 5,183 | 34.75% | |||||
| Wildrose | Rich Neumann | 2,787 | 18.69% | |||||
| Liberal | Alex V Bosse | 970 | 6.50% | |||||
| Alberta Party | David Clark | 194 | 1.30% | |||||
| Social Credit | Margaret Saunter | 52 | 0.35% | |||||
| Total | '14925 | 100% | ||||||
2015 general election
| Alberta general election, 2015 | ||||||||
|---|---|---|---|---|---|---|---|---|
| Party | Candidate | Votes | % | |||||
| New Democratic | David Eggen | 12,837 | 70.7 | |||||
| Progressive Conservative | Tom Bradley | 3,222 | 17.8 | |||||
| Wildrose | Andrew Altimas | 1,565 | 8.6 | |||||
| Liberal | Amit Batra | 527 | 2.9 | |||||
| Total valid votes | 18,151 | 100.0 | ||||||
| Rejected, spoiled and declined | 90 | |||||||
| Turnout | 18,241 | 50.3 | ||||||
| Eligible voters | 36,266 | |||||||
| Source: Elections Alberta[12] | ||||||||
Senate nominee results
2004 Senate nominee election district results
| 2004 Senate nominee election results: Edmonton-Calder[13] | Turnout 49.21% | |||||
| Affiliation | Candidate | Votes | % Votes | % Ballots | Rank | |
| Progressive Conservative | Betty Unger | 4,272 | 15.41% | 46.54% | 2 | |
| Independent | Link Byfield | 3,553 | 12.81% | 38.71% | 4 | |
| Progressive Conservative | Bert Brown | 3,126 | 11.28% | 34.06% | 1 | |
| Progressive Conservative | Cliff Breitkreuz | 2,867 | 10.34% | 32.23% | 3 | |
| Independent | Tom Sindlinger | 2,662 | 9.60% | 29.00% | 9 | |
| Alberta Alliance | Michael Roth | 2,608 | 9.41% | 28.41% | 7 | |
| Alberta Alliance | Gary Horan | 2,292 | 8.27% | 24.97% | 10 | |
| Alberta Alliance | Vance Gough | 2,283 | 8.24% | 24.87% | 8 | |
| Progressive Conservative | David Usherwood | 2,210 | 7.97% | 24.08% | 6 | |
| Progressive Conservative | Jim Silye | 1,847 | 6.67% | 20.12% | 5 | |
| Total Votes | 27,720 | 100% | ||||
| Total Ballots | 9,179 | 3.02 Votes Per Ballot | ||||
| Rejected, Spoiled and Declined | 2,215 | |||||
Voters had the option of selecting 4 Candidates on the Ballot
Student Vote results
2004 election
| Participating Schools[14] |
|---|
| Major General Griesbach School |
| Sir John Thompson Junior High School |
| St. Edmund School |
| Winterburn School |
On November 19, 2004 a Student Vote was conducted at participating Alberta schools to parallel the 2004 Alberta general election results. The vote was designed to educate students and simulate the electoral process for persons who have not yet reached the legal majority. The vote was conducted in 80 of the 83 provincial electoral districts with students voting for actual election candidates. Schools with a large student body that reside in another electoral district had the option to vote for candidates outside of the electoral district then where they were physically located.
| 2004 Alberta Student Vote results[15] | ||||
| Affiliation | Candidate | Votes | % | |
| Liberal | Brad Smith | 241 | 40.30% | |
| NDP | David Eggen | 170 | 28.43% | |
| Progressive Conservative | Brent Rathgeber | 114 | 19.06% | |
| Alberta Alliance | Vicki Kramer | 73 | 12.21% | |
| Total | 598 | 100% | ||
| Rejected, Spoiled and Declined | 19 | |||
2012 election
| 2012 Alberta Student Vote results | ||||
| Affiliation | Candidate | Votes | % | |
| Progressive Conservative | Bev Esslinger | % | ||
| Wildrose | Don Martin | |||
| Liberal | Alex V Bosse | % | ||
| Alberta Party | David Clark | |||
| NDP | David Eggen | % | ||
| Total | ' | 100% | ||
References
- ↑ "E‑4.1". Statutes of the Province of Alberta. Government of Alberta. 2003. p. 16.
- ↑ "Edmonton-Calder Official Results 1971 Alberta general election". Alberta Heritage Community Foundation. Retrieved March 1, 2010.
- ↑ "Edmonton-Calder Official Results 1975 Alberta general election". Alberta Heritage Community Foundation. Retrieved March 1, 2010.
- ↑ "Edmonton-Calder Official Results 1979 Alberta general election". Alberta Heritage Community Foundation. Retrieved March 1, 2010.
- ↑ "Edmonton-Calder Official Results 1982 Alberta general election". Alberta Heritage Community Foundation. Retrieved March 1, 2010.
- ↑ "Edmonton-Calder Official Results 1986 Alberta general election". Alberta Heritage Community Foundation. Retrieved March 1, 2010.
- ↑ "Edmonton-Calder Official Results 1989 Alberta general election". Alberta Heritage Community Foundation. Retrieved March 1, 2010.
- ↑ "1997 General Election". Elections Alberta. Retrieved January 26, 2012.
- ↑ "2001 Statement of Official results Edmonton-Beverly-Clareview" (PDF). Elections Alberta. Retrieved March 3, 2010.
- ↑ "Edmonton-Calder Statement of Official Results 2004 Alberta general election" (PDF). Elections Alberta. Retrieved February 12, 2012.
- ↑ The Report on the March 3, 2008 Provincial General Election of the Twenty-seventh Legislative Assembly. Elections Alberta. July 28, 2008. pp. 272–275.
- ↑ "2015 Provincial General Election Results". Elections Alberta. Archived from the original on 2017-08-04. Retrieved 2017-08-04.
- ↑ "Senate Nominee Election 2004 Tabulation of Official Results" (PDF). Elections Alberta. Archived from the original (PDF) on July 4, 2009. Retrieved February 28, 2010.
- ↑ "School by School results". Student Vote Canada. Archived from the original on October 5, 2007. Retrieved 2008-04-18.
- ↑ "Riding by Riding Results - the Candidates". Student Vote Canada. Archived from the original on October 6, 2007. Retrieved 2008-04-19.